Comparing different crop and pasture sequences
Author: Roger Lawes | Date: 13 Nov 2013
Roger Lawes,
CSIRO Ecosystem Sciences
Keywords: break crops, crop rotations, profitability
Take home messages:
- Break crops can help increase the returns from future wheat crops.
- Break crops are profitable when the expected increase in return from future wheat crops exceeds the opportunity cost of growing a break crop instead of a wheat crop.
- An economic simulation study for sand over gravel soil type at Kojonup demonstrates how a loss making pasture can generate future profits through higher wheat yields.
- The higher wheat yields occur because soil borne disease is controlled and weeds are controlled.
Background
Crop rotation is one of the oldest practices in agriculture. Almost everyone “knows” crops should be rotated, or at least grown in sequence. For a crop to reach yield potential, it must be free of weeds and disease. The key objective of a break crop, like a legume or oilseed, is to help restore the paddock to a weed and disease free state for a subsequent main crop.
So, can you grow the break crop profitably, and increase returns above and beyond what could be achieved with a continuous cereal crop sequence?
The question is complex. Does the break crop make a profit in its own right that is equivalent to the dominant cereal crop? If so, then break crops can be grown regularly to keep weeds and diseases at low levels. In many instances, canola can be grown profitably in rotation with wheat.
If wheat yields, or the yields of the dominant crop, have declined to a level that is uneconomic, then a break crop must be grown because there are no productive options left for that paddock and without some intervention it will remain unprofitable.
However, outside of these scenarios, the risks and rewards of growing a break crop are more complex. There is usually an opportunity cost (the difference in profit between the break crop and main crop) of growing a break crop. The profit of subsequent cereal crops must increase sufficiently to at least cover this opportunity cost. Furthermore, the break crop must ensure that weeds and disease are controlled. If it does not, then there will be no benefit to growing a break crop.
When can a break crop lower risk and increase profits?
- When there is a high disease or weed pressure that substantially lowers wheat yields.
- When N is limiting yield, if a legume break crop is grown
Methods
We used an economic model to capture the costs and benefits of including a break crop in the rotation. The changes in weed population and disease are simulated. The yield for the respective crops and pastures are generated using the APSIM crop model. The yields were simulated for Kojonup on a sand over gravel soil type.
The economic simulation compared three rotations:
- Three successive wheat crops.
- A legume dominant pasture where weed management was a high priority followed by two wheat crops.
- A canola crop where weeds were managed, but not as well as they could have been in a pasture followed by two wheat crops.
Results
In the continuous wheat system, designed to simulate wheat yields on a poor sand over gravel soil type in the Kojonup region, cereal yields are almost 0.5 t/ha lower than wheat yields grown following a break crop (Figure 1). This is because the crop has high levels of disease and weeds relative to the crops grown following a break crop (Figure 2). In contrast, disease levels in the wheat crop are suppressed by both the pasture break and canola break. The pasture also reduced the weed pressure (Figure 2). Since it was a legume, this ensured the wheat crop was sown into a weed free, disease free and nutrient rich environment that minimised fertilisers costs.
Overall, profits for each crop change through time. For the canola-wheat-wheat sequence, high profits were produced every year (Figure 3). However, weeds increased in that system, and eventually they will need to be managed. The profits from the continuous wheat sequence declined in every year, as the disease and weed levels increased. In contrast, the pasture system delivered the most ‘peaky’ profits, where a loss occurred under the pasture, but the wheat crops yielded well in both years (Figure 3).

Figure 1. Wheat yield for wheat crops grown after wheat, a canola break crop or a pasture managed to reduce weeds and maximise nitrogen inputs. Wheat crop number refers to the wheat crop grown after wheat, pasture or canola, where the crop sequences was either wheat-wheat-wheat, canola-wheat-wheat or pasture-wheat-wheat.
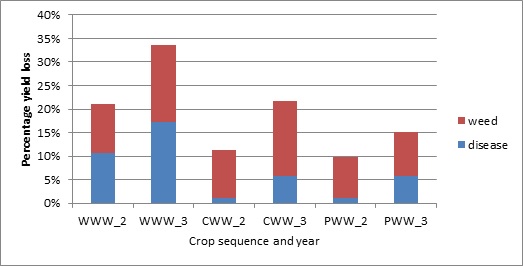
Figure 2. The percentage yield loss to the wheat crop as a result of weeds and disease pressure for wheat grown after wheat (WWW) , a canola break crop (CWW) or a pasture (PWW) for the second and third year of the crop sequence.
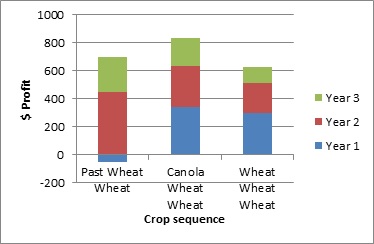
Figure 3. Profits generated in each year of three different crop sequences. The size of the bar indicates the amount of profit generated for that year.
Over the three years the pasture wheat sequence was more profitable than the continuous wheat sequence (Figure 3) and demonstrates how a break from cropping can overcome an apparent missed opportunity to grow a cereal crop.
Contact details
Roger Lawes
CSIRO Sustainable Agriculture Flagship
Was this page helpful?
YOUR FEEDBACK