Economics and management of P nutrition and multiple nutrient decline
Author: Jim Laycock, Incitec Pivot Fertilisers | Date: 26 Feb 2014
Author
Jim Laycock (Incitec Pivot Fertilisers)
Take home message
- All fertiliser programmes be they N, P, K, S or trace elements need to demonstrate an immediate or longer term return on investment.
- Early availability to phosphorus is crucial, phosphorus deficiency limits wheat grain yield principally by depressing early growth, leaf emergence rate and maximum rate of tiller emergence (Rodriguez et al. 1999)
- Better placement of phosphorus has the potential to increase phosphorus use efficiency in cropping systems on all soil types.
- There needs to be strong scientific based evidence to support any change in phosphorus management strategies
Economics of P nutrition
All fertiliser programmes be they N, P, K, S or trace elements need to demonstrate a return on investment. This $ return is most effective, and welcome, when it is attained in the year of application as at the IPF Long Trial site in 2013 at Grenfell in central NSW on a red kandosol shown below in figure 1.
Figure 1. IPF Long Trial site in 2013 at Grenfell in central NSW on a red kandosol. Text description follows image.
Statistical analysis not yet available.
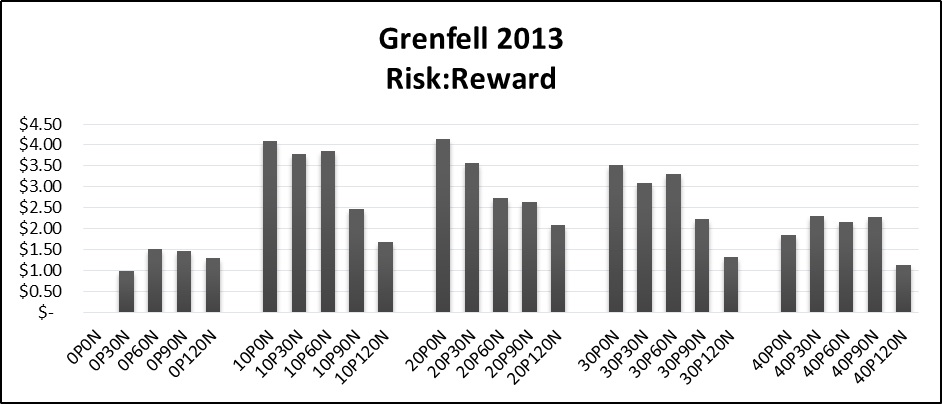
Figure 1 text description:
- 0P0N zero dollars, 0P30N $1.00, 0P60N $1.50, 0P90N $1.50, 0P120N $1.25
- 10P0N $4.00, 10P30N $3.75, 10P60N $3.80, 10P90N $2.50, 10P120N $1.75
- 20P0N $4.10, 20P30N $3.50, 20P60N $2.25, 20P90N $2.20, 20P120N $2.00
- 30P0N $3.50, 30P30N $3.00, 30P60N $3.25, 30P90N $2.25, 30P120N $1.25
- 40P0N $1.75, 40P30N $2.25, 40P60N $2.20, 40P90N $2.25, 40P120N $1.10
At 26mg/kg and 31mg/kg Colwell P respectively the 10kgs/ha/P and 20kgs/ha/P @ $3/kg of P produced the best return from $/fertiliser for a range of treatments including nitrogen ($1.30kgs/N) with an increase in wheat yield after canola in 2012.
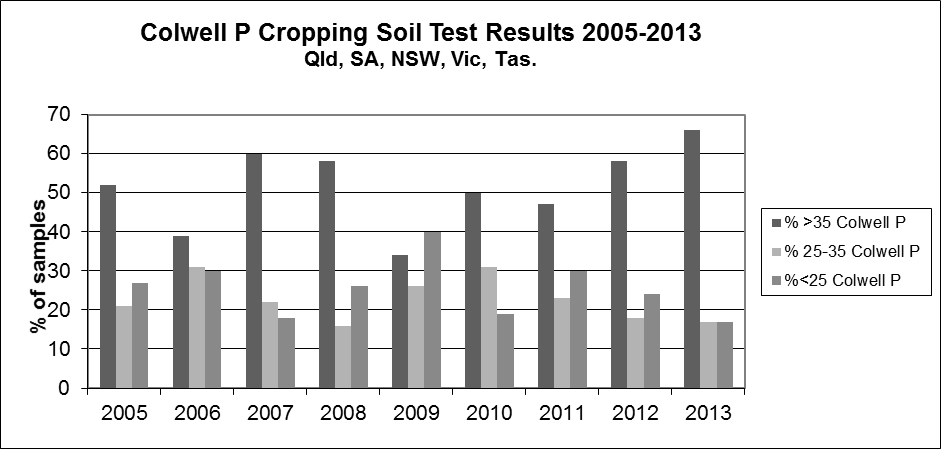
However with all nutrients applied through organic or inorganic nutrient application programs the ROI may take a longer period of time. An example of the long term return on investment is often the result of a build up in soil phosphorus levels over time due to inputs of P exceeding outputs of phosphorus in the grain removed from paddocks that has happened over the period 2005-2013 in SE Australia.
Figure 2. Winter crop soil phosphorus levels SE Australia 2005-2013. Text description follows image.
| % of Colwell P |
2005 | 2006 |
2007 |
2008 |
2009 |
2010 |
2011 |
2012 |
2013 |
|---|---|---|---|---|---|---|---|---|---|
| % greater than Colwell P |
52 | 38 | 60 | 58 | 34 |
50 |
47 |
58 |
66 |
| % 25-35 Colwell P |
20 | 31 | 22 | 16 | 26 | 31 | 22 | 18 | 16 |
| % less than 25 Colwell P |
26 | 30 | 26 | 26 | 40 | 18 | 30 | 24 | 16 |
A $/ha/P value should be allocated to those paddocks where critical Colwell P concentrations are at 90% maximum yield levels. At these levels a decision can be made to maintain those soil phosphorus levels and base this seasons P application rates on P grain removal from the previous season or in some instances a decision can be made to “mine” the phosphorus in high P paddocks.
A word of caution here, I would suggest a more detailed soil test should be taken to assess soil P levels in the 0-10cm and the 10-30cm soil profile. As a result of long term zero and/or minimum tillage practices where stratification of immobile nutrients such as phosphorus in the top 10cm may have occurred testing the 0-10cm profile may not be a true reflection of the overall nutrient status of the paddock.
There are recommendations to measure Colwell P in the topsoil as well as the 10-30cm to understand the quantity of plant available P in vertosols of the Northern Grains Region (McLaren et al. 2013).
Are soils in central and southern grain growing regions exhibiting signs of spatial variable distribution? In 2011 Mark Conyers sampled plot soil profiles at the Incitec Pivot Fertilisers long term trial site at Rand in the NSW Riverina that has a long history of minimum tillage with a lucerne ley phase included in the rotation.
This was undertaken as part of the investigation into why there were significant grain yield responses to phosphorus in wheat after canola where 0-10cm Colwell P tests were in the 55-85mg/kg Colwell P range.
Figure 3. Yield and protein results from Rand N x P trial in wheat (2010). Text description follows image.
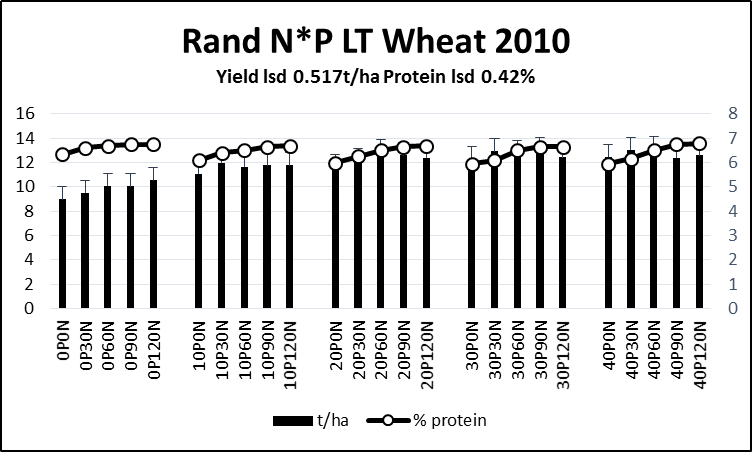
| N and P trial | tonnes/hectare | % protein |
|---|---|---|
| 0P0N | 10 | 12.75 |
| 0P30N | 10.5 | 13 |
| 0P60N | 11 | 13.5 |
| 0P90N | 11 | 13.75 |
| 0P120N | 11.5 | 13.75 |
| 10P0N | 12 | 12 |
| 10P30N | 13 | 12.5 |
| 10P60N | 12.5 | 13 |
| 10P90N | 13 | 13.5 |
| 10P120N | 13 | 13.75 |
| 20P0N | 12.75 | 12 |
| 20P30N | 13 | 12.5 |
| 20P60N | 14 | 13 |
| 20P90N | 13.75 | 13.5 |
| 20P120N | 13 | 13.5 |
| 30P0N | 13.5 | 12 |
| 30P30N | 14 | 12.5 |
| 30P60N | 13.75 | 13 |
| 30P90N | 14 | 13.5 |
| 30P120N | 13 | 13.5 |
| 40P0N | 13.5 | 12 |
| 40P30N | 14 | 12.5 |
| 40P60N | 14 | 13 |
| 40P90N | 13 | 13.5 |
| 40P120N | 13.75 | 13.5 |
Figure 4. Colwell P levels at varying depth of soil (Rand 2011). At this site at 15cm depth all Colwell P levels were less than 20mg/kg irrespective of the surface fertiliser application history.
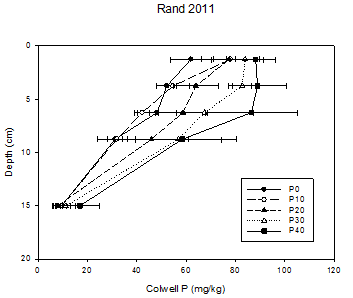
Figure 4 text description
This Rand 2011 study shows at 15cm depth all Colwell P levels were less than 20mg/kg irrespective of the surface fertiliser application history.
Management of P nutrition
It is important to have adequate phosphorus available to emerging wheat crops. Phosphorus deficiency limits wheat grain yield principally by depressing early growth, leaf emergence rate and maximum rate of tiller emergence (Rodriguez et al. 1999).
Current strategies for P management revolve around a mix of non-agronomic factors including fertiliser pricing, logistics, labour, product type, equipment capacity, planting equipment, fertiliser placement and agronomic factors such as crop potential, crop rotation, 0-10cm soil Colwell P values, fertiliser history, last season crop performance and soil moisture at planting. Apart from the western vertosols the majority of cropping soils in SE Australia receive some phosphorus at planting. The fertilisers applied are predominately mono-ammonium or di-ammonium phosphate granular fertilisers apart from phosphoric based liquid fertilisers on calcareous soils. The majority of phosphorus based fertilisers are placed with the seed at planting.
There were no significant grain yield differences where ammoniated phosphoric acid (Easy NP) and MAP at an equivalent rate of phosphorus were trialed on a red Sodosol at Curban in 2009.
Figure 5. Ammoniated phosphoric acid (Easy NP) and MAP at an equivalent rate of phosphorus on a red Sodosol at Curban in 2009
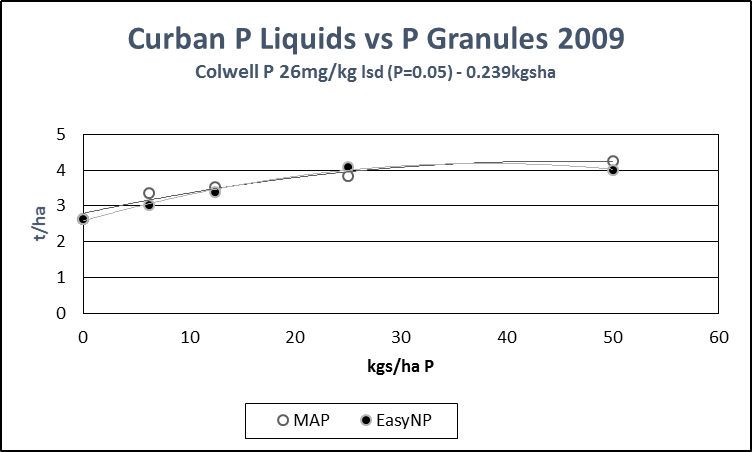
Figure 5 text description
Ammoniated phosphoric acid (Easy NP) ranges from 2.6 tonnes/hectare at 0 kgs/hectare P to 4 tonnes/hectare at 50 kgs/hectare P. MAP ranges from 2.6 tonnes/hectare at 0 kgs/hectare P to 4.3 tonnes/hectare at 50 kgs/hectare P.
Management of multiple nutrient decline
As nutrients are exported in grain, hay or stubble and lost to the atmosphere when stubble is burnt or as ash blows from the paddock soil nutrient levels will decline unless those nutrients are replaced.
Table 1 notes: Mn, Cu, Zn and B are measured in g/tonne (*). Sourced from grain nutrient analysis IPF long term trial site, Grenfell
|
Crop |
N% |
P% |
K% |
S% |
Ca% |
Mg% |
Mn* |
Cu* |
Zn* |
B* |
|---|---|---|---|---|---|---|---|---|---|---|
|
Wheat |
2.4 |
.24 |
.3 |
.14 |
.03 |
.09 |
46 |
3 |
17 |
2.6 |
|
4t/ha/grain |
96kgs/ha |
9.5kgs |
12kgs |
5.5kgs |
1.2kgs |
3.5kgs |
184g |
12g |
68g |
10g |
|
Canola |
3.9 |
.84 |
.94 |
.52 |
.41 |
.32 |
37 |
4 |
27 |
14 |
|
2t/ha/grain |
78kgs |
16.8kgs |
19kgs |
10.4kgs |
8.2kgs |
6.4kgs |
74g |
8g |
54g |
28g |
Table 2 notes: Mn, Cu, Zn and B are measured in g/tonne (*).
|
Crop |
N% |
P% |
K% |
S% |
Mg% |
Mn* |
Cu* |
Zn* |
B* |
|---|---|---|---|---|---|---|---|---|---|
|
Wheat Stubble |
0.2 |
0.03 |
1.2 |
0.044 |
.08 |
62 |
1 |
1.5 |
3.9 |
|
6t/ha |
12kg |
1.8kg |
72kg |
2.4kg |
4.8kg |
372g |
6g |
9g |
23g |
|
Frosted Stubble |
0.78 |
.05 |
2.1 |
.19 |
.09 |
41 |
1.9 |
9.2 |
3.9 |
|
6t/ha |
47kg |
3kg |
126kg |
11kg |
5.4kg |
246g |
11g |
55g |
23 |
Most advisers and grain growers are aware of the implications of declining nitrogen and phosphorus soil levels. Potassium has the potential to go unnoticed, apart from on some high crop removal vertosols and lighter granite cropping soils on the Tablelands soil potassium levels in NSW are well above critical concentrations required to maximise yield. Greg Brooke (per. com. 2014) has an interesting result with an apparent potassium response at one of his 2013 nutrient exclusion trial program sites.
If nutrient stratification is identified as an issue either spatially or vertically don’t discount a well-timed tillage operation to redistribute nutrient through the seed zone.
Options for placement
Banding phosphorus with the seed is still the preferred option for the majority of grain growers in NSW and will continue to be as research continues into placement and product strategies that are cost effective.
One of the first steps in improving farming systems phosphorus use efficiency was banding with the seed instead of broadcasting pre plant. The next step may be strategic banding of fertilisers at depth as part of an overall tillage strategy where there is potential for an economic response. Northern grain growers are seeing an opportunity to incorporate phosphorus into the pre plant nitrogen strategy as an MAP/urea blend to reduce passes across the paddock.
The complexity of plant responses to subsoil nutrition may suggest that before adopting deep fertiliser practice in a paddock it is essential to understand the effects of edaphic and climatic conditions, soil management, and plant–soil interactions in order to achieve maximum yield benefit (Qifu et.al. 2009)
Another strategy may revolve around the application of “starter” rates of phosphorus fertiliser banded with the seed and then the application of foliar phosphorus in seasons of adequate yield potential or when the topsoil is dry or P is stratified (McBeath & Degryse 2012). Issues with poor leaf uptake of foliar P (3-7% of total plant P uptake) (McBeath 2013) also presents some difficulties in the paddock.
After two years of Incitec Pivot Fertilisers field trials at 30 sites from northern NSW to South Australia assessing the economics of foliar phosphorus application we have only seen one significant yield grain yield response to the application of foliar phosphorus.
The current additional cost of foliar P products over seed placed granular products increases the risk associated with this strategy. The foliar products are high cost and won’t correct a phosphorus deficiency, if inadequate phosphorus is applied at planting there is potential for reduced grain yield. New research around improved adjuvants and foliar formulations may improve the reliability of this approach.
Value of phosphorus
After deciding on the appropriate phosphorus based product the value per kg of phosphorus should also be considered. For a “straight” phosphorus based product such as triple super, it’s $ per tonne of product/Phosphorus content % w/w of the product, for triple it would be 207kgs of P per tonne that would then give price per $/kg/P
($ per tonne landed on farm/207kgs of P) x 10 = $/kg/P
But what about a high analysis product that contains other nutrients such as di-ammonium phosphate?
For a tonne of DAP which contains 200kgs/phosphorus and 180kgs of nitrogen (and a small amount of sulphur) value the nitrogen contained in a tonne of DAP (180kgs) against a “straight” nitrogen source e.g. urea at 46%N w/w
($/tonne urea on farm/460kgs of N) x 10 = $/kg/N
and then deduct the $N value/tonne from the DAP price and then calculate the $/kg/P
{(DAP $/tonne - $N value/tonne)/200kgs of P} x 10 = $/kg/P
The lowest cost per tonne ex. port is not necessarily the best approach to product selection. Depending on freight, location, nutrient requirements and application technique the additional N and the $/N benefit in high analysis fertilisers such as DAP, MAP and Granulock Z® are more cost effective when supplying phosphorus. The same process should be used when assessing $/nutrient in liquid fertilisers.
Factors influencing variability of response
(Qifu M, Zed Rengel, and Terry Rose. 2009) suggested in water-limited environments where the topsoil is prone to drying, soil nutrient stratification may influence nutrient availability and plant uptake because of impeded root growth or reduced diffusion of immobile nutrients to the root surface, or more likely a combination of both factors. Placing fertilisers deeper in the soil profile could increase nutrient acquisition and utilisation by plants as fertiliser nutrients are in the moist soil for a longer part of the growing season. However, the effectiveness of deep placement of fertilisers may also be determined by soil texture, tillage, fertilising history, nutrient mobility, and crop species.
This contrasts with the responses of winter and summer crops in northern Australia on soils with optimum-to-high nutrients but subjected to rapid and frequent drying of topsoil because of high temperatures and high evaporation demand during the growing season. The pattern of nutrient accumulation by crop species (indeterminate v. determinate) and the mobility of mineral nutrients in the phloem would also modify the effectiveness of deep-placed nutrients under drought.
References
McLaughlin M.J.& Therese M. McBeath &T.M & Smernik R. & Stacey S.P. & Ajiboye B. & Guppy C. (2011) The chemical nature of P accumulation in agricultural soils—implications for fertiliser management and design: an Australian perspective. Plant Soil (2011) 349:69–87
Qifu M, Zed Rengel, and Terry Rose. (2009) The effectiveness of deep placement of fertilisers is determined by crop species and edaphic conditions in Mediterranean-type environments: a review. Australian Journal of Soil Research, 2009, 47, 19–32
T. I. McLaren, M. J. Bell, I. J. Rochester, C. N. Guppy, M. K. Tighe, and R. J. Flavel (2013) Growth and phosphorus uptake of faba bean and cotton are related to Colwell-P concentrations in the subsoil of Vertosols. Crop & Pasture Science, 2013, 64, 825–833
A. M. Alston. Response of Wheat to Deep Placement of Nitrogen and Phosphorus Fertilizers on a Soil High in Phosphorus in the Surface Layer. Aust. J. Ag. Res., 1980, 31, 13-24
Rodriguez D, Andrade FH, Goudriaan J, (1999) Effects of phosphorus nutrition on tiller emergence in wheat. Plant and Soil 209, 283-295.
McBeath & Degryse (2012) Soil phosphorus chemistry and implications for fertiliser design. Phosphorus Workshop Adelaide 2012
Courtney Peirce, Mike McLaughlin, Therese McBeath and Victoria Fernandez (2013)
Foliar Fertilisation of Wheat Plants with Phosphorus. Phosphorus Workshop Adelaide 2013
Contact details
Jim LaycockIncitec Pivot Fertilisers
Ph: 0427 006 047
Email: jim.laycock@incitecpivot.com.au
Was this page helpful?
YOUR FEEDBACK