Effective farming systems - what skills and approaches lead to successful farming systems?
Author: Basil M. Doonan | Date: 12 Mar 2014
Basil M. Doonan,
Macquarie Franklin
Take Home Messages:
- The evolution of a farming system should be a function of logical business decision making since the majority of farmers will list profit as a key motivator. Many farm business managers adopt an oversimplified approach to this, farming the way they want to farm, chasing silver bullets or blindly following the benchmarking results of the best farmers. This is totally misleading and often results in the evolution of farming systems that are inappropriate for the manager’s resource base.
- For the large majority of farm businesses, profitability is driven to the greatest extent by the successful implementation and management of the basics and then incorporating new or emerging technologies at the margins. The environment that farms operate in is dynamic which means that any decision needs to take into account how it will interact with the entire system.
- Farm managers have been shown to consistently and repeatedly get this process wrong, particularly in times of higher prices when they tend to farm how they would like rather than how they should. This leaves these businesses particularly exposed when prices fall, there are seasonal challenges, or costs rise sharply. The primary focus on systems selection should be to marry it with the farm businesses’ resource base in order to optimise profit. Farming lifestyle can only be sustainably maintained after profit is achieved.
- Adopting a whole of business or “systems” approach to the decision making process is one way of achieving consistently high profitability as the farming system evolves. Even the simplest decisions are set in a complex and leaky environment and can have significant impacts at the business level.
Introduction
Most farmers are committed at some level to profitable farming and as a result the major challenge for consultants is not to convince farmers that it is important, but rather to convince them that “they” (as managers), are almost solely responsible for the profit derived from their decisions and subsequent actions. While the system that evolves is important, it can never be solely responsible for a profitable outcome.
To result in improved profit, decisions should be based on the principle that profit will be maximised when we are operating at the point where the marginal cost (MC) of producing the last unit of product is equal to the marginal revenue (MR) received from producing it. This relationship is described in Figure 1, with Q representing the profit maximising position and ATC being the average total costs.
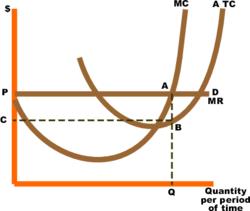
Figure 1. Profit maximisation
This relationship is the reason that as the product price increases we should expect to see an increase in the cost of production of the business. Analysis of benchmarking data clearly shows that as prices fluctuate so too does the cost of production. This is illustrated in Figure 2, and taken on face value might suggest that farmers are reacting logically to increases or decreases in product prices (milk price in this example). However this is usually not the case.
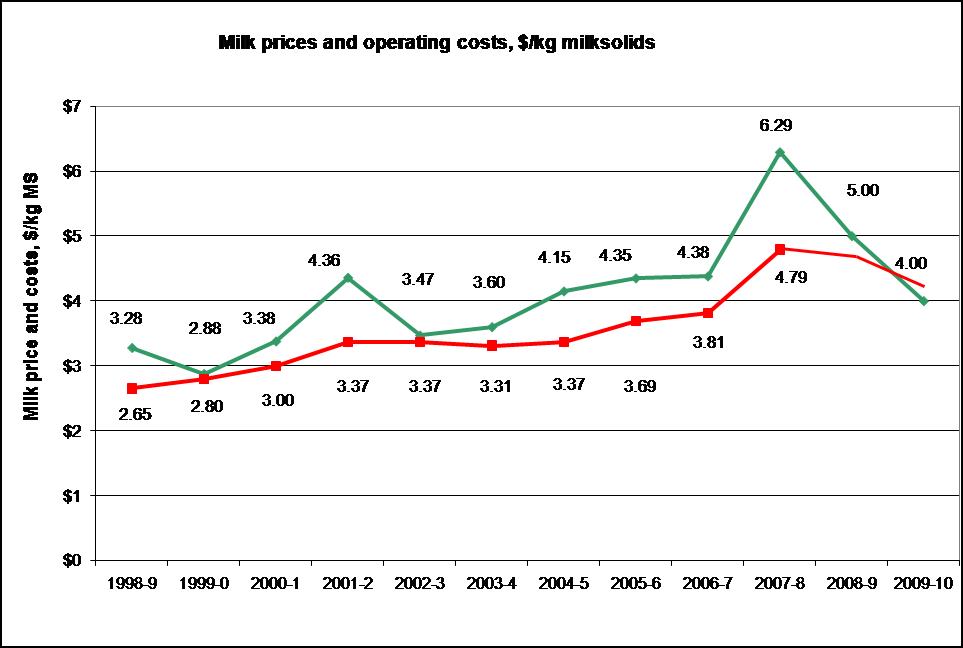
Figure 2. Relationship between milk price and cost of production of milk solids
The evolution of farming systems
Farming systems can evolve in a lot of different ways, however broadly speaking they evolve from:
- Innovations on farm that are ratified by research.
- Research that is validated on-farm.
- Farming systems research that focuses on bringing a number of technologies or enterprises together to improve profit or lower risk.
Farming systems or techniques and technologies that form the basis of profitable farming systems are most commonly promoted by comparisons between the top 10% (or some other above average percentile) and the average of the industry. This information can be compelling at first glance.
Comparing what the best farmers are doing as opposed to the average and using this as a way of benchmarking our way forward and as the basis of system development, while useful, is unfortunately misleading. There is no direct link between what the top 10% do and profit. If we do not understand ‘how’ they are doing it we will not get a profitable system.
If we take the trends in Table 1 we might conclude under this flawed methodology that simply:
- Milking more cows;
- producing more milk solids per cow;
- producing more milk solids per hectare;
- purchasing a greater proportion of the cows diet; and
- having more irrigation
will lead to increased profit. Table 1 illustrates clearly that a general progression towards the characteristics of farming systems of the better producers will not result in increased profit.
Table 1. Comparison of the top 10% farmers to the average
Top 10% |
Average |
|
|---|---|---|
|
Herd size |
409 |
310 |
|
Production/cow (kg MS/cow) |
315 |
257 |
|
Production/ha |
883 |
593 |
|
Purchased feed (% diet) |
24 |
17 |
|
Irrigated area (ha) |
30 |
25 |
|
Stocking rate |
2.8 |
2.3 |
|
Pasture utilisation (t/ha) |
10.5 |
7.8 |
|
Return on Capital (%) |
9.5 |
2.4 |
Table 2 illustrates that the farming trends promoted by benchmarking the best against the average have been taken up by the industry over a significant period of time. At the same time profit is not increasing. Why is this the case? Clearly, if the best producers are successfully implementing these innovative technologies and achieving high returns then this ought to be the way to increase systems profit!
Table 2. Trends in Australian dairy farming systems
|
1995 |
2005 |
|
|---|---|---|
|
Herd size |
113 |
270 |
|
Production/cow (kg MS/cow) |
280 |
330 |
|
Production/ha |
392 |
495 |
|
Purchased feed (% diet) |
10 |
38 |
|
Irrigated area (ha) |
20 |
45 |
|
Stocking rate |
1.4 |
1.5 |
|
Pasture utilisation (t/ha) |
7.8 |
7.6 |
|
Return on Capital (%) |
2.4 |
2.4 |
The last decade in farming has seen two other less obvious things occurring, these being; increasing diversity in the resource base of individual farms; and secondly an increasing divergence in farmer skill base. Since these traits are far less obvious than the technologies and trends within an industry, they are given far less attention when the usual profit drivers are analysed.
Detailed analysis of these farming characteristics within Tasmania’s dairy industry has shed light on why the profitability of individual farms varies so dramatically despite similar farming systems. The benchmarking data, when paired with skills auditing information reveals an entirely different story and would suggest the following:
- Firstly that most farmers lack the skills and knowledge to make profitable decisions and hence develop and drive profitable farming systems.
- That given an increase in product price (or an improved technology) farmers will tend to farm the way they want rather than move towards profit maximisation.
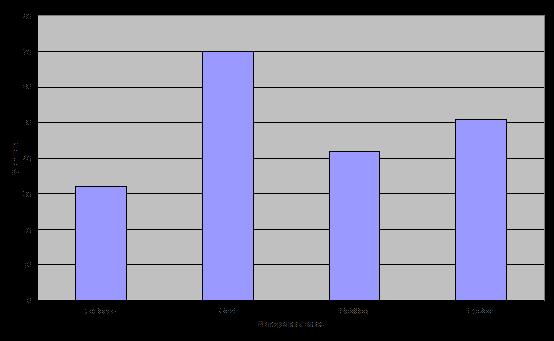
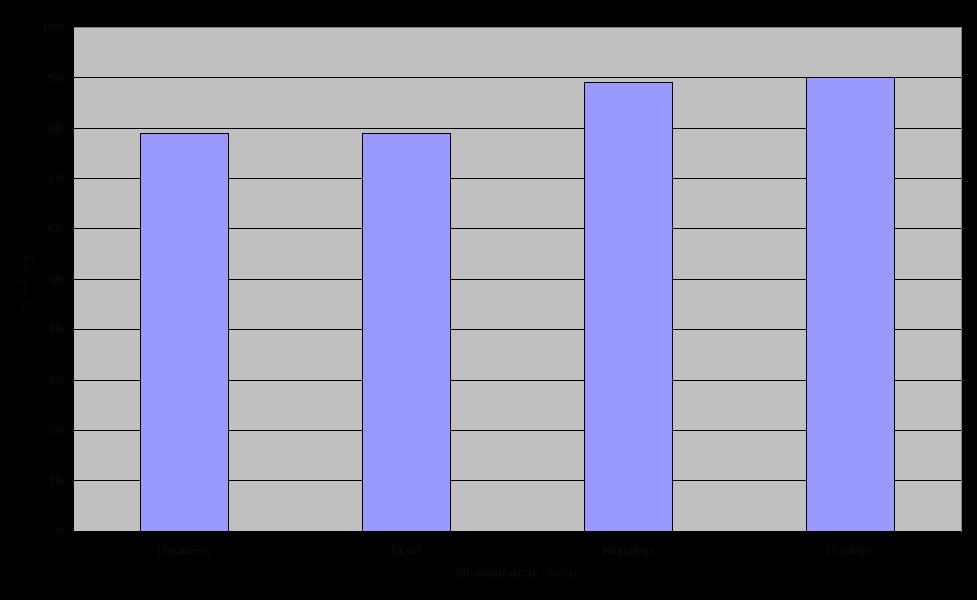
The first point is illustrated below in Figure 3. The management of pasture is the key driver of profit in the grazing industry. Similarly in the grains industry, it is sound agronomic decisions concerning crop production. Yet on average most farmers have only a modest understanding of the principles associated with pasture or crop production. In the example below they possess less than 50% of the skills required.
(Source: DPIWE, 2004)
Figure 3. Average skill level of Tasmanian farmers
Based on the extent that pasture or agronomic decisions drive profit and the fact that a return on capital year-in year-out of about 8% is required to cover interest on borrowed capital, in the order of 70% of managers do not have the necessary understanding of their business and its operational requirements to make profitable decisions.
Figure 4 clearly illustrates that improving the utilisation of the resource base (i.e. increasing pasture utilisation or crop yields), increases profit (up to a point that most farmers are yet to achieve). It stands to reason then that those farmers with higher levels of skill in the area of pasture management and agronomy will be more profitable.
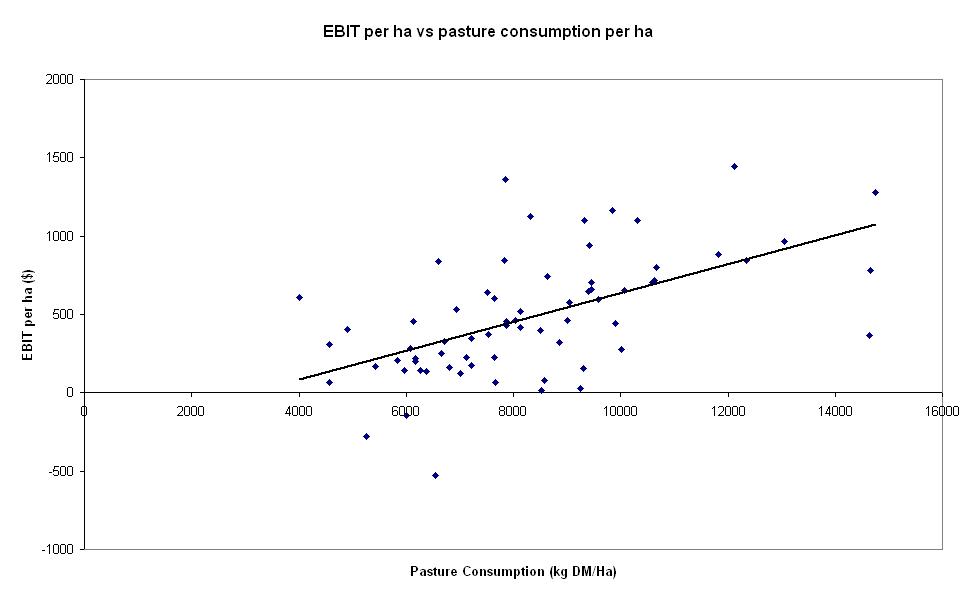
(Source: DPIWE, 2008)
If we look at the skill level of the top 10% of farmers (based on return on capital) we find that their skill profile is very different to that of the average farmer (Figure 5). In fact it is this higher level of skill that ultimately drives profit. Skills in the area of business management are a key determinant of running the right system. Operational skills then make sure that the right system (for the resources available) is highly profitable.
(Source: DPIWE, 2004)
Figure 5. Skill level of the top 10% of Tasmanian farmers
The second issue associated with business decision making and systems evolution is that farmers will tend to farm ‘how they like to’ rather than ‘how they should’ as price increases or new more profitable enterprises or technologies become available. Farmers have certain beliefs that are not always grounded in fact. As an example ‘as price increases I’ll put more fertiliser on to grow more crop’. This is very much an oversimplification of the marginal cost: marginal revenue (MC: MR) relationship.
The best illustration of the lack of understanding of the MC:MR relationship or the propensity for farmers to farm ‘how they like to’ rather than ‘farming for profit’ is a simple analysis of how the best dairy farmers and the average group of dairy farmers reacted to the increased (record high) milk price in the 2007-08 season. This relationship, along with some of the key drivers is described in Table 3 below.
Table 3. How two categories of farmers react to changes to the milk price?
|
2006-07 |
2007-08 |
|||
|---|---|---|---|---|
|
Average* |
Top 10% |
Average* |
Top 10% |
|
|
Milk price |
4.39 |
4.39 |
6.33 |
6.33 |
|
Increase in farm value |
15% |
35% |
||
|
ROC |
5% |
12% |
8% |
16% |
|
MS |
151,000 |
165,000 |
172,000 (10%) |
204,000 (24%) |
|
N/ha |
144 |
192 |
212 (47%) |
232 (21%) |
|
Grain |
800 |
1100 |
1150 (44%) |
1200 (9%) |
|
Pasture harvested |
9,210 |
11,290 |
9,320 (1%) |
12,350 (10%) |
* Excludes the top 10%
() is the percentage increase from 2007 to 2008
In response to the increase in milk price the best farmers spent more on inputs but used these inputs to increase overall profit. The average farmers spent much more (as a percentage) on inputs without an accompanying increase in production to offset these costs.
In fact 70% of the farmers in the average group would have been better off doing the same production as the previous season and not increasing costs. All of the additional money spent on feeding cows actually cost them money. Another way to think of this is that while turnover increased only people external to the business benefitted from this.
In contrast, the additional costs in feeding cows on the best farms resulted in an improved profit position for all farmers, above doing the same thing as the previous season. The result of this comparison is that the bottom 90% of farmers on average is not capable of making profitable feeding or business decisions. The top farmers continue to make profitable feeding decisions despite seasonal, price and cost variations.
If farmers really want to improve profit from their decisions they need to:
- Increase their skills in the area of operational activity (agronomic and feed management).
- Increase their understanding of enterprise relationships and interactions.
- Have an intimate knowledge of their farming system and how it responds as a whole to operational decisions.
The sporting comparison
Like or hate Australia on the sporting field, one thing that is generally agreed is that as a nation we are very competitive. In fact, given the population of the country, it could be easily said that we are second to none in this area. The reason is not that Australia is blessed with an overabundance of natural talent, but rather that a professional approach to sport has been adopted.
As the transition from amateur to professional sport has taken place, Australia has been a leader in the area of investing heavily in its athletes. Indeed the 2012 Olympics are a good example (Table 4). Australia was fourth on the list of medals yet had by far the smallest population of the top 5 nations.
Table 4. Analysis of countries at the 2012 Olympics based on gold medal performances and population
Country |
Gold medals |
Population (million) |
Medals/million people |
|---|---|---|---|
|
USA |
46 |
275 |
0.13 |
|
China |
38 |
1261 |
0.03 |
|
Russia |
24 |
146 |
0.16 |
|
Australia |
7 |
20 |
0.35 |
|
Japan |
7 |
126 |
0.05 |
|
New Zealand |
6 |
4 |
0.15 |
|
South Africa |
3 |
45 |
0.07 |
Within sporting competition it is very hard to hide behind a range of diverse goals and objectives, which is often the case in farming. The rules are firm and enforceable in order to determine a winner. However, winning in business requires most of the same attributes as competitive sport; ability, dedication and determination. These are certainly the attributes of winning farmers, perhaps even more so than in sport because natural ability will only take you a fraction of the way in business, but may well take you a great distance in sport.
In 1981 Australia established the Australian Institute of Sport, and this, not surprisingly coincided with a dramatic improvement in our sporting performance. Since then several more have been established at a State level and even by individual sports. Shortly after this, Australia had some 63 individual world champions.
Australia aside – the best of the best in any sporting endeavour exhibit these key success traits and it is from these that we can learn. The tools or technologies of the sport take on a much lower level of importance than they do in other areas of business. We have been conditioned to accept that research and the associated technologies will save us. Whereas in sport it is recognised that the individual is the key to success and that fancy swimsuits, bats or boots are a distant second.
The concept of risk
Analysis of risk is often overcomplicated. There is little doubt that farming is a risky business and the management of a farming system is generally more complicated and complex than the management of other small businesses. This is simply because farm managers have to deal with the weather, soils, machinery, animals, plants and people. However this does not mean that analysis or the robustness of systems need be complex.
When we think about it, any shock to the system, whether it is an increase in input costs, an increase in interest rates, seasonal variation or a drop in product prices, will essentially have the same impact on the business as a drop in product prices. When comparing one system to the next simply dropping the product prices received by 10-20% with give a clear indication of one systems robustness versus another.
Once you have settled on a robust system it is then possible to analyse its vulnerability to individual shocks by varying key parameters such as the major input costs, interest rates and of course product prices.
Summary
Farming systems in agriculture will continue to evolve by capitalising on new technologies and techniques that emerge from research. The key driver of the adoption and adaptation of these in the evolution of new and more profitable farming systems is likely to be improved profit. However the inspiration is likely to be associated with the performance of these on the farms of the better producers.
The extent to which these new farming systems are able to achieve higher levels of profit is very likely to be a function of the manager’s skills.
References
DPIWE (2004), Skills audit of Tasmanian farm farmers, TOP project
DPIWE (2008), Dairy Business of the Year Benchmarking program
Contact details
Basil Doonan
Macquarie Franklin
112 Wright Street Devonport
Was this page helpful?
YOUR FEEDBACK