Sorghum yield risk vs starting soil moisture
Author: Jeremy Whish, CSIRO / APSRU / APSIM initiative | Date: 25 Jul 2014
Take home message
- Identify the target yield required to be profitable before planting
- Do a simple calculation to see how much water you need to achieve this yield
- Know how much soil water you have (treat this water like money in the bank)
- Think about how much risk your farm can take
- Consider how this crop fits into your cropping plan, will the longer-term benefits to the system outweigh any short-term losses.
- Avoiding a failed crop saves money now and saves stored water for future crops
- Not planting is sometimes the best decision.
Introduction
Risk is personal. Some people are more risk adverse than others and many factors influence how much risk an individual farm business can withstand. In this paper I will attempt to identify some tools and approaches that can inform and aid the planting decision process and identify how much risk is associated with different decisions. My aim is not to provide a recipe for planting summer crops in north-western NSW, but to provide some insight and tools to assist in the decision making process.
Why plant a summer crop?
The highly variable nature of dryland farming in the western margins of the northern grain region can often be the very reason people are looking to plant a summer crop. If the previous season was dry and winter crops were not sown, a summer crop is likely to be the best way to generate cash flow. Alternatively, the summer crop may be part of a paddock management plan, a “break crop” designed to rejuvenate the paddock and improve subsequent winter crop yields by reducing weeds and disease, and using the long fallow to refill the soil water profile. Finally it may be part of the farm plan, a phase in the cropping sequence where herbicides are rotated to reduce the chance of herbicide resistance, pest populations are reduced by growing non host crops, and farm operations and cash flow better managed by distributing work and returns between seasons. Whatever the reason, the important points to consider are: what benefits will my system get by including a summer crop; what crop do I intend to plant after the summer crop – will this influence the herbicides I use and what can I do to ensure my crop has the best chance to be profitable?
Once the decision on crop type is decided it’s time to think yield.
What is my yield target?
Targeting yield is an important consideration when producing crops in a variable climate. Having a target to aim for improves the decision making process, allowing the risk associated with planting under current conditions to be compared against future planting opportunities when conditions may be less risky. One approach is to look at the cost of planting a crop, how much it has already cost to keep the paddock fallow, and what yield is expected. I will give a brief example of how to do this and then concentrate on methods to estimate the final yield.
Question.
Do we plant sorghum on the 15- October or wait?
Background
The soil is a Grey Vertosol in the Burren Junction district which has a maximum water storage capacity of 232mm for sorghum. The paddock has been fallowed from wheat in 2013 and has good stubble cover, based on the online tool Australian CliMate the plant available soil water estimate is 90 mm.
Price
Sorghum price $130/t
Costs
Fallow cost 5 sprays at $15/ha $75/ha
Sowing costs $50/ha
In-crop chemical weeds/bugs $70/ha
Harvesting $45/ha
Fertiliser $90/ha
Total $330/ha
Many people don’t fertilise summer crops so this total can be reduced by $90, but it must be remembered that an under-fertilised crop has a reduced yield potential, effectively capping returns. This decision is up to the individual, but for this exercise fertiliser will be applied.
With a sorghum price of $130 and an aim to return costs + 20% ($400/ha) our target yield would be 3 tonnes.
While it is easy to talk about achieving a particular target yield, it is generally not that simple in practice. So what tools and information are at our disposal to make this a reality?
How much water?
For a growing crop there are two sources of water; firstly the water stored in the soil during the fallow, and secondly the water that falls as rain while the crop is growing. You have some control over the stored soil water; you can measure how much you have before you plant the crop. However, rainfall is out of your control. Long-range forecasts and tools such as the SOI can indicate the likelihood of the season being wet or dry, but they cannot guarantee rain will fall when you need it.
Looking at the long-term climate records offers some insight.
Assuming that we plant on the 15th of October, the long term record (from the past 113 years) shows that the average amount of rain that will fall over the following 120 days is 221mm, however the seasonal rainfall range for this period is between 30mm and 556 mm. Coefficient of variation (CV) is a statistical measure that describes how variable the data is, the larger the fraction the more variable, this period is quite variable (Figure 1) with 0.53 variation about the mean.
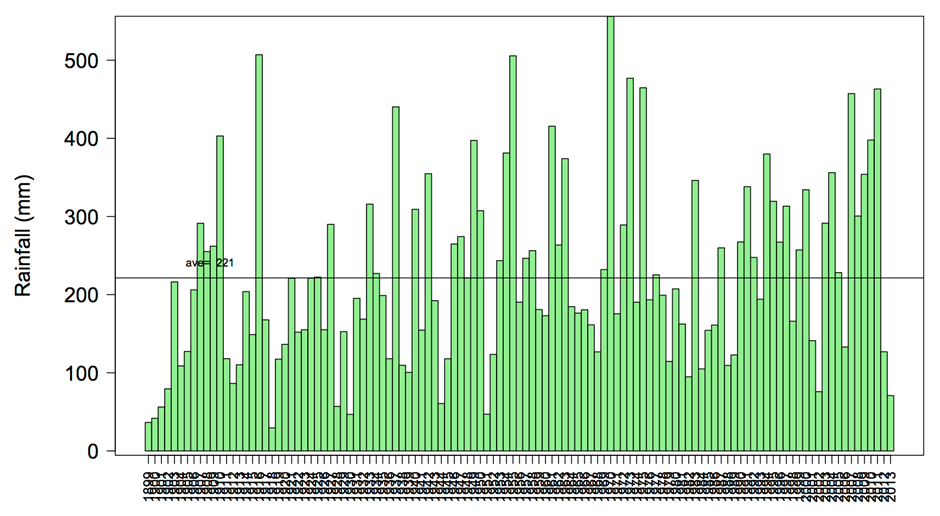
Figure 1. Long-term rainfall record for Burren Junction between the 15th of October and the 15th of February between 1900 and 2013.
A different way to look at this is via an exceedence plot (Figure 2), presents the probability of exceeding a particular amount of rainfall within a particular time frame. If we look at the y axis and select 0.8 (80% or 4 in 5 years) and trace this across to the line and then down to the x axis it indicates that there is an 80% chance of getting more than 118mm of rainfall across the growing season. It should be noted however, that this also indicates that there is a 20% chance (1 in 5 years) of receiving less than 118 mm.
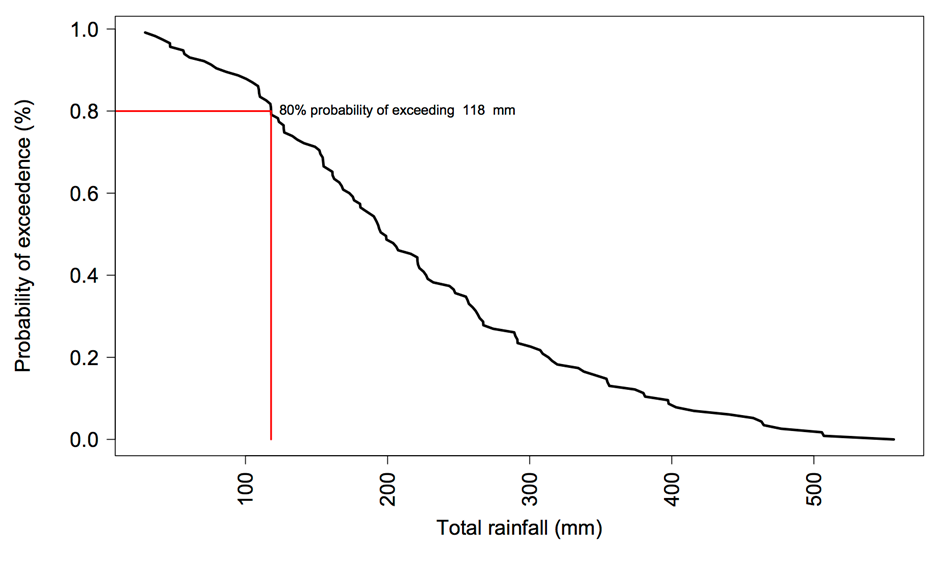
Figure 2. Probability of exceedence. Red lines show an 80% probability of exceeding 118 mm of in-crop rainfall if planting occurs on the 15th of October.
The later the crop is sown the greater the chance to accumulate in-crop rainfall and the less risky the planting decision. Table 1 shows that when planting between October and the 1st of January, there is an 80% chance of receiving at least 107-126 mm of in-crop rainfall, however, this calculation does not consider the impact of rainfall timing on crop demand. However planting later does reduce options for double cropping.
Table 1. In-Crop rainfall from different sowing dates assuming a 120 day crop.
|
Sowing date |
mean in-crop rainfall (mm) |
Rainfall range Min-Max (mm) |
Coefficient of Variation (%) |
80% probability of exceeding (mm) |
|
15-Sep |
188 |
14.7 - 544 |
50 |
107 |
|
15-Oct |
221 |
30 - 556 |
53 |
118 |
|
15-Nov |
224 |
29 - 493 |
49 |
125 |
|
15-Dec |
211 |
13.8 – 509.7 |
49 |
126 |
|
01-Jan |
186 |
7 - 515 |
50 |
111 |
Converting water into grain
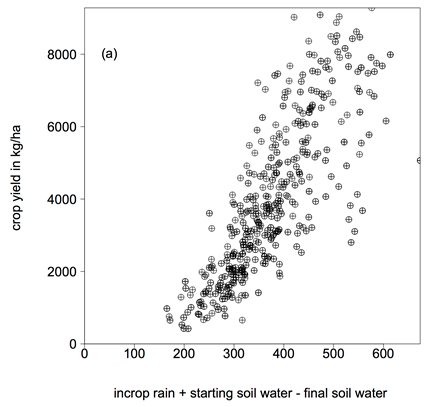
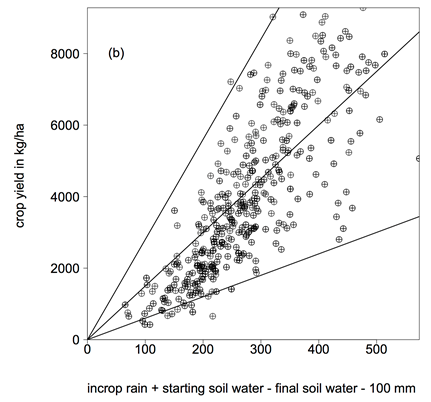
Figure 3. (a) The relationship of yield to available water and (b) the relationship of yield to available water with 100 mm of water removed to account for initial growth and losses due to evaporation, runoff and drainage. The WUE lines on figure b, from left to right are 28, 15 and 6 kg/mm/ha
Calculating a crop water use efficiency.
Crop factors indicate how a plant converts water into grain, The figure3a shows the relationship between the amount of water used by the plant and the final grain yield. The amount of water used by the plant is calculated as:
Plant available water + in crop rainfall (mm) = water available for plant growth
Plant available water = soil water at sowing (mm) - soil water at harvest (mm)
You can see that the data in figure 3a begins around the 100 mm point. Suggesting that a 100 mm is required to grow a plant to the point that it produces yield and to account for losses from the system in the form of evaporation drainage and runoff.
So the amount of water used by the crop is:
(Soil water at sowing (mm) + in crop rainfall (mm) - soil water at harvest (mm)) – 100mm = water available for plant growth (mm)
I have used 100 mm as an average loss figure for a summer crop in this region. It will vary depending on soil type, and district but as a rule of thumb in this area 100mm should work well.
The 100 mm has been removed in Figure 3b and the data has been corralled within water use efficiency lines. There are many factors that influence the growth and development of crops and this approach does not attempt to capture these so for this region WUE lies between 6mm/kg/ha and 28mm/kg/ha depending on the season around 15mm/kg/ha is worth using as an average.
The variation within this envelope is because the total amount of water is not all that determines yield, the timing and supply of water during different stages of crop growth also influences the efficiency of the plant and final yield.
Converting water into grain
To convert water into grain we need to:
calculate the total amount of water available to the plant and multiply by the crop factor
(Plant available soil water + incrop rainfall -100mm) x 15
To work backward from our target yield of 3000 kg/ha
(3000/15)+100 = 300 mm of water made up of rainfall and soil water
if we have an 80% chance of getting at least 118 mm of rainfall then a starting soil water of 182 mm is required
Water stored during the fallow as stored water is of higher value than rainfall, because it is available when the plant needs it, provided that reserves are sufficient. In terms of risk management, the greatest value of stored water is in knowing the quantity available for crop production, before the crop is planted, when decisions are being made. It is also why managing fallow stubble cover and weeds is so important.
This calculation is fairly rough assuming that the efficiency of production is at 15kg/mm/ha whereas it may actually be a lot lower (or higher) depending on seasonal rainfall distribution and crop stage. An alternative approach, which does take into consideration the vagaries of seasonal rainfall distribution and amount, temperature, radiation and soil condition, is to use simulation modelling tools like APSIM, or its derivatives Yield Prophet™ or Whopper Cropper. These tools all use probability to describe the riskiness of particular actions like planting on a particular date or sowing on a particular soil water content. Figure 4 shows an APSIM output prepared for Burren junction looking at an October planting.
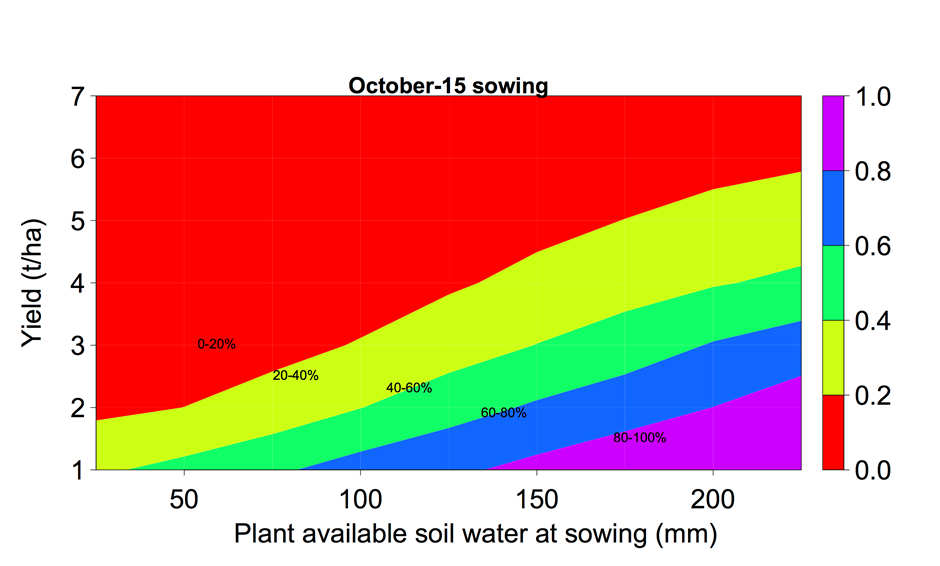
Figure 4. Rainbow chart showing the probability (colours) of exceeding a particular yield (y axis) based on starting soil water conditions (x axis)
Figure 4 supports the back of the envelope calculation suggesting the 180mm of starting water is the minimum required to achieve a 3t yield 6 to 8 years in 10.
To sow or not?
Is it worth waiting to get more soil water? Within the Burren Junction region there is very little difference in yield between crops planted in September and December. So how much water would you expect to accumulate within the soil by waiting to plant in December compared to October.
Looking at rainfall the average amount to fall in this period is 105 mm, but you have an 80% probability of getting at least 45mm (Figure 5).
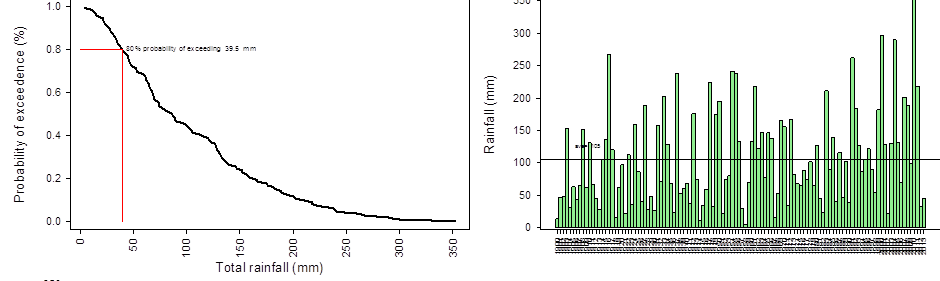
Figure 5. Probability of exceedence and rainfall distribution between October 15 and December 15 from Burren Junction between 1900 and 2013.
Using APSIM’s soil water balance that considers runoff and drainage and assuming the soil profile held 100 mm on the 15th of October, There is an 80% probability of accumulating 110 by the 15th of December. However, simulations over the last hundred years show that by waiting until December if there is only 100mm of soil water in October will increase the yield on average by 712 kg/ha. The two month delay will increase the input costs by 1 or 2 herbicide sprays, but will also provide a better opportunity to control weeds.
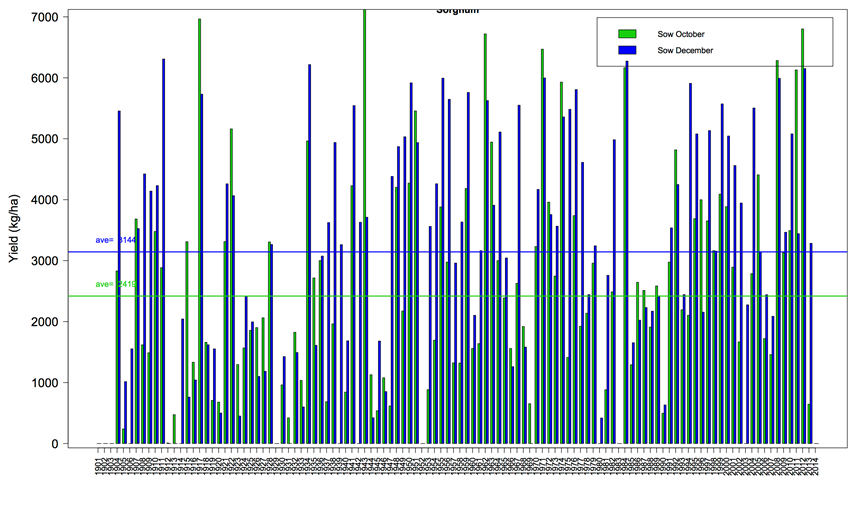
Figure 6. Yield difference between planting on 100 mm of stored soil water in October and accumulating more water for 2 months and planting in December. The average difference is 725 kg
This year
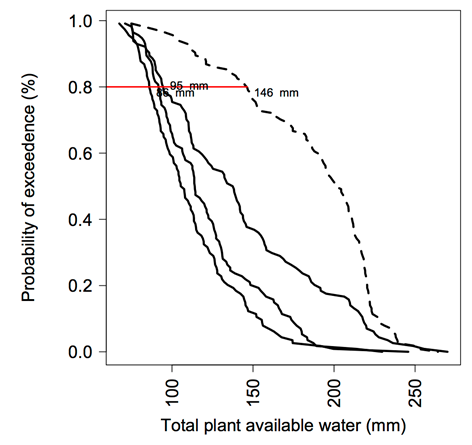
Figure 7. Probability of accumulating water assuming 100mm plant available water starting value on the 1 of July
Thinking about this current year and assuming there is 100mm of water stored in the soil as of the 1 July then using historic data there is an 80% chance of having 86 mm in September and 95 mm in December. If a summer crop is missed there is an 80% chance of having 146mm and a 60% chance of having 200 mm in May.
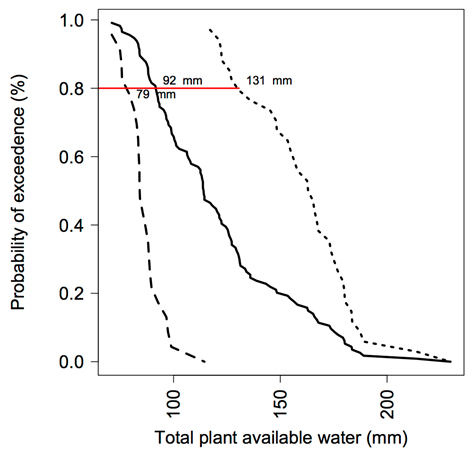
Figure 8. Probability of accumulating water assuming 100mm plant available water on the 1 of July, historic predictions show the amount of water accumulated by October for all years (solid line), the wettest 20% of years (dotted line) and the driest 20% of years (dashed line) .
If we consider the type of year we are having and look at the historic probabilities the solid line includes all years while the dashed line indicates those years that fall in the driest 20% and the doted line is the wettest 20% of years. Current forecasts are anticipating this year to be dry.
Other tools
I have been conservative using 80% as my level of risk. However, a positive long range forecast, combined with a promising SOI signal, could be used to assess the scenario and accept a lower probability level to take a calculated increase in risk and sow on less soil water.
Alternatively, different sowing strategies could be used to reduce the risk of a failed crop. Skip row planting maintains a high plant density within the crop row, forcing the plants to experience early competition that limits tillering. As the plants approach grain fill the limited number of tillers are filled from the spared water in the skip, ensuring the crop is finished. The advantage of skip row is that it helps ensure a yield and prevents crop failure. However, the downside is that yield is capped due to the lack of tillers, so the crop cannot take full advantage of good rain and will yield less than a solid crop configuration when not under stress.
If the outlook is poor, reducing the area planted is also a way of hedging your bets and reducing the risk and expense of a failed crop. However, growing a non-profitable crop as part of a rotation can be tolerated, provided the benefits that crop provides to the over-all farm system is justified. Reducing weeds, managing herbicide resistance, and reducing disease inoculum are benefits of crop rotation that are not easily measured and not considered when using simple water use efficiency calculations or crop model simulations.
Conclusion
Deciding to plant or not is difficult, experience and gut feel are valuable components of this decision, however, by following some of the approaches presented here the decision can be made more transparent and justifiable. By thinking about the consequences of the planting decision on future crops, and how this crop fits into the overall whole farm system, the best decision will be made.
Contact details
Jeremy Whish
CSIRO Agriculture Flagship
Ph: 07 46881419
Fx: 07 4688 1193
Email: Jeremy.Whish@csiro.au
Acknowledgements
This work was funded by CSIRO, The Northern Growers Alliance, and GRDC. The time and assistance provided by Greg Rummery, Brad Coleman, Neil Newton and Simon Logan was greatly appreciated.
Reviewed by
Neil Huth
Was this page helpful?
YOUR FEEDBACK