Help for Farm Business to manage profitability and manage risk
| Date: 09 Oct 2014
Sarah Jacobson
Agronomist, Consultant to CWFS for the Profit and Risk Project,
Take Home Messages
- Cash flow analysis shows the sensitivity of the farm business to varying seasons.
- Mixed Farming Systems are more sustainable in poorer seasons. However, they are not as able to capture the large profits in the better years (Decile>5).
- Leasing provides opportunity for business expansion when a business is in a low equity position.
Background
After 10 years of drought and then the subsequent wet year of 2010 farmers in the Central West realised how volatile their businesses have become. The Profit and Risk project was born from the feedback Central West Farming Systems (CWFS) was receiving from farmers wanting help in managing the ups with the downs, the dry and the wet. Farmers wanted to make their business more sustainable. These conditions left growers to feel that their farm profitability was at the mercy of the climate and their only tool to manage this risk was through agronomic improvements. Throughout this project the aim has been to put the power of control back in the hands of the farmer when they are faced with unfavourable climate conditions. The plan was to help increase their capacity to manage profitability and risk. There is an opportunity for farmers to improve their farm business health with long term sustainable goals whilst managing their risk.
Under the GRDC funded Low Rainfall Profit Risk Project Ed Hunt from Ed Hunt Agricultural Consultancy in 2013/14 ran a pilot project with a group of farmers from West Wyalong. John Minogue a local consultant was also involved to help give a local perspective on a broader scale. Through facilitation the farmers discussed what they thought an average farm would look like in the area. Together we built a model farm based on real farm figures for the West Wyalong district that we could apply different scenarios to and utilise our risk profile to manage our cash flow position.
The group discussions were invaluable in creating the model farm and provided all participants the chance to challenge their reasoning and risk position. All participants conveyed their own experiences and this formed the basis of the model farm.
The group discussed how the risk position of their own businesses has changed over time. Those businesses that have gone through succession planning talked about the Farmer that lived through the depression, droughts and war being conservative in their risk position versus the next generation that remembers the 1970’s and late 1990’s with the run of good seasons and hence the risk takers.
What does the model farm look like? We began with establishing the resources that were available. The soils were classified and quantified, the enterprise mix, basic agronomic applications and inputs.
As with any model there are some basic assumptions that are made. These included assumptions on fixed overhead costs (rates, water, insurance, and power), machinery, crop inputs, crop yield potential, livestock type income and costs, and pasture costs.
Table 1: Case study farm assumptions
| Location | West Wyalong |
|---|---|
| Climate Records | West Wyalong Airport |
|
|
Decile 5 424mm ave rainfall |
|
Farm Size (Arable Land) |
1585ha |
|
Soils |
30%Sandy, 35% Sand Loam, 35% Heavy Soil |
|
Land Value |
$1976ha $800/acre |
|
Overdraft |
-$500,000 |
|
Equity |
85% |
|
Machinery Invested |
$54/tonne produced |
|
Cropping System (Land Allocation) |
Wheat = 45% Barley = 27% Vetch = 3% Canola = 22% 220ha Pasture 460ha Grazed Winter Pasture 960 ewes,175 hoggets, 960 lambs –total dse 4.59/ha/100mm |
The tables 2 and 3 below show the yield potentials for the various decile years.
Table 1: Wheat Yield
|
|
1 |
3 |
5 |
7 |
9 |
|---|---|---|---|---|---|
|
Zone 1 % Sand |
0.5 |
1.6 |
2.2 |
3 |
4 |
|
Zone 2 % Sandy Loam |
0.5 |
1.6 |
2.2 |
3 |
4 |
|
Zone 3 % Heavy |
0.5 |
1.6 |
2.2 |
3 |
4 |
|
Average Yield (t/ha) |
0.5 |
1.6 |
2.2 |
3.0 |
4.0 |
Table 2: Lupin Yield
|
|
1 |
3 |
5 |
7 |
9 |
|---|---|---|---|---|---|
|
Zone 1 |
0.2 |
0.6 |
1.1 |
1.5 |
1.9 |
|
Zone 2 |
0.1 |
0.5 |
0.9 |
1.3 |
1.7 |
|
Zone 3 |
0 |
0 |
0 |
0 |
0 |
|
Average Yield (t/ha) |
0.0 |
0.1 |
0.2 |
0.3 |
0.4 |
To include risk into the equation it is best to view the farm performance over the range of rainfall deciles and a range of seasons. This model uses a cumulative cash flow and then break even analysis enabling model users to picture the overall result. This shows how sensitive the farm business is to various seasons and business structures reflecting our various risk profiles.
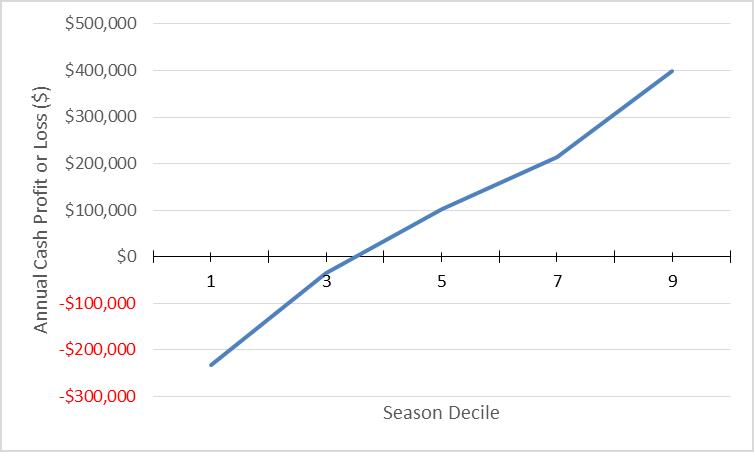
Graph 1: Annual Profit of Mixed Farm as listed above
The mixed cropping model farm which we have described above is breaking even just below decile four. The loss in a decile one year being -$233,000 but the Annual cash profit in a decile 9 season close to $400,000. The equity after a decile one year would reduce to 77 % but increase to 97% in a decile 9 year.
What if we take livestock out of the picture and are 100% cropping on our model farm the cash flow position changes as shown below in Graph 2.
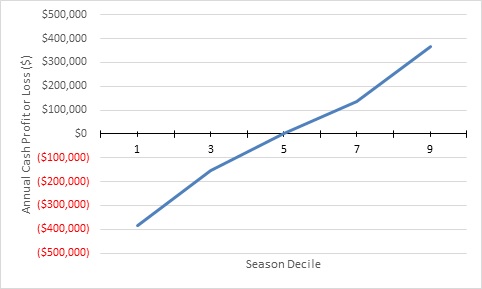
Graph2: Annual Profit of 100% Cropping with 85% equity
This is with 500ha wheat, 300ha barley, 245ha canola, 100ha lupins and no livestock. The starting equity is 85% also. The win is greater but the loss is also larger in a decile 1 year. Those 100% croppers amongst us will argue often it is the time the rain falls that matters or they reduce inputs according to the season’s progress. These all reflect our varying attitudes to risk and need to be taken into account when utilising the model farm as a business tool.
What happens when we reduce the equity to 65% from 85%. In the mixed cropping farm which is shown below
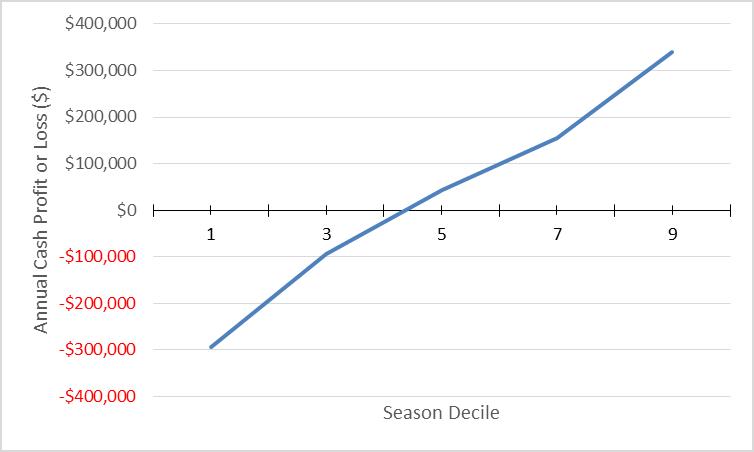
Graph 3: Annual Profit Mixed Farm with 65% equity
The equity reduced down to 55% in a decile 1 year and increased to 75% in a decile 9 year. The breakeven point also increased with associated extra finance costs of lower equity.
When we look at the 100% cropper if we take starting equity of 65% the equity drops to 52% in a decile 1 year and 75% in a decile 9 year.
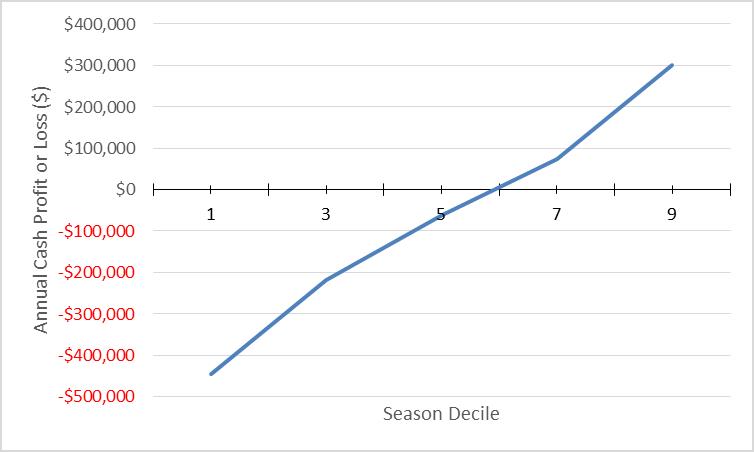
Graph 4: Annual profit 100% cropper and 65% equity.
The breakeven point for the 100% cropper with a lower equity is now at a decile 6 year. It is also worth considering what the consequences would be the following year.
After some discussion the group decided their model farm really best represented the mixed farmer in West Wyalong. With many of the 100% croppers often having larger areas than the model was using. These variables can all be adjusted on a one on one basis to reflect your business. But the group agreed it was worthwhile to look at the consequences of dropping livestock from the equation.
Livestock provided consistent income, despite poor seasonal conditions and helped to buffer the business against interest costs when consecutive losses were realised. It was clear from this analysis that mixed farming systems in this environment have the capacity to withstand a consecutive run of poor seasons more effectively than those without a livestock enterprise.
The group established that a business that did not adjust its strategy after a run of poor seasons puts itself at significant risk. We then discussed the options available to help build capacity in our businesses.
An option available to farmers for their business strategy is a reduction in farm inputs. The model assumes variable costs for wheat at $99/ha. However a business could adopt the strategy to reduce the variable costs in response to each consecutive poor season. For example, starter fertiliser was maintained for the first two poor seasons, but was reduced to maintenance rates in the subsequent seasons. This was adopted by many farmers in the most recent drought. Other costs that the group looked at reducing were wages, and drawings to help business sustainability in the lower decile years.
Leasing was an option that some farmers are using to help manage the variation in cash flow. Leasing provided an additional income stream but losses can be minimised when conditions are not as favourable. The group agreed leasing, if available, was a safer option for business expansion for businesses with a lower starting equity. The variable lease means the farmer does not take all the risk and allows the land owner to share some of the risk.
Now the model farm has been reviewed by the group all agree this is a useful business tool which helps in planning and management decisions. The group are keen to have others use the model and give feedback for further uses or applications that can help all farm businesses to be more sustainable.
The best business structure and enterprise for one farming business may not be the best for another as farming is not a one size fits all model.
Contact Details
Sarah Jacobson
0427487346
Was this page helpful?
YOUR FEEDBACK