2015 barley variety update
Author: Jason Eglinton and Rob Wheeler | Date: 10 Feb 2015
Jason Eglinton1 and Rob Wheeler2,
1 Barley Program Leader, School of Agriculture, Food & Wine, University of Adelaide, 2 Leader, New Variety Agronomy, SARDI, Waite Campus
Keywords: barley, new variety performance, National Variety Trials, variety adoption.
Take home messages:
- Barley holds up well against frost and a dry spring
- Compass, Fathom, La Trobe and Hindmarsh lead yield results
- Maritime and Compass lead grain size results
The 2014 season
The area sown to barley in South Australia in 2014/15 is estimated at 870,000 hectares, which is quite consistent with the area sown over the past five years but down on the longer term history (Figure 1). Total barley production is predicted to be 1.88 MMT at a state wide grain yield of 2.17 t/ha compared to 1.93 t/ha for wheat. This represents a 13 per cent reduction in average grain yield compared to the 2.47 t/ha achieved for barley in 2013.
Early sowing opportunities in almost all districts except the south east, good early season rainfall, and a warmer than average winter temperatures set up high yield potential. While conditions were favourable for foliar diseases the level of infection was not generally high. Scald was not common, and spot form of net blotch was often observed on Hindmarsh, Buloke and Scope crops in Mallee environments but not to the extreme levels seen in 2013. Leaf rust infection occurred quite late in most districts and if it was not controlled by fungicides then crop damage was generally limited by the early finish to the season. Powdery mildew infection in barley continued to be rare in contrast to grower experience in Western Australia and is the reward for South Australian farmer's use of effective seed treatments and resistant varieties.
For the fourth year loose smut appeared in a significant number of Hindmarsh crops and in most cases some form of seed treatment was used. Testing by SARDI Field Crops Pathology shows Vitavax 200FF and the new SDHI products provide the most complete control. Net form of net blotch was seen in prone environments including the Mid North, Northern Yorke Peninsula and Upper Eyre Peninsula, but fungicide control was generally effective. Within National Variety Trials (NVT), disease was effectively controlled with the exception of net form of net blotch in Maritime at Minnipa. Despite multiple fungicide applications Maritime had severe infection by flowering and although grain yield was broadly in line with expectation, screenings increased to over 15 per cent and this is a reminder of the difficulty in controlling net form of net blotch in very susceptible varieties.
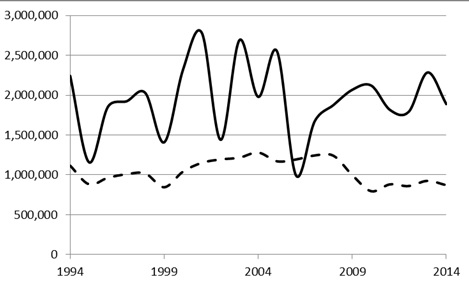
Figure 1. ABARES values for South Australian barley production in metric tonnes (solid line) and hectares sown (dashed line).
Widespread and severe frost events during spring caused damage in many districts. Barley is more frost tolerant than other crop options and damage was generally limited to areas where extreme low temperatures occurred. While all barley varieties are more tolerant than wheat, there is economically important variation between varieties. As part of the GRDC supported Frost Initiative, commercial barley and wheat varieties have been benchmarked for their reaction to frost at flowering by the University of Adelaide and DAFWA. The ratings for frost tolerance have been developed following three years of field trials at three locations and are now available from the NVT website (www.nvtonline.com.au).
2014 NVT results
Seeding dates ranged from 8th May at Paruna and Darke Peak to 17th June at Bordertown, however most trials were sown in the third week of May. All trials returned statistically acceptable results although there were no significant differences in grain yield between varieties for the Cummins trial. This unusual result was likely influenced by prolonged waterlogging during winter and caution should be taken in interpreting results from the trial.
Site mean yield ranged from 1.95 t/ha at Lameroo to 5.6 t/ha at Turretfield with an average across the state of 3.68 t/ha compared to 3.70 t/ha in 2013 and 3.34 t/ha in 2012. However the similarity in state grain yield between 2013 and 2014 masks some major differences in regional conditions. Compared to 2013, Upper Eyre Peninsula averaged 0.2 t/ha higher, Lower Eyre Peninsula 0.4 t/ha lower, Yorke Peninsula was the same, the Mid North 1.2 t/ha higher, the Murray Mallee was the same, and the South East a dramatic 2.5 t/ha lower than the previous year.
A total of 42 barley varieties and advanced breeding lines were evaluated in the 2014 South Australian NVT trial series.
The relative performance of named varieties in the 2014 NVT is summarised in Table 1. The grain yield for each variety is expressed as a percentage of the regional mean yield. The results are generally consistent with 2013, with later maturing varieties less competitive under the dry spring conditions. Even at the locations with grain yield greater than 5 t/ha (Salters Springs, Bute and Turretfield) the later maturing varieties such as Flinders, Gairdner, Oxford, Westminster and Wimmera were lower yielding than the leading early and mid-maturity varieties.
The top four varieties for grain yield were Compass, Hindmarsh, LaTrobe and Fathom, which have all established strong track records for yield potential and yield stability in South Australia. Commander remains the best performing of the established malting varieties, and along with Buloke, will continue to offer the widest marketing opportunities because of established domestic and international demand. However both varieties are around 10 per cent below the leading grain yield results and are expected to be replaced over the next few years.
Table 1: Mean grain yield for named varieties in 2014 NVT as a function of the district mean is shown for each region. The two highest yield values in each region are highlighted in bold and underlined.
|
Upper Eyre Peninsula |
Lower Eyre Peninsula |
Yorke Peninsula |
Mid North |
Murray Mallee |
South East |
|
|---|---|---|---|---|---|---|
|
FEED |
||||||
|
Barque |
92 |
- |
96 |
94 |
93 |
- |
|
Fathom |
108 |
103 |
108 |
106 |
104 |
110 |
|
Fleet |
101 |
101 |
106 |
101 |
96 |
107 |
|
Keel |
107 |
104 |
105 |
102 |
109 |
111 |
|
Maritime |
92 |
98 |
98 |
95 |
80 |
95 |
|
Oxford |
85 |
94 |
93 |
96 |
88 |
80 |
|
MALTING / FOOD* |
||||||
|
Bass |
92 |
100 |
97 |
102 |
90 |
95 |
|
Buloke |
93 |
101 |
99 |
98 |
94 |
103 |
|
Charger |
103 |
100 |
98 |
|||
|
Commander |
98 |
102 |
103 |
101 |
89 |
103 |
|
Flagship |
90 |
93 |
90 |
93 |
98 |
94 |
|
Gairdner |
92 |
90 |
91 |
- |
96 |
|
|
GrangeR |
91 |
96 |
98 |
102 |
89 |
94 |
|
Hindmarsh* |
108 |
110 |
104 |
109 |
104 |
115 |
|
Navigator |
|
- |
88 |
|||
|
Schooner |
82 |
89 |
91 |
93 |
83 |
93 |
|
Scope |
89 |
99 |
98 |
96 |
95 |
104 |
|
Westminster |
- |
84 |
90 |
88 |
- |
88 |
|
Wimmera |
- |
- |
95 |
93 |
- |
93 |
|
UNDERGOING ACCREDITATION |
||||||
|
Alestar |
96 |
98 |
99 |
94 |
93 |
- |
|
Compass |
113 |
111 |
111 |
105 |
123 |
116 |
|
Flinders |
86 |
90 |
92 |
96 |
92 |
90 |
|
LaTrobe |
110 |
109 |
106 |
109 |
110 |
112 |
|
Macquarie |
- |
87 |
91 |
87 |
- |
93 |
|
Maltstar |
100 |
97 |
97 |
95 |
- |
- |
|
Skipper |
105 |
104 |
105 |
104 |
115 |
- |
|
SY Rattler |
- |
101 |
- |
95 |
||
|
Trial Number |
4 |
3 |
5 |
3 |
3 |
2 |
|
Regional Mean (t/ha) |
3.18 |
3.73 |
4.31 |
4.95 |
2.42 |
3.07 |
Considering the 2014 seasonal conditions, the physical grain quality from NVTs was excellent. Grain protein averaged 11.95 per cent across the state and ranged from 10.2 per cent at Salters Springs to 13.6 per cent at Minnipa. Compass was within the 9-12 per cent range at 18 of the 20 sites while the much lower yielding variety Schooner was within malting specification for protein at only 5 trial locations. Test weight values were high with the mean value from each trial exceeding the 65 kg/hl limit for Malt1 grade. Commander and Compass averaged more than 68.5 kg/hl across the 20 trials while Bass, Flagship, LaTrobe and Schooner averaged more than 71 kg/hl.
The dry spring conditions and generally high yield potential did generate significant pressure on grain size although this was not particularly evident in screenings. Across the NVT series screenings averaged 7.3 per cent and this was elevated by modest performances by some varieties such as Gairdner, Macquarie, Maltstar and SY Rattler, and results from Crystal Brook, Keith and Minnipa which averaged greater than 20 per cent screenings. The top varieties for grain yield achieved Feed1 screenings at high frequency with Hindmarsh exceeding the 10 per cent limit at only three locations, Fathom and LaTrobe at only two locations, and Compass only at Keith.
Retention values provided significant discrimination between varieties in 2014 and this was also a key factor for commercial downgrades from Malt1. The mean grain plumpness (per cent retained above 2.5mm screen) for each region is shown in Table 2. Average values for individual trials range from 90 per cent for Arthurton down to just 39 per cent at Crystal Brook. Gairdner achieved the 70 per cent retention limit for Malt1 in just 2 of the 13 trials it was tested, while Commander and Compass achieved the grade at 13 of the 20 trial locations. Bass and Skipper continued their good record for plump grain, and Compass returned the highest values among the established and potential malting varieties. Maritime issued a reminder of its benchmark grain size stability achieving the retention limit in 17 of the 20 trials, demonstrating further breeding gains in malting barley are possible.
Table 2: Mean grainsize (% retained above 2.5mm screen) for named varieties in 2014 NVT is shown for each region. The two highest values in each region are highlighted in bold and underlined.
|
Upper Eyre Peninsula |
Lower Eyre Peninsula |
Yorke Peninsula |
Mid North |
Murray Mallee |
South East |
|
|---|---|---|---|---|---|---|
|
FEED |
||||||
|
Barque |
68 |
- |
78 |
69 |
73 |
- |
|
Fathom |
76 |
82 |
84 |
77 |
84 |
67 |
|
Fleet |
71 |
74 |
81 |
72 |
77 |
70 |
|
Keel |
67 |
68 |
82 |
70 |
80 |
68 |
|
Maritime |
84 |
89 |
90 |
84 |
93 |
79 |
|
Oxford |
53 |
62 |
53 |
43 |
61 |
33 |
|
MALTING / FOOD* |
||||||
|
Bass |
79 |
88 |
84 |
76 |
86 |
51 |
|
Buloke |
58 |
70 |
66 |
59 |
61 |
47 |
|
Charger |
- |
- |
67 |
59 |
- |
36 |
|
Commander |
70 |
73 |
76 |
70 |
83 |
66 |
|
Flagship |
57 |
67 |
68 |
61 |
63 |
43 |
|
Gairdner |
- |
65 |
58 |
48 |
- |
47 |
|
GrangeR |
73 |
79 |
80 |
72 |
73 |
41 |
|
Hindmarsh* |
65 |
69 |
79 |
72 |
74 |
54 |
|
Navigator |
- |
- |
- |
- |
- |
59 |
|
Schooner |
70 |
78 |
73 |
78 |
68 |
60 |
|
Scope |
56 |
77 |
70 |
65 |
68 |
55 |
|
Westminster |
- |
78 |
78 |
63 |
- |
61 |
|
Wimmera |
- |
- |
72 |
56 |
- |
53 |
|
UNDERGOING ACCREDITATION |
||||||
|
Alestar |
75 |
76 |
76 |
56 |
- |
- |
|
Compass |
82 |
79 |
87 |
82 |
89 |
64 |
|
Flinders |
67 |
80 |
72 |
66 |
64 |
48 |
|
LaTrobe |
68 |
70 |
80 |
69 |
79 |
64 |
|
Macquarie |
- |
62 |
50 |
38 |
- |
48 |
|
Maltstar |
46 |
60 |
49 |
33 |
- |
- |
|
Skipper |
71 |
78 |
87 |
82 |
86 |
- |
|
SY Rattler |
- |
- |
- |
62 |
- |
31 |
|
Regional Mean |
67 |
73 |
74 |
66 |
75 |
53 |
Contact details
Jason Eglinton
University of Adelaide, Waite Campus
08 8313 6553
Jason.Eglinton@adelaide.edu.au
Rob Wheeler
SARDI, Waite Campus
08 8313 9480
Was this page helpful?
YOUR FEEDBACK