Impact of crop varieties on RLN multiplication
Author: Brendan Burton, Northern Grower Alliance | Date: 01 Mar 2015
Take home message
- Know your enemy - soil test to determine whether RLN are an issue and which species are present
- Select wheat varieties with high tolerance ratings to minimise yield losses in RLN infected paddocks
- To manage RLN populations, it is important to increase the frequency of RLN resistant crops in the rotation
- Multiple resistant crops in a rotation will be necessary for long term management of RLN populations
- There are consistent varietal differences in Pt resistance within wheat and chickpea varieties
- Avoid crops or varieties that allow the build-up of large populations of RLN in infected paddocks
- Monitor the impact of your rotation
What are nematodes?
Nematodes (or roundworms) are one of the most abundant life-forms on earth. They are adapted to nearly all environments. In cropping situations they can range from being beneficial to detrimental to plant health.
The root-lesion nematodes (RLN) are a genus of microscopic plant parasitic nematode that are soil-borne, ~0.5 to 0.75 mm in length and will feed and reproduce inside roots of susceptible crops or plants. There are two common species of RLN in the northern grains region; Pratylenchus thornei (Pt) and Pratylenchus neglectus (Pn). This paper will concentrate on Pt – often described as the cereal and legume root-lesion nematode.
Why the focus on Pt?
- Pt are widespread in the northern grains region. Surveys conducted within Nth NSW and Sth Qld cropping areas consistently show Pt presence in ~60-70% of paddocks
- Pt are frequently at concerning levels. Found at >2 Pt/g soil in ~30-40% of paddocks
- Yield losses in wheat of up to 50% are not uncommon when Pt intolerant wheat varieties are grown in paddocks infested with Pt.
- Yield losses in chickpeas of up to 20% have also been measured in DAFF QLD trials
- There is no easy solution to RLN infestation. Variety and crop rotation are currently our major management tools
Figure 1 is a simplified chart that highlights the critical first step in the management of RLN is to test your soil and determine whether or not you have an issue to manage. NB where RLN are present, growers should focus on both 1) planting tolerant wheat varieties and 2) increasing the number of resistant crops/varieties in the rotation
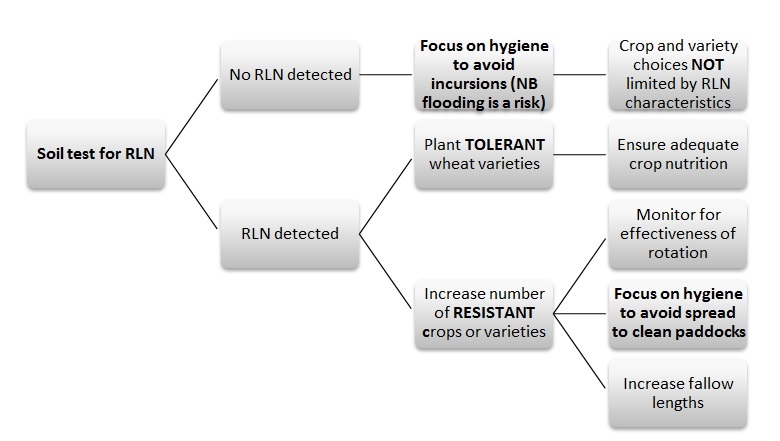
Figure 1. RLN management flow chart
Soil testing
The critical first step in the management of RLN is to test your soil and determine whether or not you even have the issue. Testing of soil samples is most commonly conducted via DNA analysis (commercially available as the PreDictaB® test from SARDI) with sampling to depths of 0-15 or 0-30 cm.
Vertical distribution of Pt in soil is variable. Some paddocks have ‘relatively’ uniform populations down to 30 or 60 cm, some will have highest Pt counts in the 0-15 cm layer whilst other paddocks will have Pt populations increasing at deeper depths eg 30-60 cm. Although detailed knowledge of the distribution may be of some value, the majority of on-farm management decisions will be based on presence or absence of Pt with sampling at 0-15 or 0-30 cm depth providing that information.
What is seen in the paddock?
Although symptoms of RLN damage in wheat can be dramatic, they can be easily confused with nutritional deficiencies and/or moisture stress.
Damage from RLN results in brown root lesions but these are difficult to see and can also be caused by other organisms. Root systems are often compromised with reductions in root branching and quantities of root hairs together with a reduced ability to penetrate deeply into the soil profile. RLN create an inefficient root system that impairs the ability of the plant to access nutrition and water.
Visual damage above ground from RLN in wheat is non-specific. Lower leaf yellowing is often observed together with reduced tillering and a reduction in the amount of crop biomass. Symptoms are more likely to be observed later in the season, particularly when the crop is reliant on sub soil moisture. Clear symptoms are generally not seen in other crops.
In the early stages of RLN infection, localised patches of poor performing wheat may be observed. Soil testing of these patches may help to determine or eliminate RLN as a possible issue. In paddocks where previous wheat production has been more uniform, a random soil coring approach may be more suitable. Another useful indicator of RLN presence is low yield performance of RLN intolerant wheat varieties.
Management of RLN
- Nematicides (control in a drum): there are no registered nematicides for RLN in broadacre cropping in Australia. Screening of potential candidates continues to be conducted but RLN are a very difficult target with populations frequently deep in the soil profile.
- Nutrition: damage from RLN reduces the ability of cereal roots to access nutrients and soil moisture and can induce nutrient deficiencies. Under fertilising is likely to exacerbate RLN yield impacts however over fertilising is still unlikely to compensate for a poor variety choice.
- Variety choice and crop rotation: These are currently our most effective management tools for RLN. However the focus is on two different characteristics - Tolerance (ability of the variety to yield under RLN pressure) and Resistance (impact of the variety on the build-up of RLN populations). NB varieties and crops often have varied tolerance and resistance levels to Pt and Pn.
- Fallow: RLN populations will generally decrease during a ‘clean’ fallow but the process is slow and expensive in lost ‘potential’ income. Additionally long fallows may decrease Mycorrhizal (VAM) levels and create more cropping issues than they solve.
Tolerance
Regional winter crop sowing guides detail the level of variety tolerance to both species of RLN. Selection of wheat varieties on the basis of these published RLN tolerance rankings is critical to avoid significant yield losses, particularly in paddocks with large populations of Pt. Wheat breeding has successfully produced a range of varieties with moderate or higher levels of tolerance to Pt eg EGA Wylie, EGA Burke, EGA Eaglehawk and EGA Gregory together with the more recent releases of Lancer, Gauntlet, Sunguard and Suntop. These varieties will reduce the extent of yield loss due to Pt, however some of these varieties may still allow high levels of nematode build-up. The second issue to be considered is the variety resistance/ susceptibility level.
Resistance
Resistance is the impact of the variety on RLN multiplication. Eradication of RLN from an individual paddock is highly unlikely so effective long term management is based on choosing options that limit RLN multiplication. This involves using crop or variety choices that have useful levels of Pt resistance and avoiding varieties that consistently cause large increases in Pt numbers.
All the data presented has been from soil sampling depths of 0-30cm.
1. Resistance differences between winter crops
The primary method of managing RLN populations is to focus on increasing the number of resistant crops in the rotation. Knowledge of the species of RLN present is critical as crops that are resistant to Pt may be susceptible to Pn. Key crops that are generally considered resistant or moderately resistant to Pt are sorghum, sunflower, maize, canola, canary seed, cotton and linseed. Wheat, barley, chickpeas, faba beans, mung beans and soybeans are generally susceptible - although the level of susceptibility may vary between varieties. Field peas (Maki, Yarrum and CRC Walana) were also evaluated. Field peas have previously been considered resistant however many newer varieties appear more susceptible. Figure 2 shows the mean Pt population remaining after a range of winter crops were grown near Weemelah in 2011. Although all crops were sown in individual trials - to enable weed and pest control - the data gives some indication of the magnitude of Pt resistance differences between these crops.
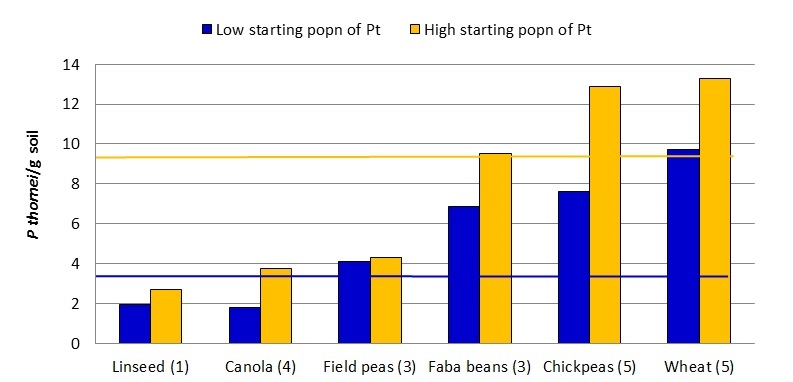
Figure 2. Comparison of Pt populations remaining in March /April 2012 following different winter crop species near Weemelah 2011 (Trials RH1101-1109)
(Number) indicates the number of varieties within each crop. The two horizontal lines indicate the respective ‘low’ and ‘high’ starting Pt levels in March 2011
2. Resistance differences between commercial wheat varieties
Root-lesion nematode resistance ratings for wheat varieties have been published in variety guides for many years and these ratings should be used to assist in variety selection. There is a strong relationship between the resistance ratings produced by DAFF in glasshouse experiments and field assessment of resistance measured by high throughput DNA analysis. The large amount of field data generated in recent years has however helped to quantify the importance of variety differences in resistance rating. Figure 3 shows the relative variety impact on Pt populations as a % of the moderately resistant durum variety Hyperno, in trials conducted during 2009-2012.
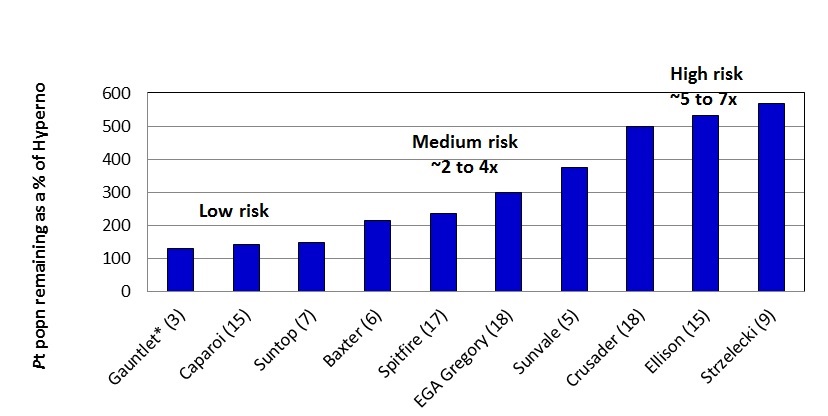
Figure 3. Comparison of Pt population remaining as a % of Hyperno, 2009-2012
(Number) indicates the number of field trials in which the variety was evaluated
* Gauntlet has only been evaluated in 3 field trials but has also performed well in pot resistance studies
Other common bread wheat varieties that are classed as high risk for Pt multiplication are Kennedy, EGA Bounty, Elmore CL, Sunvex, Gazelle, Sunco, Janz, Impala and Lincoln.
Key point: Bread wheats are generally Pt susceptible but there are large differences between varieties in the level of susceptibility. Growers with Pt infestations must avoid high risk or ‘sucker’ varieties that result in very high levels of Pt multiplication. NB although durum varieties generally restrict Pt multiplication compared to bread wheats, they are very susceptible to crown rot.
3. Resistance differences between commercial barley varieties
Field work suggests the differences in resistance between the current commercial barley varieties is much smaller than in wheat. The bulk of barley varieties appear to fall into the medium risk category for building up Pt populations, with only Compass and Commander falling into a low risk category.
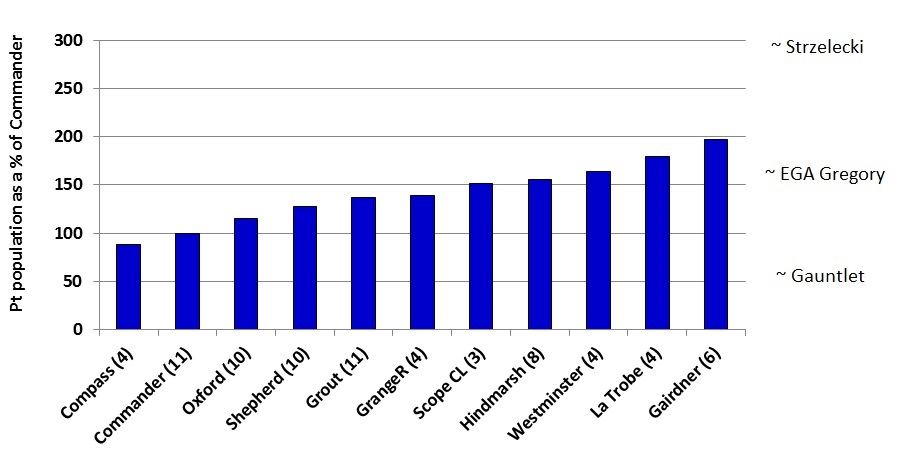
Figure 4. Comparison of Pt population remaining between barley varieties as a % of Commander, 2009-2013. (Number) indicates the number of field trials in which the variety was evaluated. The position of the wheat varieties on the RHS of the graph indicate our best current estimate of comparison between these varieties for Pt build-up. This data has been generated where barley and wheat have been grown within the same replicated trial or at least at the same trial site.
4. Resistance differences between desi chickpea varieties
Recent field data is also showing consistent differences in Pt resistance between commercial chickpea varieties. Figure 5 shows a summary of the performance of a range of chickpea varieties in 9 trials, during 2010-2014, conducted by DAFF QLD, NSW DPI or NGA.
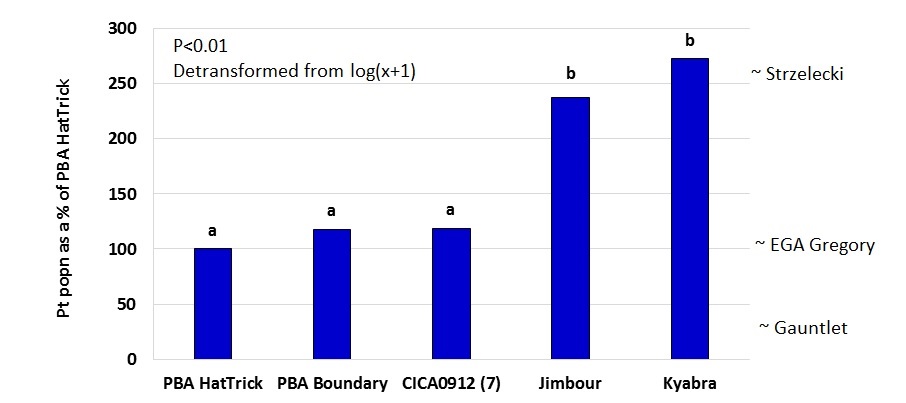
Figure 5. Comparison of Pt population remaining between desi varieties as a % of PBA HatTrick, 2010-2014. All varieties evaluated in all 9 trials except CICA0912 (only 7 trials).
The position of the wheat varieties on the RHS of the graph indicate our best current estimate of comparison between these varieties for Pt build-up. This data has been generated where desi chickpeas and wheat have been grown at the same trial site.
Key point: All desi varieties evaluated to date appear to provide a medium to high risk of Pt build-up. Mean Pt populations after Jimbour and Kyabra have been generally double the level compared to the population remaining after growing either PBA HatTrick or PBA Boundary. Growers with Pt infestations should certainly avoid varieties that support higher populations of Pt.
5. Resistance differences between kabuli chickpea varieties
Field data has not shown any consistent differences in resistance between the current commercial kabuli varieties. In general, kabuli varieties appear to be leaving behind a similar Pt population to the highly susceptible desi chickpea varieties such as Jimbour and Kyabra. This would suggest all current commercial kabuli varieties are in the high risk category for Pt build-up.
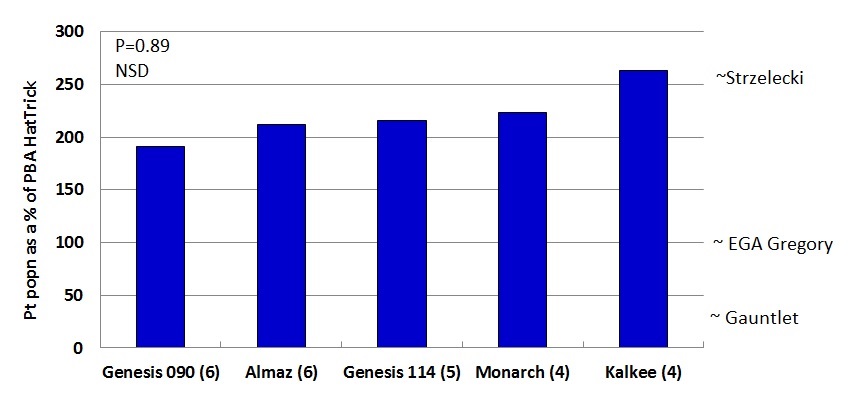
Figure 6. Comparison of Pt population remaining between kabuli varieties as a % of PBA HatTrick, 2010-2014. (Number) indicates the number of field trials in which the variety was evaluated.
NSD= No significant difference between treatments. The position of the wheat varieties on the RHS of the graph indicate our best current estimate of comparison between these varieties for Pt build-up. This data has been generated where kabuli chickpeas and wheat have been grown at the same trial site.
6. Resistance differences between faba bean varieties
The recent release of PBA Warda has seen a significant improvement in Pt resistance, compared to the older varieties of Doza and Cairo. This data was collected from a total of 6 separate trials from 2011-2014 with all varieties included at all sites.
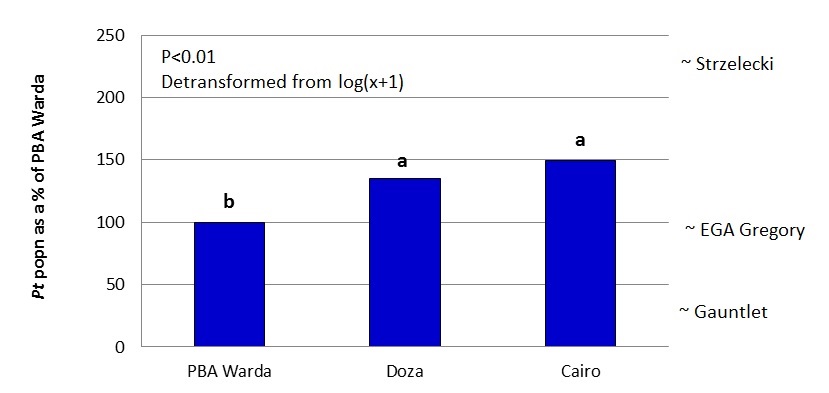
Figure 7. Comparison of Pt population remaining between faba bean varieties as a % of PBA Warda 2011-2014. The position of the wheat varieties on the RHS of the graph indicate our best current estimate of comparison between these varieties for Pt build-up. This data has been generated where faba beans and wheat have been grown at the same trial site.
The experimental variety IX220D/2-5 was included in 2 out of the 6 trials. Preliminary results indicate that IX220D/2-5 is similar to Doza and Cairo in Pt build-up.
7. Resistance differences less evident in summer crops
Smaller data sets have been generated for commercial hybrids of sorghum, cotton and sunflower. Differences between varieties or hybrids in level of Pt resistance in these crops have been small or not significant to date. Figure 8 shows the mean results from 6 common sorghum hybrids that have been evaluated in a series of 9 individual trials. There was no indication of any consistent difference in Pt resistance between these, or any other, sorghum hybrids evaluated.
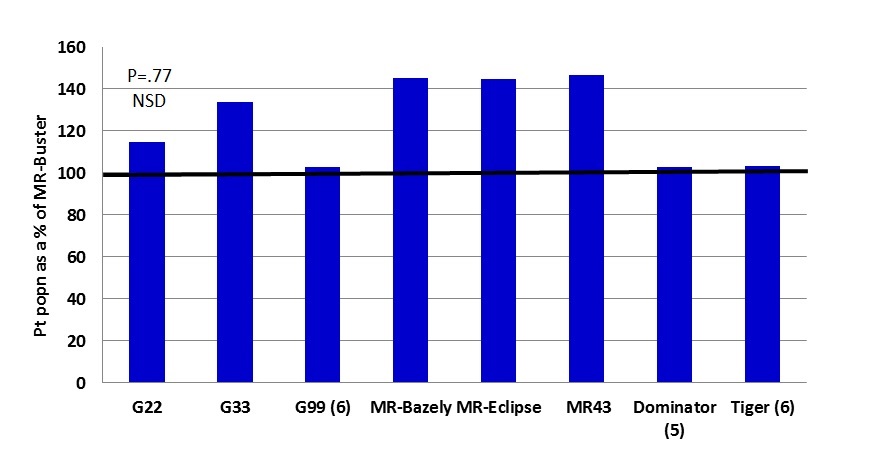
Figure 8. Comparison of Pt population remaining as a % of MR-Buster, summer 2012/13 and 2013/14. All sorghum hybrids evaluated to date appear to provide a low risk of Pt build-up.
NSD= No significant difference between treatments. The table below is a summary of the resistance differences observed in field trials evaluated since 2009. These results support previous DAFF Qld findings.
Table 1. Comparison of crops for Pt build-up risk and frequency of significant variety differences
|
Crop |
Pt build-up risk |
Variety differences |
|---|---|---|
|
Sorghum |
Low |
None observed |
|
Cotton |
Low |
None observed |
|
Sunflower* |
Low |
None observed |
|
Linseed* |
Low |
- |
|
Canola* |
Low** to Medium |
None observed |
|
Field peas* |
Low to Medium |
Low |
|
Durum-wheat |
Low to Medium |
Moderate |
|
Barley |
Low to Medium** |
Moderate |
|
Bread-wheat |
Low, Medium to High** |
Large |
|
Chickpea |
Medium to High |
Moderate to Large |
|
Faba beans |
Medium to High |
Low |
|
Mung beans* |
Medium to High ? |
Moderate to Large ? |
*= data only from 1-2 field trial locations for these crops
** crops with a range of build-up risk but a dominant category, the dominant category is identified by (**), eg barley; majority of varieties in the medium risk category but some low risk.
Bread wheat: varieties in all categories but most varieties are in the medium to high risk categories
Summary
RLN are key constraints of crop production in the northern grains region. The level of economic impact on intolerant wheat varieties is well understood but there have been concerning impacts also seen in chickpeas.
Once RLN are established in a paddock the key management tools are crop and variety choice. When wheat is grown, growers and advisors must focus on selecting tolerant varieties to avoid large yield losses. At the same time it is important to maximise the number of resistant crops/ varieties in the rotation and ensure that high risk or ‘sucker’ varieties are avoided. Unfortunately a single resistant crop is highly unlikely to be an effective management tool for RLN.
Acknowledgments
The research undertaken as part of this project is made possible by the significant contributions of growers through both trial cooperation and the support of the GRDC, the author would like to thank them for their continued support.
Thank you to the growers involved in numerous trials but particularly to Bill Yates, Sean Coleman, Rob Taylor and Brad Coleman for their co-operation in large and complex trials. In addition, our thanks to Steven Simpfendorfer and Kevin Moore (NSW DPI) and Kirsty Owen (DAFF QLD) for trial data included in summaries and assistance in interpretation. Thanks also to AGT, HSR, Pacific Seeds, Pioneer, Seedmark, Seednet, the University of Sydney PBI and Viterra for providing seed or research input.
Contact details
Name: Brendan Burton
Organisation: Northern Grower Alliance
Phone: 07 4639 5344
Email: brendan.burton@nga.org.au
Varieties displaying this symbol beside them are protected under the Plant Breeders Rights Act 1994
GRDC Project Code: NGA00003; DAN00143; DAQ000154,
Was this page helpful?
YOUR FEEDBACK