Performance of current northern farming systems
Author: Lindsay Bell (CSIRO Toowoomba), Jeremy Whish, Andrew Zull and Jayne Gentry (Department of Agriculture and Fisheries Queensland) and Peter DeVoil (University of Queensland) | Date: 03 Sep 2015
Take home messages
- There is potential to improve the performance of current northern farming systems.
- Cropping intensity, the management of fallows and the configuration of crop sequences appear to be key areas where improvements are possible.
- There are trade-offs between sequences that maximise profit and optimising resource efficiency and minimising threats to the cropping system.
- More intense crop sequences with more double crops can increase system production and water-use-efficiency but they also increase economic risk.
- Most sequences are at risk from increasing soil-pathogens, nutrient depletion and weed management challenges - systems involving alternative ‘break-crops’ or more diversity are required.
Introduction
Many cropping systems in the northern grains region are facing significant sustainability and profitability challenges. Current cropping sequences are being challenged by declining soil resilience, build-up of soil-borne pathogens such as root lesion nematodes, and increasing reliance on external inputs. Furthermore most systems continue to deplete soil nutrients which would cost an additional $75-200/ha to be replaced.
Recent analysis also suggests that there is potential to increase the efficiency of current farming systems (Hochman et al. 2014). A survey of recorded crop yields and inputs over several years was compared with simulations which predicted potential water and nitrogen limited yield in the northern region (Figure 1a). This showed that 36 per cent of the crops grown were able to achieve an efficiency of greater than 80 per cent. The yield of a few crops (22%) was limited by low nitrogen (N) input while over 80 per cent of surveyed crops received adequate N fertiliser to optimise their water-limited yield. However, when the sequences of crops grown were simulated this showed even poorer performance with only 29 per cent of fields surveyed achieving 80 per cent of their potential water use efficiency. This suggests that crop sequences in the northern region are less agronomically efficient than the sum of their parts. That is, cropping intensity, the management of fallows and the configuration of crop sequences require closer attention to increase the performance of current farming systems. This also demonstrates that while benchmarks such as crop water-use-efficiency are useful for assessing individual crop performance, it is important that the efficiency of the farming system is evaluated over the full sequence of crops rather than only for individual crops.
In order to explore the potential areas of underperformance of current farming systems in this paper we report on a multi-dimensional analysis comparing a range of common and some alternative crop sequences in southern Queensland at two locations, in the Dalby and Goondiwindi districts. These crop sequences are assessed against multiple objectives including their relative profitability, riskiness, productivity, water-use-efficiency, fertiliser input use and efficiency and risks for multiplication of nematodes, herbicide resistance and soil carbon depletion. Through this analysis we aim to identify areas where current crop sequences are underperforming, quantify some future threats and suggest some changes that could bring about improvements in system efficiency.
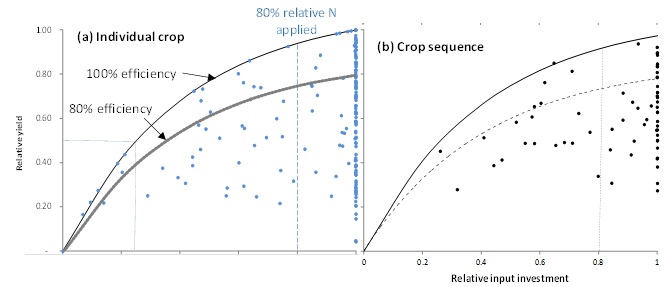
Figure 1: Relative performance of individual crop (n=193) (a) and crop sequence (n=68) (b) from surveyed farm crop performance data relative to fertiliser input investment compared to simulated water-limited potential in southern Qld and northern NSW (Source: Hochman et al. 2014).
Methods
A list of the dominant crop sequences applied by growers in each district of the northern region was obtained from focus group meetings with leading farmers and advisers throughout the northern grain production region. Using historical climate data for Dalby and Goondiwindi long-term simulations (110 years) of these cropping sequences were conducted in APSIM, a farming systems model which predicts the production of crops and captures the dynamics of water and nutrients in the farming system. These simulations used rules which ensured each crop in the sequence was sown if a sowing opportunity occurred in their sowing window or at the end of the recommended sowing window, even when moisture levels were marginal. All cereal crops were fertilised to ensure 200 kg of N was available at sowing and legumes were not fertilised. All sequences simulated are based on a no-till system with full stubble retention using a common good cropping soil in each district (i.e. Goondiwindi - 190 mm plant available water capacity (PAWC) for wheat, Dalby - 290 mm PAWC for wheat). Simulations of crop production do not take into consideration losses due to waterlogging, disease, pests, weeds or crop nutrition other than nitrogen.
Nematode (P. thornei) risk factor was calculated based on the calculation that each susceptible crop increased populations by 2.5 times, moderately susceptible crops by 1.8 times and resistant crops and each 6 month of fallow reduced the population by 50 per cent. Soil carbon changes were calculated relative to the wheat (W)-W-chickpea (Ch)- rotation, due to differences in soil carbon levels between the two locations.
Gross margin (GM) analysis was conducted over each of these sequences using the equation shown in Figure 2. The baseline variable cost for each crop included in-crop pesticide applications, planting and harvesting costs but did not include inputs of N fertiliser and fallow spray frequency as these varied amongst the crop sequences. Long-term average grain prices and current variable input costs were used.
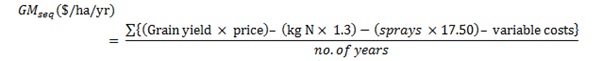
Figure 2: Equation used to calculate the gross margin.
Table 1: Assumptions of crop prices and variable costs used in gross margin calculations for crop sequences.
| Crop |
Average Price ($/t) (after transport) |
Variable costs ($/ha) |
|---|---|---|
| Wheat | 240 | 287 |
| Sorghum | 165 | 286 |
| Chickpea | 540 |
390 |
| Faba beans |
290 |
426 |
| Mung bean |
710 |
488 |
Results
Tables 2 and 3 compare a range of performance metrics for common and some alternative crop sequences in the Dalby (Table 2) and Goondiwindi (Table 3) districts. The crop sequences are based on pillar crops of wheat (W), sorghum (S) and chickpea (Ch) and vary in the proportion of summer crop in the sequence. Two alternative sequences include the addition of mungbean (Mg) and fababean (Fb). Please note we have excluded dryland cotton from these analyses so far (these may be included at a later date).
System water- and nutrient-use-efficiency
The systems with a crop intensity of one crop per year to 0.75 crops per year, result in percentage of time in fallow of 60-65 per cent to greater than 75 per cent, respectively. The higher intensity (MgW-SCh) has a crop intensity of 1.33 crops per year and reduces the time in fallow to 55 per cent. Systems with higher crop intensity increased the proportion of rainfall that was used by the crop and reduced losses to run off and drainage. However the higher intensity system did not increase grain production or water-use-efficiency compared to the best of the other sequences. The higher crop intensity system also had higher frequency of low yielding crops, owing to the frequent double crops in the sequence – this was particularly evident at Goondiwindi but this risk was lower at Dalby.
The sequences with increased frequency of summer crops had higher water use efficiency (WUE) and grain production at Dalby but not at Goondiwindi. At Dalby, systems that had 50 per cent summer crop had 25 per cent higher WUE per mm of rain than systems more winter focussed.
Most sequences demonstrated a net export of N in the order of 25-40kgN/yr, with the exception of the S-SCh-W- - system; this was due to higher external inputs. There was a 30-35 per cent deviation in nutrient-use-efficiency amongst the systems with the highest achieved in the S- -Ch-W- - system. The inputs of legume N were negligible or low in all the sequences analysed here. These were higher at Dalby due to the higher crop biomass production and when legumes were greater than one crop in three years.
System profitability and risk
At both locations the winter crop-only system had the highest average sequence GM; note this does not account for losses due to disease or pest incidence, and hence probably over-estimates the productivity of this system. The next most profitable sequences at each locations differed. At Goondiwindi, sequences with higher frequency of sorghum had lower profitability based on the price and input assumption and the necessity of a proceeding long-fallow. Systems with a higher crop frequency and double crops were more risky with higher variability and lower average GM in the poorest 20 per cent of years. At Dalby, the sequences with double crops were also more risky but this was less pronounced than at Goondiwindi. The average GM of the Mg-SCh-W system was only $55/ha/year behind the W-W-Ch system. The long-term distributions of predicted GM returns for each sequence are presented in Figure 3.
Table 2: Performance of crop sequences in the Dalby district.
| Performance metrics |
W-W-Ch- | S-SCh-W- - | S-S-SFb-W-Ch-W- - | S- -Ch-W-Ch-W- - | S- -W-Ch-W- - | S- -Ch-W- - | Mg-SCh-W |
|---|---|---|---|---|---|---|---|
| Fallow/crop frequency |
|||||||
| Crop intensity (#/yr) | 1.0 |
1.0 |
1.0 |
0.83 |
0.80 |
0.75 | 1.33 |
| % time in fallow |
60 |
64 |
63 | 68 |
69 | - | 55 |
| Summer | 60 | 29 | 34 | 51 | 49 | - | 23 |
| Winter | 0 | 35 | 29 | 17 | 20 | - | 32 |
| Fallow rain (average) |
432 | 369 | 377 | 443 | 447 | - | 316 |
| In-crop rain (average) | 210 | 273 | 259 | 196 | 193 | - | 325 |
| Production | |||||||
| Grain yield (t/ha/yr) |
3.63 |
4.55 |
4.51 |
3.35 |
3.62 | 3.17 |
4.33 |
| Grain protein (t/ha/yr) | 0.67 | 0.66 | 0.73 | 0.58 | 0.59 | 0.52 | 0.73 |
| Profitability & risk |
|||||||
| Gross margin ($/ha/yr) | 1159 | 903 | 859 | 1034 | 892 | 990 | 1104 |
| % variation in GM | 25 | 30 | 23 | 19 | 18 | 22 | 36 |
| GM (worst) ($/ha/yr) | 740 | 515 | 631 | 760 | 651 | 991 | 565 |
| GM (best) ($/ha/yr) | 1544 | 1265 | 1194 | 1288 | 1083 | 1243 | 1630 |
| Crop failures (%) |
3 | 7 | 6 | 3 | 2 | - | 9 |
| Sorghum (<2.0 t/ha) | - | 4 | 4 | 2 | 2 | - | 7 |
| Wheat (<1.5 t/ha) | 4 | 8 | 6 | 6 | 2 | - | 9 |
| Chickpea (<1 t/ha) | 1 | 10 | 1 | 1 | 1 | - | 12 |
| Mung bean (<0.8 t/ha) | - | - | - | - | - | - | 8 |
| Faba bean (<1.5 t/ha) | - | - | 17 | - | - | - | - |
| Water-use-efficiency | |||||||
| Grain (kg/mm rain) | 5.7 | 7.1 | 7.1 | 5.3 | 5.7 | 5.0 | 6.8 |
| Grain protein (kg/mm rain) | 0.168 | 0.164 | 0.184 | 0.144 | 0.147 | 0.129 | 0.183 |
| Fallow efficiency | 0.37 | 0.33 | 0.34 | 0.30 | 0.31 | 0.25 | 0.33 |
| % rain transpired | 39.1 | 37.2 | 37.7 | 33.0 | 33.5 | 32.1 | 41.1 |
| Crop WUE (kg grain/mm) | 14.5 | 19.1 | 18.9 | 15.9 | 16.9 | 15.4 | 16.4 |
| Drainage + runoff (mm/yr) | 83 | 77 | 73 | 100 | 109 | 107 | 57 |
| N input & efficiency | |||||||
| N applied (kg N/ha) |
74 | 90 | 76 | 61 | 69 | 49 | 77 |
| N export (kg N/ha/yr) | 108 | 105 | 117 | 92 | 94 | 83 | 117 |
| NUE (kg grain/kg N applied) | 49 | 51 | 60 | 55 | 52 | 65 | 56 |
| Legume N input/yr | 20.4 | 9.6 | 9.5 | 14.7 | 17.6 | 8.3 | 22.9 |
| Weed management | |||||||
| Fallow sprays/yr | 4.3 | 3.9 | 4.0 | 4.5 | 3.8 | 4.1 | 3.3 |
| Soil health impacts | |||||||
| P. thornei risk factor | 5.3 | 1.3 | 3.6 | 4.6 | 3.3 | 1.3 | 4.6 |
| Relative soil carbon change |
0 | -13 | +2 | -47 | -42 | -39 | +16 |
| Performance metrics |
W-W-Ch- | S-SCh-W- - | S-S-SFb-W-Ch-W- - | S- -Ch-W-Ch-W- - | S- -W-Ch-W- - | S- -Ch-W- - | Mg-SCh-W |
|---|---|---|---|---|---|---|---|
| Fallow/crop frequency |
|||||||
| Crop intensity (#/yr) | 1.0 | 1.0 | 0.83 | 0.80 | 0.75 | 0.75 | 1.33 |
| % time in fallow |
61 | 65 | 69 | 70 | - | - | 56 |
| Summer | 61 | 29 | 51 | 49 | - | - | 24 |
| Winter | 0 | 36 | 18 | 21 | - | - | 32 |
| Fallow rain (average) |
376 | 338 | 390 | 393 | - | - | 291 |
| In-crop rain (average) | 177 | 216 | 161 | 159 | - | - | 263 |
| Production | |||||||
| Grain yield (t/ha/yr) |
2.17 | 2.66 | 2.08 | 2.18 | 2.35 | 2.35 | 2.61 |
| Grain protein (kg/ha/yr) | 0.42 | 0.44 | 0.38 | 0.39 | 0.41 | 0.41 | 0.49 |
| Profitability & risk |
|||||||
| Gross margin ($/ha/yr) | 558 | 329 | 507 | 410 | 220 | 549 | 469 |
| % variation in GM | 62 | 76 | 41 | 47 | 85 | 53 | 79 |
| GM (worst) ($/ha/yr) | 132 | 21 | 211 | 133 | 5 | 155 | 48 |
| GM (best) ($/ha/yr) | 1041 | 708 | 794 | 668 | 501 | 959 | 1016 |
| Crop failures (%) |
13 | 19 | 10 | 9 | - | - | 21 |
| Sorghum (<1.5 t/ha) |
- | 12 | 7 | 7 | - | - | 12 |
| Wheat (<1.0 t/ha) |
13 | 14 | 12 | 9 | - | - | 11 |
| Chickpea (<0.75 t/ha) |
12 | 37 | 10 | 10 | - | - | 30 |
| Mungbean (<0.5 t/ha) |
- | - | - | - | - | - | 33 |
| Water-use-efficiency | |||||||
| Grain (kg/mm rain) | 3.92 | 4.82 | 3.78 | 3.96 | 4.25 | 4.25 | 4.71 |
| Grain protein (kg/mm rain) | 0.122 | 0.128 | 0.112 | 0.112 | 0.119 | 0.119 | 0.140 |
| Fallow efficiency | 0.25 | 0.25 | 0.22 | 0.22 | 0.22 | 0.22 | 0.25 |
| % rain transpired | 0.29 | 0.28 | 0.25 | 0.26 | 0.27 | 0.27 | 0.31 |
| Crop WUE (kg grain/mm) | 13.5 | 17.0 | 14.9 | 15.5 | 15.5 | 15.6 | 15.1 |
| Drainage + runoff (mm/yr) | 52 | 52 | 64 | 66 | 58 | 58 | 38 |
| N input & efficiency | |||||||
| N applied (kg N/ha) |
36 | 49 | 34 | 37 | 36 | 32 | 39 |
| N export (kg N/ha/yr) | 67 | 71 | 61 | 62 | 66 | 66 | 78 |
| NUE (kg grain/kg N applied) | 60 | 55 | 61 | 58 | 66 | 74 | 67 |
| Legume N input/yr | 4 | 4 | 0 | 3 | 0 | 0 | 11 |
| Herbicide spray | |||||||
| Fallow sprays/yr | 3.8 | 3.6 | 4.0 | 3.3 | 3.6 | 3.6 | 3.1 |
| Soil health impacts | |||||||
| P. thornei risk factor | 5.3 | 1.3 | 4.6 | 3.3 | 2.0 | 1.3 | 4.6 |
| Relative soil carbon change (kg/ha/yr) |
0 | -7 | -46 | -45 | -431 | -432 | +46 |
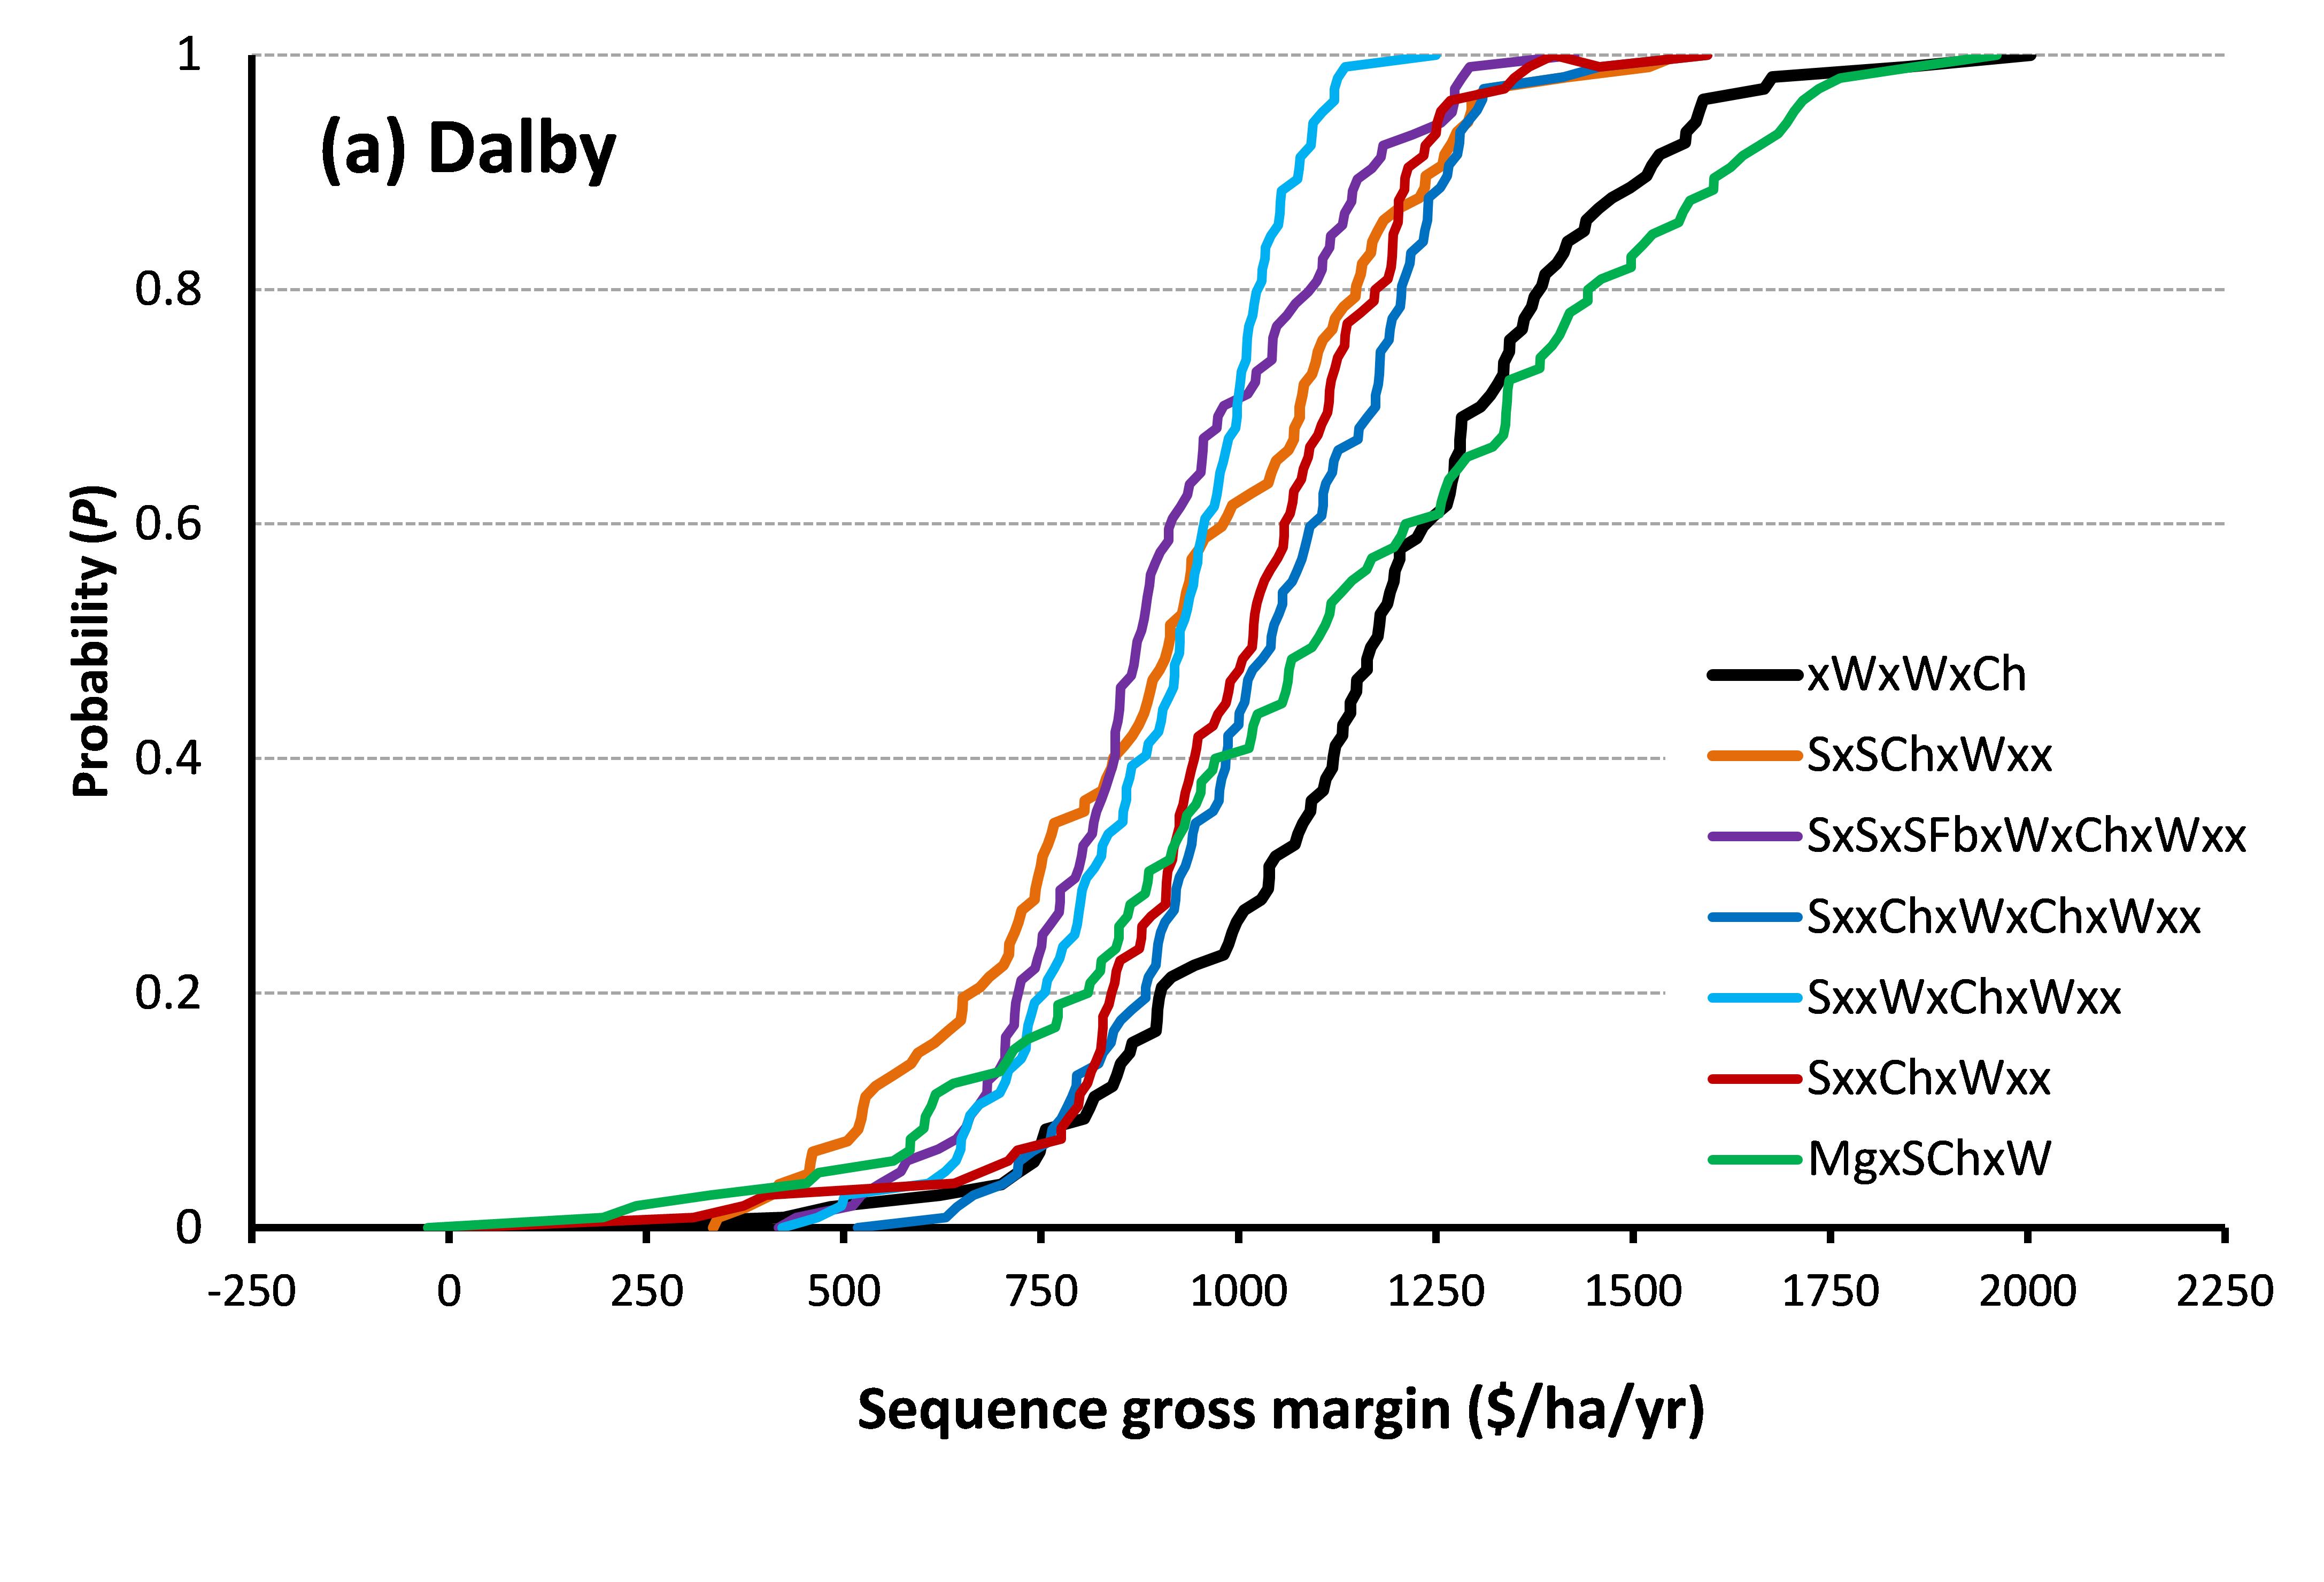
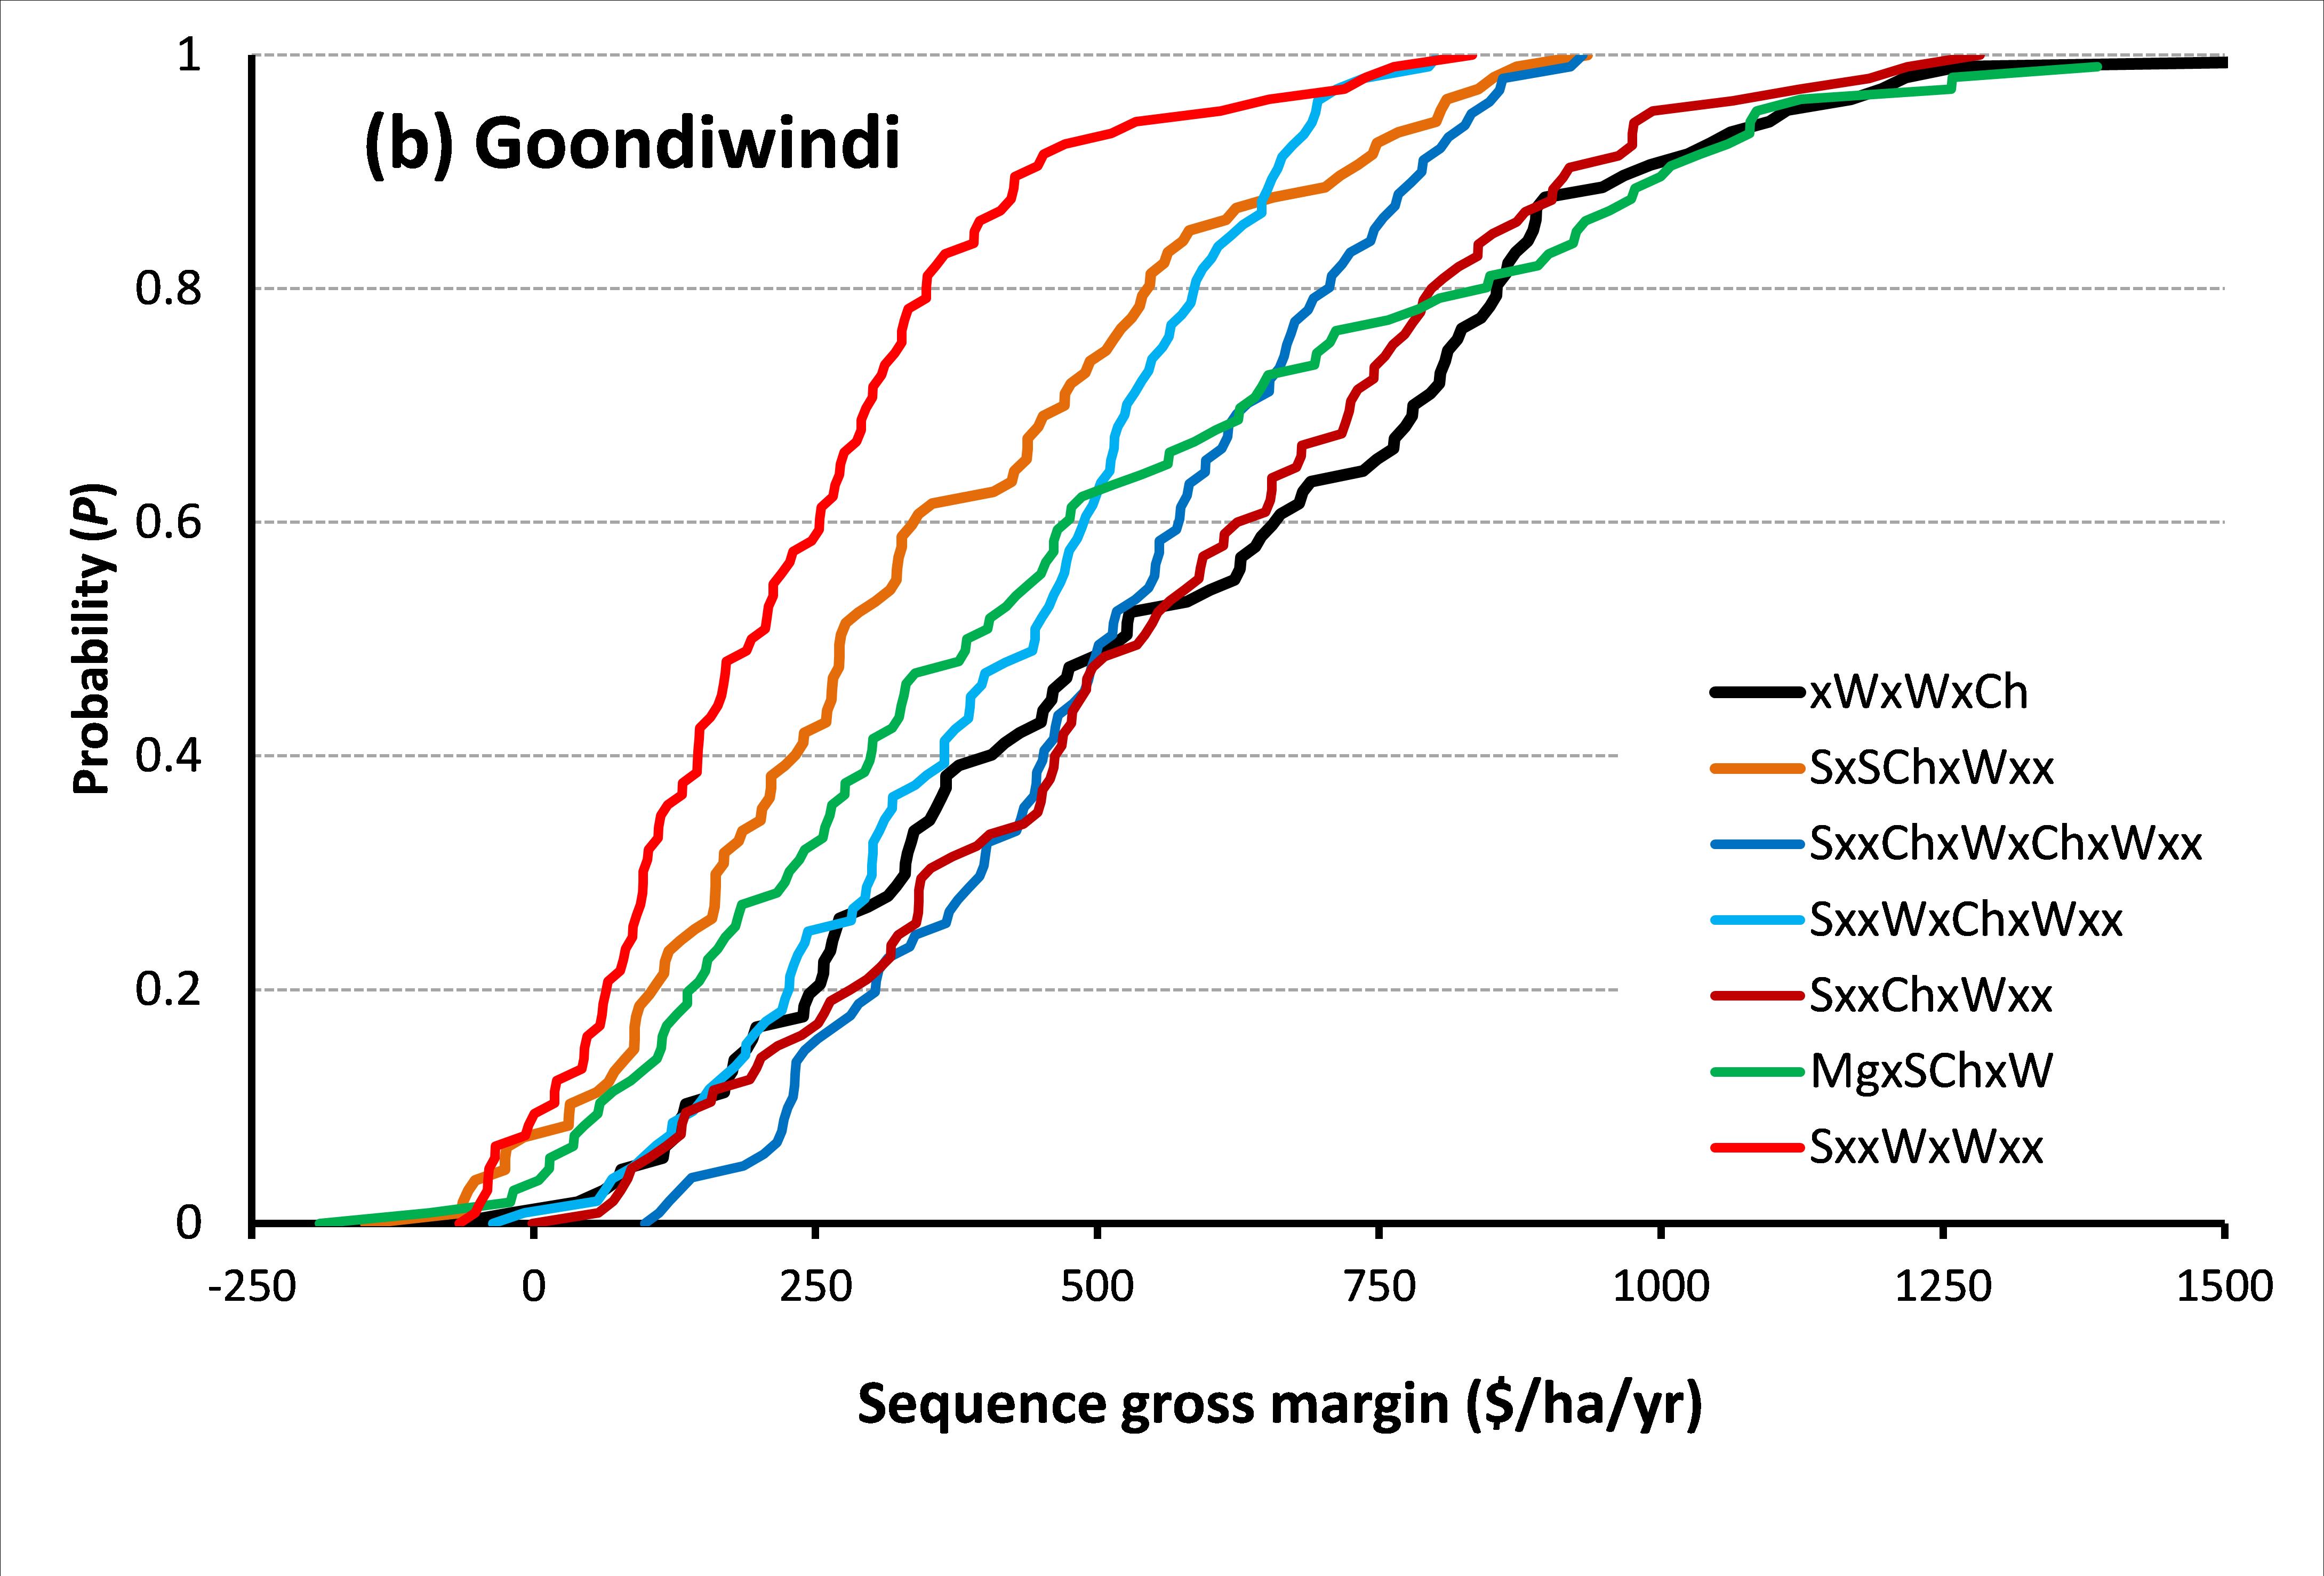
Figure 3: Cumulative probability of crop sequence gross margin at Dalby (a) and Goondiwindi (b) over the long-term.
System sustainability
Crop intensity system also had an impact on soil carbon with the higher crop intensity being able to maintain higher soil carbon and lower crop intensity with long fallows depleting soil carbon more rapidly.
Most crop sequences based on wheat and chickpea as winter crops are at risk of magnifying root lesion nematodes while those with less than two crops susceptible to root lesion nematodes over four years (e.g. S-SCh-W-, S- -Ch-W- -) were the only ones that had the lowest risk of magnifying these pathogen populations.
Conclusions
This analysis suggests that there is some capacity to improve the performance of some attributes of the farming systems utilising only the pillar crops. There are however, significant trade-offs between systems that maximise profitability and those that make most efficient use of resources and maintain system productive capacity into the future. Further analysis is required to investigate rules when tactical use of double crops can enable improvements in rainfall capture and utilisation while managing risk. The performance of individual crops within these sequences and alternative sequences that employ alternative crops are also required. The effects of weeds and pathogens on crop productivity within different cropping systems will be captured in the future to see how this might alter the relative performance of these crop sequences.
References
Hochman Z, Prestwidge D, Carberry PS (2014) Crop sequences in Australia’s northern grain zone are less agronomically efficient than the sum of their parts. Agricultural Systems 129, 124-132.
Acknowledgements
The research reported here was undertaken in CSA00050 (Northern Farming Systems Initiative) with GRDC funding in collaboration with CSIRO, Department of Agriculture and Fisheries, Queensland and the University of Queensland.
Contact details
Lindsay Bell
lindsay.bell@csiro.au
GRDC Project Code: CSP1406-007RTX,
Was this page helpful?
YOUR FEEDBACK