If that was an El Niño, we’ll take it
Author: Dale Grey | Date: 16 Feb 2016
Background
El Niño conjures up many different images for many people, often erroneous and based solely on media sensationalism. Like in the X Files, “the truth is out there,” and fits somewhere between “catastrophic drought” and “it’s irrelevant to NSW as it’s a Queensland (Qld) thing”.
The first hints of an El Niño in 2015 came in January, and by February the majority of global seasonal forecast models were predicting an El Niño to form (Table 1). At this early stage, where the models have poor skill, there were almost no predictions of drier conditions for the winter-spring. People making decisions for a poor season on this information were worrying me because of the unreliability of prediction at this time of the year.
Table 1: Modelled climate and ocean predictions February 17, 2015.
| Coupled GCM's | Ensembles | Statistical | |||||||||
|---|---|---|---|---|---|---|---|---|---|---|---|
| System 4 ECMWF Europe | POAMA2 BoM Australia | SINTEX JAMSTEC Japan | CFSv2 NCEP USA | GEOs-5 NASA USA | BCC CGMCM1.0 China | UKMO UK GlosSea5 | IRI USA | APCC Korea | SOI phase QDNRM Australia | ESS AEGIC Australia | |
| Month of Run | Feb | Feb | Feb | Feb | Feb | Feb | Feb | Feb | Feb | Feb | Jan |
| Forecast months | MAM | MAM | MAM | MAM | MAM | MAM | MAM | MAM | MAM | MAM | MAM |
| Autumn Pacific Ocean NINO3.4 | Warm (El Nino Modoki) | Slightly warmer | Warm (weak El Nino Modoki) | Warm (El Nino Modoki) | Warm (El Nino) | Warm (weak El Nino Modoki) | Slightly warmer | Slightly warm | NA | ||
| Autumn Eastern Indian Ocean | Neutral | Neutral | Slightly warm | Slightly warm | Slightly warm | Slightly warm | Neutral | Neutral | |||
| Forecast months | JJA | MJJ | JJA | JJA | JJA | JJA | MJJ | JJA | JJA | JJA | |
| Winter Pacific Ocean NINO3.4 | Warm (El Nino Modoki) | Warm (El Nino Modoki) | Warm (El Nino Modoki) | Warm (El Nino Modoki) | Warm (El Nino) | Slightly warm | Warm (El Nino Modoki) | Warm (El Nino Modoki) | NA | ||
| Winter Eastern Indian Ocean | Neutral | Neutral | Neutral | Slightly warm | Slightly warm | Slightly warm | Neutral | Neutral | |||
The greatest predictability of the effect on an El Niño occurs in spring, specifically August to October rainfall in most parts of southeast Australia. Summer rainfall is not effected anywhere near the same extent. The following pie charts show the tercile (thirds) distribution of spring and summer rainfall during previous El Niño years for various NSW locations. The wettest third of records is denoted by tercile 3 (blue), the middle third of records tercile 2 (yellow) and the driest third of years, tercile 1 (red).
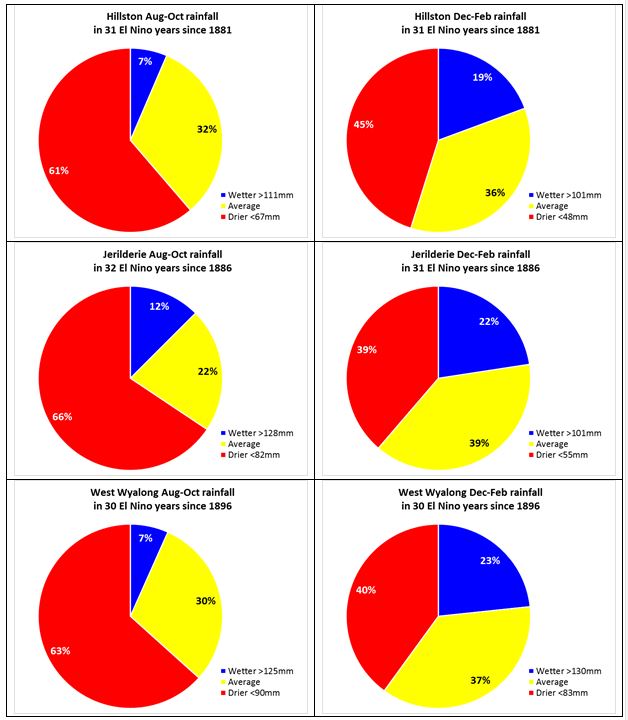
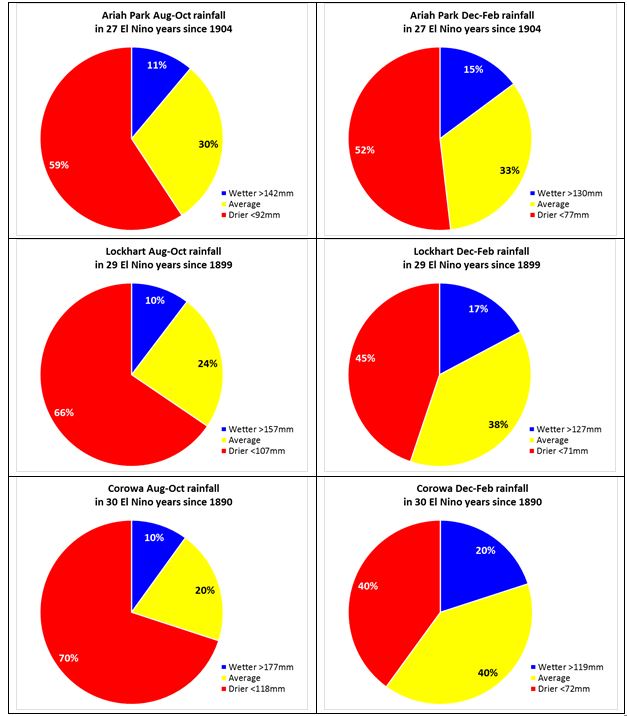
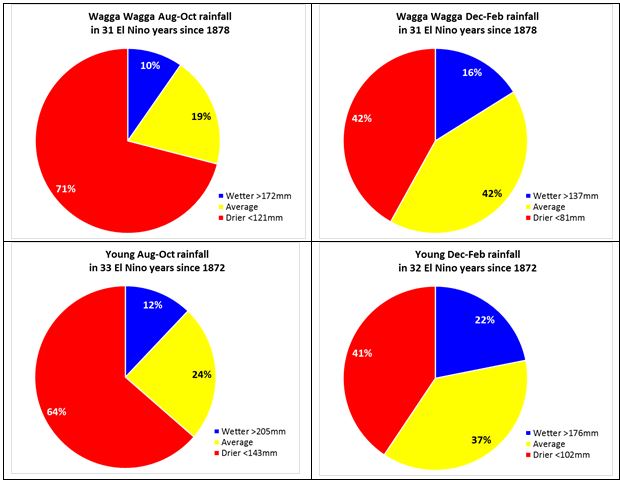
Figure 1: Tercile probability of rainfall from previous El Niño springs and summers for eight locations across NSW.
The pie charts show that previous El Niño events have a very strong effect of influencing the rain to fall in the driest third of records in southern NSW. However this doesn’t remove the chance of average or high rainfall. The chance of an average or wetter springs is better than 25 per cent for all locations.
By the time April had arrived, the processes driving the formation of an El Niño had continued unabated and all models were convinced an event was possible as early as May. Still, there were no predictions of dryer conditions in southern NSW (Table 2).
Table 2: Seasonal forecast model predictions for the Pacific and Indian Ocean, rainfall and temperature in April 2015. Predictions for southern NSW.
| Coupled GCM's | Ensembles | Statistical | |||||||||
|---|---|---|---|---|---|---|---|---|---|---|---|
| System 4 ECMWF Europe | POAMA2 BoM Australia | SINTEX JAMSTEC Japan | CFSv2 NCEP USA | GEOS-5 NASA USA | BCC CGMCM1.0 China | UKMO UK GlosSea5 | IRI USA | APCC Korea | SOI phase QDNRM Australia | ESS AEGIC Australia | |
| Month of Run | Apr | Apr | Apr | Apr | Apr | Apr | Apr | Apr | Apr | Apr | May |
| Forecast months | MJJ | MJJ | JJA | MJJ | MJJ | MJJ | MJJ | MJJ | MJJ | MJJ | MJJ |
| Winter Pacific Ocean NINO3.4 | Warm (El Nino) | Warm (El Nino) | Warm (El Nino Modoki) | Warm (El Nino) |
Warm (El Nino) |
Warm (El Nino) |
Warm (El Nino) |
Warm (El Nino) |
Slightly warm | ||
| Winter Eastern Indian Ocean | Slightly warm | Slightly warm |
Slightly warm |
Slightly warm |
Slightly warm |
Warm (IOD-) | Slightly warm |
Slightly warm |
|||
| Winter rainfall |
Average |
Slightly wetter | Average |
Average |
Average |
Average |
Average |
Average |
Average |
Average |
Average |
| Winter Temperature | Slightly warmer? | Average E, slightly warmer W | Average | Average |
Slightly warmer | Average |
Average |
Slightly warmer |
Slightly warmer |
||
Predictions made in April (Table 2) were essentially average for NSW between May-July, with the exception of the Bureau of Meteorology’s (BoM’s) POAMA model which had a wetter signal. There were predictions for moisture over eastern Australia from a number of models, but there was no consensus as to where! These predictions proved right.
Two other factors were at play in dampening the impact of the El Niño in NSW. First, was record warmth in the Indian Ocean for much of the year. Greater surface temperatures above 24oC increased evaporation exponentially, meaning that if the right triggers occurred rainfall could happen. The second phenomena was a positive phase of the SAM over winter (Figure 2). The SAM effects frontal systems and drags them south of the Great Dividing Range when in the positive mode. Southern Victoria and Tasmania tend to be effected the most, but this dragging south of fronts tends to set up an anomalous easterly wind flow into southern NSW, which can increase winter rainfall while Victoria loses out.
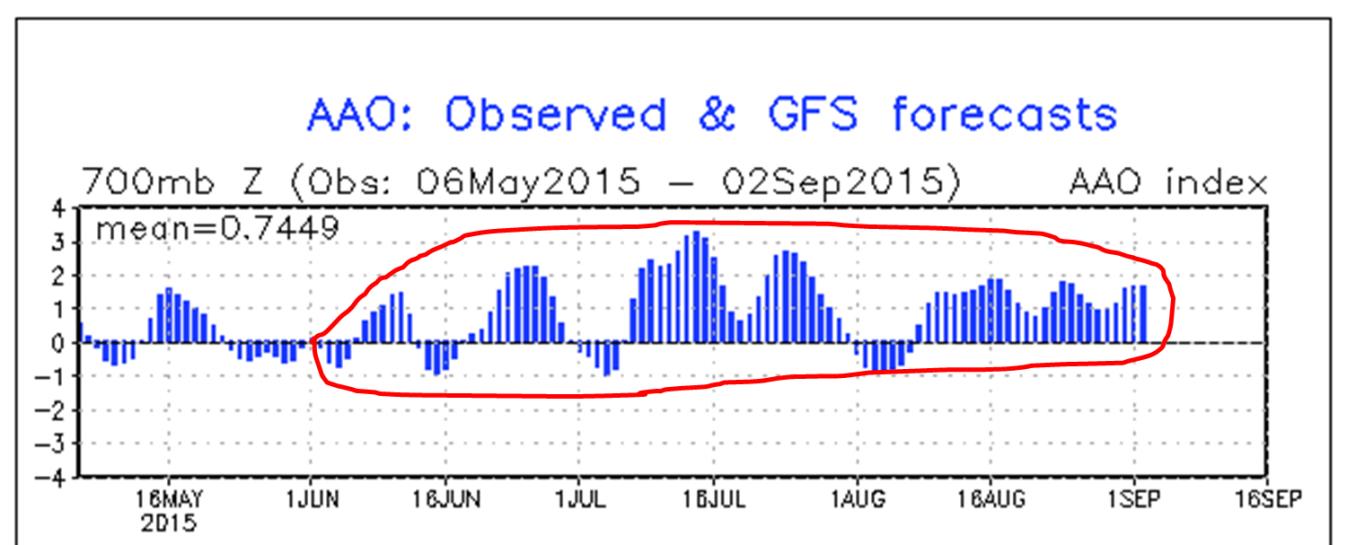
Figure 2: The Southern Annular Mode (SAM) over winter.
Once we got to the period of greatest model accuracy - the end of July looking forward to spring - there were no signs of wetter conditions and a few more signs concerning drier signals (Table 3). The stored summer rainfall meant there was an insurance policy once we got to September and the profiles were wet due to the good rains in June, July and August. The tap then turned off in a more traditional El Niño style and there was some extra spring heat. However, the wet profile was enough to get the crop home. Predictions of an Indian Ocean Dipole positive (drier phase) were also sniffing around, but so was the generally warmer Indian Ocean as a whole. Unlike western Victoria, which was being given curry by high pressure systems all year, southern NSW was more fortunate in the pressure strength and position stakes. Hence the year that happened.
Table 3: Model predictions for the Pacific and Indian Ocean rainfall and temperature in July 2015. Predictions for southern NSW.
| Coupled GCM's | Ensembles | Statistical | |||||||||
|---|---|---|---|---|---|---|---|---|---|---|---|
| System 4 ECMWF Europe | POAMA2 BoM Australia | SINTEX JAMSTEC Japan | CFSv2 NCEP USA | GEOS-5 NASA USA | BCC CGMCM1.0 China | UKMO UK GlosSea5 | IRI USA | APCC Korea | SOI phase QDNRM Australia | ESS AEGIC Australia | |
| Month of Run | July | July | July | July | July | July | July | July | July | July | July |
| Forecast months | ASO | ASO | SON | ASO | ASO | ASO | ASO | ASO | ASO | ASO | ASO |
| Spring Pacific Ocean NINO3.4 | Warm (El Nino) | Warm (El Nino Modoki) | Warm (El Nino) | Warm (El Nino) | Warm (El Nino) | Warm (El Nino) | Warm (El Nino) | Warm (El Nino) | Warm (El Nino) | ||
| Spring Eastern Indian Ocean | Slightly cooler (IOD+) | Neutral | Neutral (IOD+) | Neutral/Slightly warm | Slightly warm | Neutral/slightly warm | Neutral | Neutral | |||
| Spring Rainfall | Slightly drier? | Slightly drier | Slightly drier | Average | Average | Average | Average | Average | Average | Slightly drier | Slightly drier |
| Spring Temperature | Average? | Slightly warmer | Slightly warmer | Average | Slightly warmer | Average | Average | Warmer | Slightly warmer | ||
Now we are into 2016, the oceans to the north of us have further warmed, the Indian Ocean is still warmer and there is a bit of tropical moisture poking about, but it’s pretty random. Tropical processes in northern Australia have also greatly improved, so in my opinion the situation appears normal. The good news is that as of January 19 no model has a drier forecast for the next six months. Admittedly this is at a time where the models traditionally have the poorest performance. The European Centre for Medium-Range Weather Forecasts model even has a La Nina brewing, so here’s hoping 2016 is a bit more even across the board with its rainfall delivery. The BoM tell us that typically an El Niño year is followed by neutral conditions (50 per cent chance), La Nina (40 per cent chance), with another El Niño being the least likely (10 per cent chance).
Conclusion
For southern NSW, El Niño years typically increase the chance of a drier winter/spring, but doesn’t remove the chance of average or better rainfall. Looking at previous El Niño events, the chance of an average or wetter spring in NSW is better than 25 per cent for all locations. In 2015 the global seasonal forecast models had a good consensus that the autumn-winter period of 2015 wasn’t going to be dry. This turned out to be true for NSW . A warmer Indian Ocean, a SAM positive phase, and no pesky high pressure systems allowed some good rain events in NSW despite a developing El Niño. Model predictions were split between average and drier for spring, and the season turned out to be a bit of both - the rain and the dry - thanks to the vagaries of the Indian Ocean.
Contact details
Dale Grey
PO Box 3100
Bendigo DC, VIC 3554
03 54304444
dale.grey@ecodev.vic.gov.au
Dale Grey's Twitter
Was this page helpful?
YOUR FEEDBACK