Soil water, risk management and sowing decisions in the Liverpool Plains
Author: Daniel Rodriguez and Peter de Voil (University of Queensland/QAAFI) | Date: 02 Mar 2018
Call to action
- In sorghum, understanding how to match hybrids and management to site and expected seasonal conditions can increase yields by up to 60%.
- In environments yielding less than 5 t ha-1, the highest treatment yields were observed with low tillering hybrids sown in solid configurations, and plant populations between 50 and 60k pl ha-1.
- In environments yielding more than 5 t ha-1 plant density and the yield potential of the hybrid were the most important variables discriminating between low and high yields.
- When current growers’ practice was used as the baseline, information from linking APSIM sorghum and POAMA-2, could be used to increase average profits by 143 AU$ ha-1 and reduce or even eliminate down side risk. When the baseline for the comparison was a higher farmer investment strategy than normal practice, the actual value of the additional climate information was on average 17 AU$ ha-1, which compares to the benefits derived from Australia’s sorghum breeding over the last thirty years i.e. 2.1% per year, or 44 kg ha-1 year-1. Clearly the largest value of these tools is in informing risk aversion in dryland cropping. Though no tools are available for growers as yet in the northern grains region. This should be considered a priority.
In rainfed cereal crops, yield gain over time has been the result of improvements in hybrids (G), improvements in management (M), improvements in the cropping system (CS), and their interactions (GxMxCS). Future improvements in growers practice need to focus on informing GxMxCS combinations that best fit site and expected seasonal conditions that maximise profits and minimise risks.
In Australia’s northern grains region, climate variability presents growers with challenges, but also the opportunity to match hybrids and agronomy to match site, as well as prevailing and expected seasonal conditions. Water and nitrogen availability at planting together with expected in crop rainfall, all contribute to the final yield result. Some of these variables are known or could be known if measured before planting, others, e.g. seasonal climate forecasting, require specialised training packages for growers and advisers. Here we discuss growers’ opportunities to inform how to match hybrid and agronomy to site and seasonal conditions at the time of sowing.
Over the last three years results from UQ00074 and UQ00075 demonstrated that the largest opportunity to manage stresses, increase profits and reduce risks in rainfed cropping, is to inform optimum combinations of hybrids and management options for specific sites and expected seasonal conditions. This is shown in Figure 1, which summarises results from on farm and on research station trials (n=15) run between 2014 and 2017 from the Liverpool Plains to Central Queensland. Trials consisted of combinations of hybrid i.e. most commercial hybrids, plant density, and row configuration. The combined dataset from NSW and Qld included results from more than 1960 individual plots.
Figure 1 shows that, (i) average site sorghum yields (x axis) varied between almost zero to more than 6t ha-1 (dry basis) across sites (environments); (ii) for any given yield environment (x axis) the yield difference between the highest and lowest treatment yield (y axis) i.e. obtained from the best and worst combination of hybrid and management, was up to 60% (Fig 1a); and (iii) that the yield differences between the best and worst combination of hybrid and management translated into a six-fold change in water use efficiency, from 2 to more than 12 kg mm-1 ha-1 (Fig 1b).
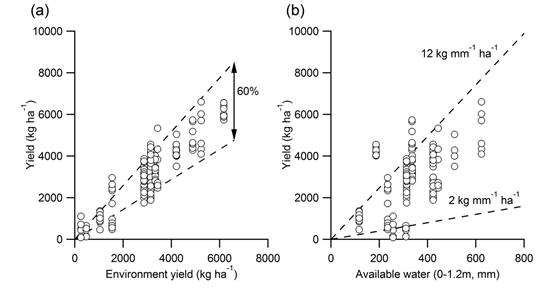 Figure 1. Treatment mean yield (y axis) versus environment yield (x axis) i.e. mean of site yield from all the treatments (a), and (b) relationship between treatment means and available water estimated as soil moisture at sowing (0-1.2m) plus in crop rainfall and added irrigation (if any).
Simple rules of thumb
The data in Figure 1 was further analysed to derive simple rules of thumb to help match hybrids and agronomy to expected yield environments. For the analysis, we only used data from sites that showed average yields larger than 2.5t ha-1. The combined data set then was reduced to 488 treatment means i.e. combinations of hybrids, row configurations, densities, sites and seasons. The median yield for the data set was 5.3 t ha-1 with minimum and maximum treatment yields of 1.7 (rainfed) and 7 t ha-1, respectively. Note that fully irrigated crops grown on research station trials at Gatton yielded over 12 t ha-1.
Simple rules were then derived for higher yielding environments (sites with average yield higher than 5.3 t/ha), and lower yielding environments (sites that yielded less than 5.3 t/ha). The results of the analysis are shown in Figure 2.
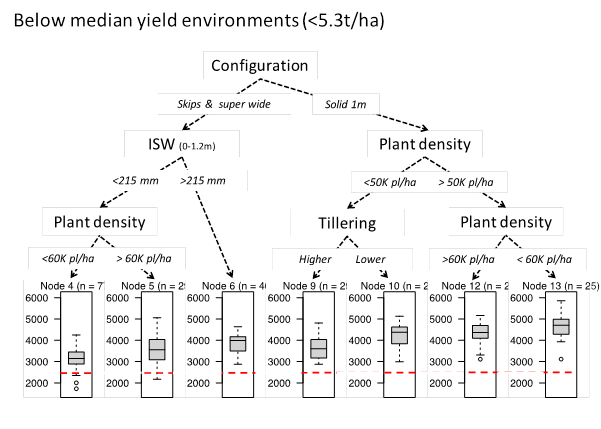
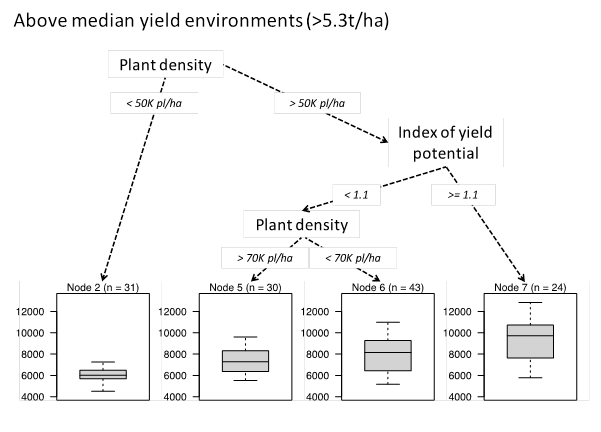 Figure 2. Simple rules of thumb from on-farm trials for below (top graph) and above (lower graph) median (5.3t/ha) yielding environments. The right-hand side of each graph shows the highest yielding hybrid and management combinations. While, the left-hand side of the graphs shows the lowest yielding combinations of hybrid and management for each environment. The dashed red line indicates a yield of 2.5t/ha. ISW = initial starting water (at sowing) as a % of PAWC; n = is the number of treatments included in each graph.
Figure 2 shows the higher yielding combinations of hybrid and management to the right, and the lower yielding to the left. For example, for the lower yielding environments (i.e. below 5.3t ha-1, top graph in Fig 2) the main variables separating low from high yielding treatments were row configuration, soil water at planting, plant density and hybrid tiller propensity. In these environments, the highest treatment yields were observed in solid configurations, and plant populations between 50 and 60k pl ha-1. Even though the small variability in tillering among the tested hybrids, the difference between higher and lower tillering hybrids was about 1t ha-1. This represented a yield increase from 3.5 using higher tillering to 4.5t ha-1 using lower tillering hybrids in dryer environments; and calls for low tillering or uniculm hybrids in dryer environments. The lowest yields were obtained with skip, double skip or super wide configurations and with less than 215mm of soil water at planting.
In the higher yielding environments (bottom graph in Fig 2) plant density and the yield potential of the hybrid were the most important variables discriminating between low and high yields. In these environments, the highest yields were observed with populations of more than 50k pl ha-1, on hybrids showing high values for an index of yield potential. No lodging was observed in any of our trials, although lodging has been reported for high yielding hybrids and plots. Causes of lodging in sorghum are not clear, though have been associated to terminal stresses, weak/thin stems, and high yield potential crops (large panicles). The lowest yields in high yielding environments were observed with plant populations below 50k pl ha-1.
Clearly our understanding of crop stress physiology indicates that in hindsight, optimum combinations of hybrid and management (for the past season) could be known. Obviously, our main problem is to predict relevant attributes of the season at the time of sowing, so that optimum GxM combinations could be informed. Even though contestable, outputs from seasonal climate forecasts and crop models could be used to inform optimum combinations of hybrids and management. I say contestable, because given the chaotic nature of the atmosphere, it is impossible to know exactly how it will evolve beyond a few days. Our only option is then to use probabilistic forecasts that give changes in the likelihood of the coming season to fall within a particular range of the historical climate records. A concept sometimes difficult to understand by those needing to inform “yes” or “no” type decisions, e.g. to plant or not to plant.
In our recent work we used seasonal climate forecast and crop models to test our capacity to answer Can we inform optimum GxM combinations in sorghum? Results showed that BOM’s POAMA-2 forecasts showed higher skill than the SOI phase system. Actually, the SOI phase system appears to have significantly degraded and shouldn’t be used anymore. We also found that the level of value in the skill of POAMA-2 depended on the baseline for the comparison: When current growers’ practice was used as the baseline, linking APSIM sorghum and POAMA-2 increased average profits by 143 AU$ ha-1 and reduced or even eliminated down side risk. When the baseline for the comparison was a higher investment strategy, the actual value of the additional climate information was on average 17 AU$ ha-1, which compares to the benefits derived from Australia’s sorghum breeding over the last thirty years i.e. 2.1% per year, or 44 kg ha-1 year-1.
These results indicate that even though the value of the additional climate information might seem small (ValueoptSCF, in Table 1), its magnitude compares well with that derived from much larger and better funded breeding programs e.g. sorghum. This also shows that much larger benefits (ValueoptS) could be realised when using this information in discussions with growers and advisers on benefits and risk from increasing investments in dryland cropping. Table 1 also answers the question ‘What would be the value of having a hypotetical perfect seasonal climate forecast?’ (ValuePK in Table 2). In Table 1, comparing Valueopts i.e. reflecting the value of present skill in forecasting, and ValuePK i.e. reflecting the value of a perfect forecast, shows that our present predictive capacity is about mid-way from what it could be if a perfect forecast would be available.
Table 1. Mean profits from a simulation using growers current practice and climatology (Growers), perfect knowledge (PK) i.e. optimized crop designs using climatology, optimized crop design using POAMA-2 (Optimised); and value i.e. mean changes in profit and down side risk i.e. likelihood of a profit lower than $600 ha-1 for, growers current practice (Valuef ). Optimized crop design using climatology 1981-2015 and (ValueoptS) and a POAMA-2 seasonal climate forecast (ValueoptSCF)).
Mean value to inform GxM with respect to a static management | |||||||||
|---|---|---|---|---|---|---|---|---|---|
Profit ($ ha-1) | Down Side Risk (%) | ||||||||
Location | Soil type (PAWC) | Growers | Optimized | ValueoptS | ValueoptSCF | ValuePK | Growers | Optimized | ValueoptS |
Capella | High | 1108 | 1260 | 152 | 3 | 335 | 0 | 0 | No risk |
Medium | 748 | 824 | 77 | 3 | 224 | 12 | 0 | -100 | |
Low | 544 | 600 | 56 | 4 | 219 | 68 | 62 | -9 | |
Dalby | High | 1127 | 1337 | 210 | 13 | 353 | 0 | 0 | No risk |
Medium | 1048 | 1241 | 194 | 17 | 351 | 0 | 0 | No risk | |
Low | 795 | 913 | 118 | 12 | 288 | 6 | 3 | -50 | |
Goondiwindi | High | 866 | 1092 | 226 | 16 | 432 | 6 | 0 | -100 |
Medium | 841 | 1011 | 170 | 63 | 345 | 3 | 0 | -100 | |
Low | 678 | 793 | 115 | 6 | 312 | 34 | 6 | -82 | |
Moree | High | 1025 | 1226 | 202 | 23 | 406 | 0 | 0 | No risk |
Medium | 814 | 962 | 148 | 32 | 370 | 9 | 0 | -100 | |
Low | 373 | 427 | 54 | 19 | 210 | 89 | 86 | -3.3 | |
ValueoptS = difference in profit ($ ha-1) and down side risk (DSR), between simulation of current growers’ hybrid by management combination (Valuef) and a static (every year the same) optimized hybrid by management combination.
ValueoptSCF = difference in profit ($ ha-1), between ValueoptS and the dynamically (every year different) optimized hybrid by management combination informed by the POAMA-2 seasonal climate forecasts.
ValuePK = Value of having perfect knowledge i.e. optimum crop design using observed climatology.
APSIM simulations for the Liverpool plains
Given the large number of possible combinations of hybrid and management available to growers, together with the large diversity in sites and seasonal conditions, it would be impossible and too costly, for any experimental program, to comprehensively run trials to cover all possible combinations. This is where well tested crop simulation models like APSIM are most useful. The Agricultural Production Systems sIMulator (APSIM) was developed in Australia, and is an internationally recognised as a highly advanced simulator of agricultural systems. APSIM contains a suite of modules which enable the simulation of systems that cover a range of plant, animal, soil, climate and management interactions. APSIM is undergoing continual development, with new capability added to regular releases of official versions. Its development and maintenance is underpinned by rigorous science and software engineering standards. A detailed description of APSIM sorghum is available from:
While results from model validation for a range of output variables e.g. biomass at flowering and maturity, leaf area at flowering, grain size, grain number and final yield are available from:
Here we used APSIM to answer the following questions:
- What is the effect of starting soil water compared to sowing on a particular date?
- Should we wait until the soil profile is full?
- How much can we rely on summer in-crop rain?
- What is the minimum plant available water at sowing to produce an economic yield
(3.5 t ha-1) sowing 50 – 70k plants ha-1?
To answer these questions, we ran APSIM-sorghum, for climate and soils of Quirindi, Mullaley, Spring Ridge and Caroona in New South Wales (only Quirindi is shown here). Soil characteristics are described in Table 2. The model was run for fortnightly sowings from the 15th of September to the 15th of December; parameterised for MR-Buster, MR-Scorpio, MR-Taurus, MR-Apollo and G33; with three different levels of N fertilisation 50, 100, 200 kg ha-1; four plant densities 3, 5, 7, and 9 pl m-2; and assuming four soil moisture conditions at the time of sowing, 30, 50, 70 and 100% full.
Simulated scenarios included running APSIM using long term climate records, i.e. observed rainfall (obs, in Figs. 3 and 4). To assess the value of soil moisture at sowing, we also modified the long climate records so that (i) there was no rain during the first 60 days after sowing (60 das, in Figs. 3 and 4); and (ii) no rain during the first 30 days after sowing (30 das, in Figs. 3 and 4). The idea of these scenarios was to quantify the significance of initial soil moisture on crop failures, yields and risks, to answer, What is the effect of starting soil water compared to sowing on a particular date? Here we just present results from the APSIM simulations at Quirindi, NSW with MR-Buster, at 7 pl m-2, fertilised with 200 kg N ha-1.
Figure 3 shows the likelihood of failed crops when sown fortnightly from 15 Sept to 15 Dec, on 30, 50, 70 and 100% of PAWC at sowing. Simulations are for the long-term climatology (blue), and assuming the case of no follow up rain for 30 and 60 days after sowing (red and green, respectively).
Table 2. Plant available water capacity and plant available water for sorghum
Location | Soil | PAWCsorghum (mm) |
|---|---|---|
Quirindi, NSW | Grey black Vertosol (Breeza, APSoil 123) | 264 |
Mullalley, NSW | Grey black Vertosol (Nombi, APSoil 1171) | 252 |
Spring Ridge, NSW | Brown Vertosol (Bundella, APSoil 1168) | 282 |
Caroona, NSW | Grey Vertosol (APSoil 1171) | 135 |
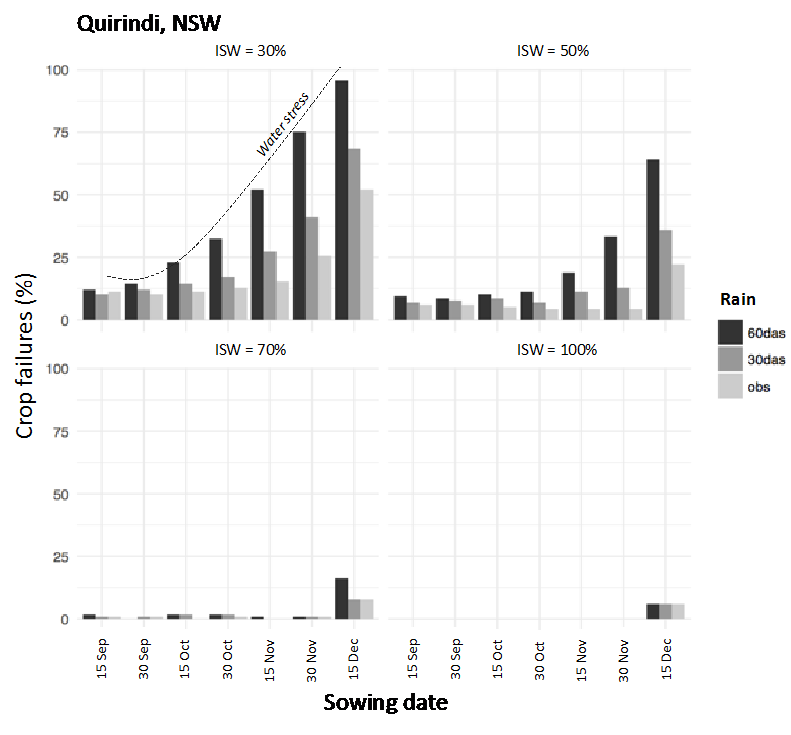 Figure 3. Likelihood of failed crops (MR-Buster, 7pl m-2, 200kg N ha-1), when sown fortnightly from 15 Sept to 15 Dec at Quirindi, NSW, on 30, 50, 70 and 100% of PAWC at sowing. Simulations are for the long-term climatology (light grey), and assuming no follow rain for 30 (grey) and 60 (dark grey) days after sowing. ISW = initial Starting Water (at sowing) as a % of PAWC.
Figure 3 shows that:
- Crop failures increased for the later sowings, particularly when followed by periods of 60 and 30 days of no rain after sowing. This is due to crops running out of water during periods of increasing temperatures and atmospheric demand. Sowing with more than ¾ full soil profiles prevent most of these losses, though yields are affected (see Figure 4).
- The increasing reliance on initial soil moisture with the later sowings is related to the fact that later sowings will grow during the hotter time of the year i.e. high atmospheric demand.
- It is important to note that there is increasing interest in the development of cold tolerance in sorghum cropping i.e. genetic + agronomic, which has shown yield, risk and cropping systems benefits in the Western Downs of Queensland. This is in response to increases in the frequency of heat stress and dry spells around flowering, our climate is not getting any colder!!.
- This year we planted a sorghum trial on the 5th of August at Warra Qld, with soil temperatures ca. 11oC. Even though five light frost before 6 leaves, the crop looked great, and was harvested on the week of the 8th of January, allowing a longer fallow into a double crop chickpea (talk to Wade Bidstrup, a farmer from Warra).
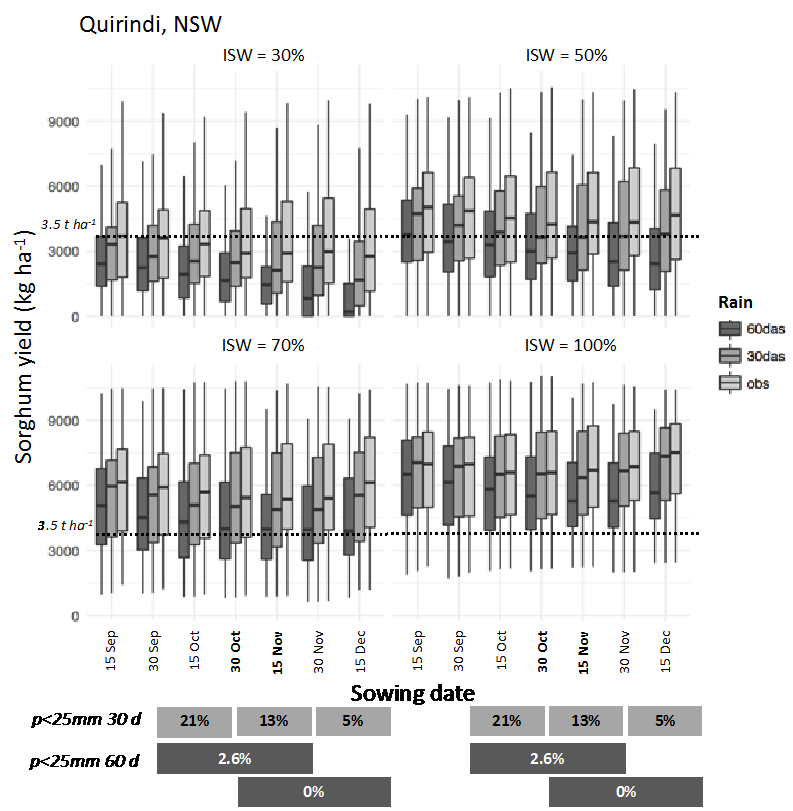
Figure 4. Box plots for simulated sorghum yields (MR-Buster, 7pl m-2, 200kg N ha-1), when sown fortnightly from 15 Sept to 15 December at Quirindi, NSW, on 30, 50, 70 and 100% of PAWC at sowing. Simulations are for the long-term climatology (light grey), and assuming no follow rain for 30 (grey) and 60 (dark grey) days after sowing. Dashed lines show a break even yields of 3.5 t ha-1 (p.c. B Manning). p<25mm 30 d and p<25mm 60 d indicate the likelihood of no significant rain (<25mm) after sowing for the next 30 (grey) and 60 (dark grey) days, for different planting windows. ISW = initial Starting Water (at sowing) as a % of PAWC
Figure 4 shows that:
- For Quirindi, irrespective of the planting time, there is around a 50% chance of economic yields if sowing on half full soils. Higher yields are more likely on early or late sowings.
- The likelihood of achieving economic yields dramatically increases with ¾ or full soil profiles, even if crops are followed by 30 or 60 day dry spells.
- The likelihood of dry spells after sowing is higher with the early planting at the end of September. The chance of a 30-day dry spell (defined as less than 25mm in 30 days), after a 30th Sep, is around 21%. This drops to 13% for sowings on the 30th of October, and down to 5% for sowings on 30th November.
- There is a 2.6% chance of a 60-day dry spell (defined as less than 25mm in 30 days) for plantings on the 30th of Sep, which drops zero for sowings on the 30th of Oct (Fig. 4).
APSIM simulations indicate that:
- What is the effect of starting soil water compared to sowing on a particular date? At Quirindi:
- Starting soil moisture has a larger impact on the likelihood of crop failures and achieving economic yields than changes in sowing time.
- The difference between sowing on 50 or 70% PAWC is that of gambling on a 50 – 50% chance of achieving an economic yield, versus a 75% likelihood.
- The impact of a dry spell is larger on later planted crops than on early planted crops.
- Should we wait until the soil profile is full? At Quirindi:
- Sowing early will minimise the likelihood of failed crops
- Sowing on at least 70% of PAWC in early or late plantings will maximise the likelihood of economic yields.
- How much can we rely on summer in-crop rain? At Quirindi:
- It is not just reliance on summer rainfall that should be growers’ worry, but we need to understand that summer rainfall will be less efficient to translate into crop yield. This is because the crop will use more water to produce the same yield as an earlier planted crop. In addition, something we haven’t investigated here, is the likelihood and yield of crops grown after an early or late planted sorghum.
- What is the minimum plant available water at sowing needed to produce an economic yield
(3.5 t ha-1) sowing 50 – 70k plants ha-1?
- The answer to this question is that it depends. It depends on whether we are talking about an early or a late planted crop.
Acknowledgements
The research undertaken as part of this project is made possible by the significant contributions of growers through both trial cooperation and the support of the GRDC, the author would like to thank them for their continued support.
We also acknowledge the collaboration from NSW DPI, Pacific Seeds, DuPont Pioneer, Radicle Seeds, Elders, the Bureau of Meteorology, and ACIAR
Contact details
A/Prof Daniel Rodriguez
UQ-QAAFI, The University of Queensland
203 Tor Street, Toowoomba, Qld
Mb: 0434 075 094
Email: d.rodriguez@uq.edu.au
Website: https://www.qld-fsr.info/
Twitter: @Queensland_FSR
Was this page helpful?
YOUR FEEDBACK
