Root-lesion nematode management the cost of getting it wrong
Author: Richard Daniel, Rachel Norton, Steven Simpfendorfer, Kirsty Owen and Jeremy Whish | Date: 25 Feb 2013
Richard Daniel1, Rachel Norton1, Steven Simpfendorfer2, Kirsty Owen3 and Jeremy Whish4
1Northern Grower Alliance, 2NSW DPI, 3DAFF QLD, 4CSIRO
Take home messages
- Wheat variety selection, based on Pratylenchus thornei (Pt) tolerance rankings, is a critical tool to reduce yield and economic loss when wheat is grown in the presence of Pt
- Size does matter. Increased populations of Pt significantly reduced yield and economic returns in Pt intolerant wheat varieties
- Pt reduced leaf area index, yield, grain quality and nitrogen recovery in wheat with significant impact in Pt intolerant varieties
- Wheat variety yields reduced by up to 59% (~1.8t/ha) between ‘low’ and ‘high’ Pt populations
- Crown rot severity increased under higher populations of Pt
- Economic cost of Pt in key wheat varieties was between ~$300-500/ha
- No apparent impact in canola
- No significant impact measured in faba beans
- Trend to reduced yield in chickpeas by ~15-20% (0.35-0.4t/ha), economic cost of ~$175-200/ha
The root-lesion nematode - Pratylenchus thornei (Pt), is one of the key ‘diseases’ affecting winter cereal production in the northern region. Pt is a major constraint due to: their large impact on yield when intolerant varieties are grown, broad geographic distribution with Pt populations frequently at above threshold levels and the susceptibility (Pt hosting) of key rotation crops such as chickpeas.
Successful Pt management will involve a range of practices including on-farm hygiene and soil testing to identify problem paddocks. However crop and variety choice are likely to be the major tools used for management. Wheat varieties are well characterised in terms of tolerance (yield impact suffered during the year of crop production) and resistance (impact from variety on the multiplication or build-up of Pt). Both characteristics are important for long term management.
This paper reports on trial work conducted in 2012 at a site near Yallaroi in northern NSW. The trials were designed to improve our understanding of the differences in tolerance between a range of winter crops and varieties followed by an assessment of the impact of these options on subsequent Pt densities (resistance). The approach used alternating strips of ‘low’ and ‘high’ Pt population which allowed evaluation of the impact of increased Pt numbers on variety performance.
Primary aims
- Evaluate the impact from Pratylenchus thornei (Pt ) on the yield and economic returns from a range of winter crops and varieties
- Examine the impact from different winter crops and varieties on the multiplication of Pt
Trial site preparation 2011
Soil testing was conducted from a paddock in the Yallaroi area where Pt had previously been found at above threshold levels (>2000 Pt/kg soil). Samples were analysed by the DNA method (PreDicta B) and showed a mean population of ~8,900 Pt/kg soil in samples taken from 0-15cm depth. Pratylenchus neglectus (another root-lesion nematode species) was not detected in any sample. The previous crop was chickpea.
The aim in 2011 was to create ‘strips’ of alternating Pt populations to allow multi-crop evaluation in 2012. Four commercial scale strips of either Sunvex![]() wheat or EGA Bellaroi
wheat or EGA Bellaroi![]() durum were planted in June 2011 with each strip ~200m long x 12 wide. Sunvex
durum were planted in June 2011 with each strip ~200m long x 12 wide. Sunvex![]() was used to maximise the increase in Pt population and EGA Bellaroi
was used to maximise the increase in Pt population and EGA Bellaroi![]() was selected to reduce the multiplication. Sunvex
was selected to reduce the multiplication. Sunvex![]() is rated as S (susceptible) and EGA Bellaroi
is rated as S (susceptible) and EGA Bellaroi![]() is rated as MR-MS (moderately resistant to moderately susceptible) for Pt resistance or multiplication. All eight strips were grown to maturity and harvested as per the surrounding commercial wheat crop.
is rated as MR-MS (moderately resistant to moderately susceptible) for Pt resistance or multiplication. All eight strips were grown to maturity and harvested as per the surrounding commercial wheat crop.
Differences in Pt populations
Figure 1 shows the Pt counts from detailed transects, sampled at 0-30cm in early February 2012. Three transects were sampled across all strips, at roughly 50m intervals, to examine Pt population uniformity. There was a highly significant difference in Pt counts between the two varieties with no significant difference in counts between transects or interaction between variety and transect. The Pt populations were relatively uniform across the site.
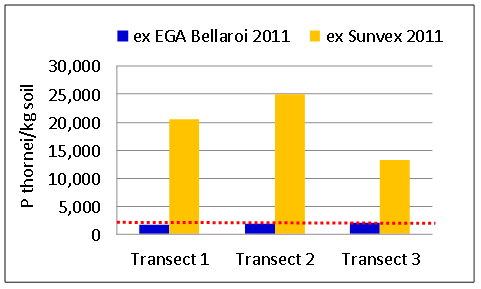
Figure 1: Back transformed means of DNA assay of Pt populations (February 2012)
The red dotted line indicates the industry guideline threshold of 2,000 Pt/kg soil, a population level that is likely to cause significant yield loss in intolerant wheat varieties.
Key points:
- DNA analysis showed the Sunvex
 (‘high’ Pt) strips had Pt populations ~10 times larger than those following EGA Bellaroi (‘low’ Pt) strips. This highlights the impact of one poor variety choice.
 - Importantly, the Pt population in the EGA Bellaroi (‘low’ Pt) strips were still at or close to the industry threshold of 2,000 Pt/kg soil.
Trial activity 2012
A total of 19 commercial varieties of four key crops were evaluated in individual split plot trials with a primary focus on measuring the direct nematode impact on yield and economic returns. In addition three crop nutrition trials were evaluated at this site together with a CSIRO trial aimed at generating data to enable modelling of nematode impacts in cereals. Seed size and % germination were assessed for all seed lots with sowing rates adjusted to plant an equivalent number of viable seeds for each crop. Urea was spread over all cereal trial areas at 195kg/ha on the 21/5/12 and incorporated by planting on the same day. All nematode focussed trials received DAP + Zinc at 80kg/ha at planting. Commercial crop protection products (and chipping) were used to manage weeds, foliar diseases and insect pressure.
There were four replicates in all trials. Plots were sown at ~12m length x 5 rows on 32cm row spacing. Strips sown to Sunvex![]() in 2011 were described as having ‘high’ Pt pressure and the strips sown to EGA Bellaroi
in 2011 were described as having ‘high’ Pt pressure and the strips sown to EGA Bellaroi![]() were described as having ‘low’ Pt pressure.
were described as having ‘low’ Pt pressure.
Individual trial details are shown in Table 1. Trials RH1208-10 were conducted as standard split plot trials comparing variety performance in the ‘low’ and ‘high’ Pt strips. In trial RH1213, all varieties were evaluated with and without additional crown rot inoculum (2g/m row) at sowing in an attempt to partition the impact from Pt and crown rot.
Table 1: Details of key individual nematode trials conducted in 2012
|
Trial # |
Crop |
Number of varieties |
Target plant stand/m2 |
Planting date |
Additional factor |
Harvest date |
|---|---|---|---|---|---|---|
|
RH1208 |
Canola |
4 |
25 |
9/05/2012 |
- |
8/11/12 |
|
RH1209 |
Faba bean |
3 |
20 |
- |
||
|
RH1210 |
Chickpea |
5 |
25 |
21/05/2012 |
- |
26/11/12 |
|
RH1213 |
Wheat |
7 |
90 |
Crown rot inoculum |
13/11/12 |
2012 season
The trial site was established on a full profile of soil moisture but only received ~60% of average in-crop rain (~156mm May-November inclusive). The trial experienced late season moisture stress with only ~32mm received during August-October. Crop yields were better than expected given the poor finishing conditions.
Crop establishment
Plant establishment was acceptable from both sowing dates. The majority of broadleaf varieties were close to their target plant stand with only the juncea canola (Xceed™ Oasis CL) having significantly lower plant stands than the comparison canola varieties (~7/m2 compared to ~22/m2). Mean wheat establishment was ~70/m2 compared to a target of 90/m2. There were significant differences in plant stand between wheat varieties but all varieties were within a range from ~60/m2 to ~90/m2.
NDVI and Leaf Area Index assessment
NDVI (Normalised Difference Vegetation Index) readings were taken on August 13 and September 27 using a handheld GreenSeeker. NDVI is an assessment of the reflectance of the crop or variety. Higher NDVI scores within the same variety usually indicate increased green leaf area which may also relate to biomass differences. The first NDVI reading was taken when the cereals were in early stem elongation and the second during head emergence. A leaf area index (LAI) assessment was conducted on all cereal plots using a ceptometer in late August. This measures light interception above and below the canopy. Results from both the NDVI assessment, conducted in mid-August, and the LAI assessment showed similar patterns between varieties and between Pt strips. LAI measurements were only taken in wheat plots. Table 2 summarises the significant differences.
Table 2: Patterns of significant differences in NDVI or LAI between ’low’ and ‘high’ Pt strips by crop
|
Trial # |
Crop |
NDVI 13/8/12 |
Leaf Area Index 27/8/12 |
NDVI 27/9/12 |
|---|---|---|---|---|
|
RH1208 |
Canola |
No |
- |
No |
|
RH1209 |
Faba bean |
No |
>
- |
No |
|
RH1210 |
Chickpea |
No |
- |
No |
|
RH1213 |
Wheat |
Yes |
Yes |
No |
The NDVI and LAI assessment in August both showed reduced leaf area and ‘greenness’ in the ‘high’ Pt strips. Strzelecki![]() (31% reduction) and Sunvex
(31% reduction) and Sunvex![]() (18% reduction) both recorded significantly reduced NDVI levels. There was a significant reduction in leaf area of ~26% in the ‘high’ Pt strips across all varieties in the LAI assessment with the largest levels of reduction in Strzelecki
(18% reduction) both recorded significantly reduced NDVI levels. There was a significant reduction in leaf area of ~26% in the ‘high’ Pt strips across all varieties in the LAI assessment with the largest levels of reduction in Strzelecki![]() (48% reduction) and Sunvex
(48% reduction) and Sunvex![]() (42% reduction).
(42% reduction).
Key points:
- NDVI and LAI readings were reduced when averaged across all wheat varieties in ‘high’ Pt strips during August but differences were not significant by the 27/9/12 (similar patterns in CSIRO trial)
- Level of impact greater in intolerant varieties eg Strzelecki and Sunvex
- No significant difference in NDVI readings within canola or faba bean varieties
Yield
The primary focus was the yield difference within each variety between ‘low’ and ‘high’ Pt strips. NB yield differences between varieties would be due to a very wide range of factors that included Pt tolerance/ intolerance.
The cereal trial showed the largest impact from the ‘high’ Pt strips. There was a significant overall reduction in yield between the ‘low’ and ‘high’ Pt strips but with clear differences in variety reaction (tolerance).
Canola appeared the most tolerant crop with no indication of any difference in yield between ‘low’ and ‘high’ Pt strips. There was also no consistent impact on yield in the faba bean varieties. The chickpea trials were the least uniform but there was a clear trend in both trials to yield losses of ~15-20% in the ‘high’ Pt strips.
Figures 2-5 show the variety yields in each individual trial.
Crop yields
NB varieties ranked in order of mean yield in the ‘high’ Pt strips
|
|
|
|
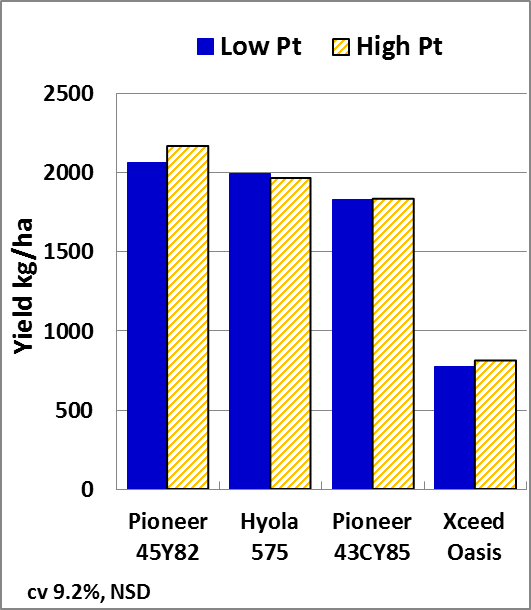
Figure 2: Canola yield (RH1208) |
Figure 3: Faba bean yield (RH1209) |
|
|
|
|
Figure 4: Chickpea yield (RH1210) |
|
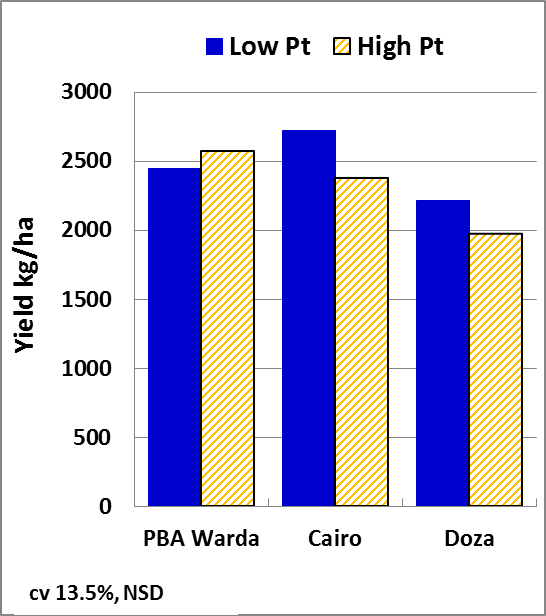
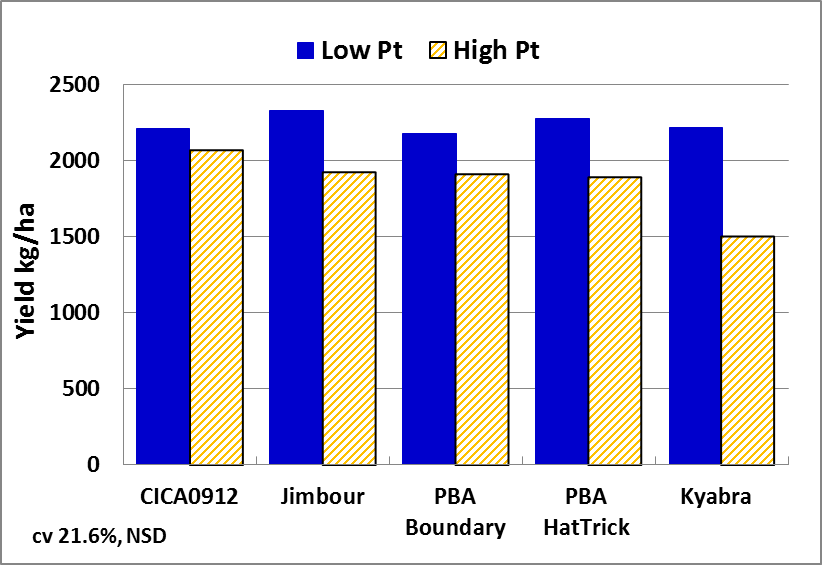
NB Trend to reduced yield in ‘high’ Pt strips across all chickpea varieties, significant at p=0.10
Similar trend apparent in PBA HatTrick![]() nutrition trial.
nutrition trial.
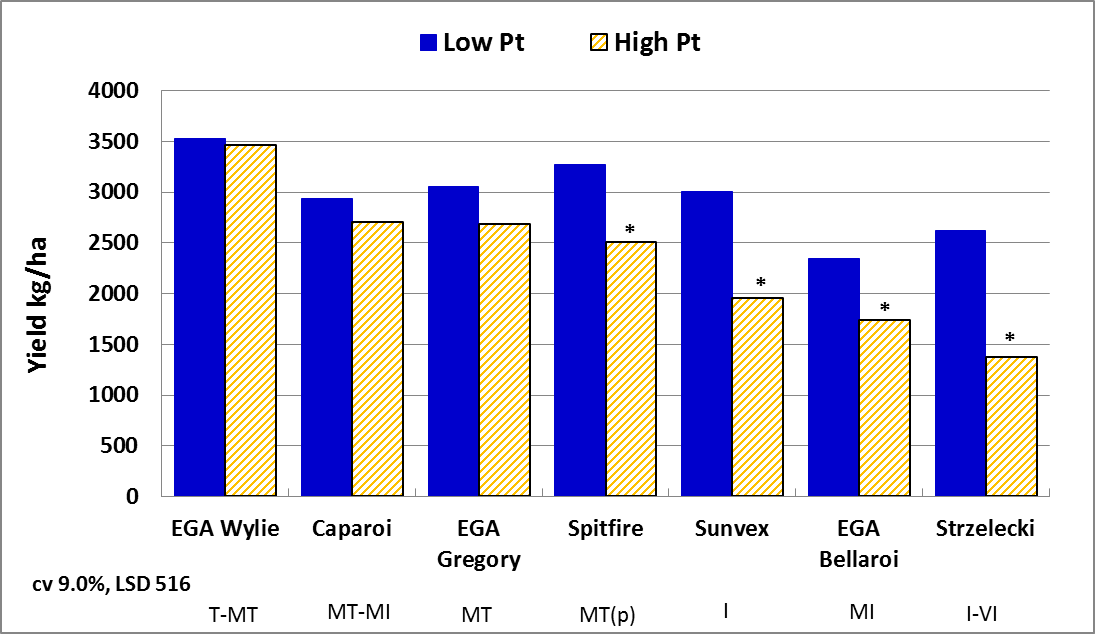
Figure 5: Wheat yield (RH1213)
* = significant yield difference in same variety between ‘low’ and ‘high’ Pt strips at p=0.05
Codes below variety names are the DAFF QLD published Pt tolerance rating; T=tolerant, MT=moderately tolerant, MI=moderately intolerant, VI=very intolerant , (p)=provisional, based on one trial
Key points:
- Wheat was the most intolerant crop with large varietal differences
- Pt intolerant wheat varieties recorded significant yield losses
- Clear trend to yield losses of 15-20% in chickpeas
- No indication of impact in canola and no clear yield impact in faba beans
Grain quality – canola
Test weight: averaged 64-65 kg/hL for all varieties with no indication of any impact from ‘high’ Pt strips.
Screenings: all varieties had screenings <1% with no indication of any impact from ‘high’ Pt strips.
Protein: no indication of any impact from Pt with canola protein levels ~21-23%.
Oil: no indication of any impact from Pt with canola oil levels ~45-46%. There was a significant increase in juncea canola oil content in the ‘high’ Pt strips.
Key point:
- Little indication of any impact from changing Pt population on canola grain quality
Grain quality - wheat
Test weight: Generally high - only Strzelecki![]() and EGA Bellaroi
and EGA Bellaroi![]() averaged less than 74 kg/hL.
averaged less than 74 kg/hL.
Screenings: Levels were low to moderate (all varieties in range from 2-9%). Significant increases in screenings in ‘high’ Pt strips for Strzelecki![]() (2.5% higher) and Spitfire
(2.5% higher) and Spitfire![]() (3% higher).
(3% higher).
Protein: Very low to low. Significant increase in protein in ‘high’ Pt strip for Strzelecki![]() and for all varieties in the CSIRO trial.
and for all varieties in the CSIRO trial.
Grain weight: Variety grain weights ranged from 30-38 g/ 1000 grains. Significant reductions in grain weight in ‘high’ Pt strips for Strzelecki![]() and Spitfire
and Spitfire![]() (~3-3.5 g/1000 grains lower).
(~3-3.5 g/1000 grains lower).
Key points:
- Increased screenings and reduced grain weight were the most affected quality trait
- Significant impacts however only seen in ‘less Pt tolerant’ varieties
- Bread wheat receival classification varied from ASW to GP due to low protein and increased screenings for some varieties
- All durum classification was FED1 due to a combination of low protein and/or low test weight
Total nitrogen recovery in wheat grain
Although absolute protein levels were increased for all wheat varieties in the ‘high’ Pt strips, differences in total nitrogen recovery were apparent. Total nitrogen recovery in grain was determined as yield x grain protein x 0.175. Total available nitrogen at the site was ~158 kg N/ha (~30kg N in early March soil test, 25 kg mineralisation credit, 90 kg N applied as Urea IBS and 13 kg N applied as Starter DAP). Figure 6 shows the nitrogen recovery patterns in the cereal trial.
Nitrogen use efficiency was calculated as the mean nitrogen recovery of the variety/ total available nitrogen. EGA Wylie![]() had the highest efficiency at ~37%, Strzelecki
had the highest efficiency at ~37%, Strzelecki![]() had the lowest efficiency at ~20%.
had the lowest efficiency at ~20%.
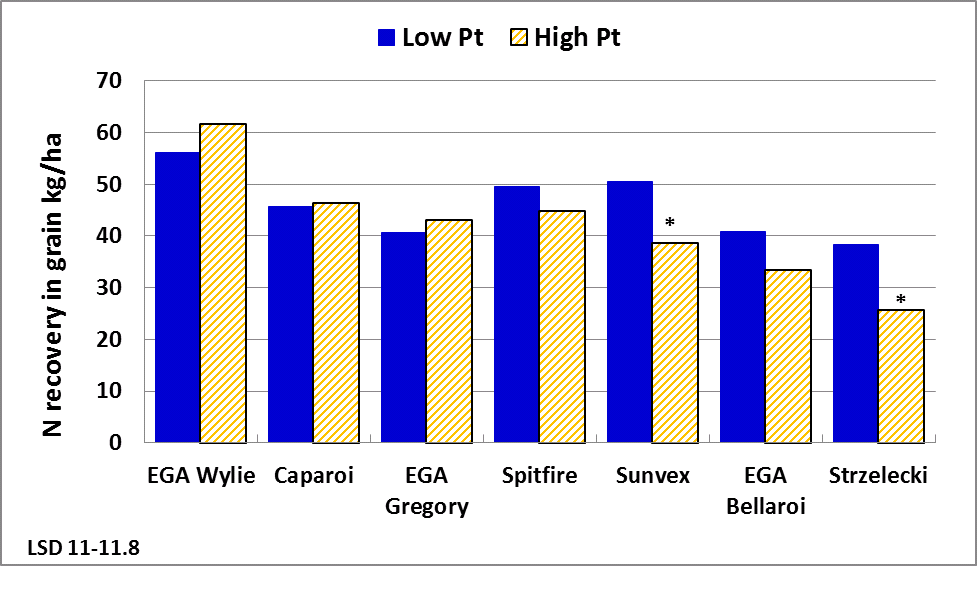
Figure 6: Wheat N recovery (RH1213)
* = significant difference in N recovery in same variety between ‘low’ and ‘high’ Pt strips at p=0.05
Key points:
- Total nitrogen recovery reduced in varieties ‘less tolerant’ to Pt
- Nitrogen recovery maintained in ‘tolerant’ varieties.
- Nitrogen use efficiency reduced in varieties ‘less tolerant’ to Pt
Interaction of Pt and Crown rot
In the wheat trial RH1213, all varieties were evaluated with and without the addition of crown rot inoculum at planting. Earlier NGA research in collaboration with NSW DPI indicated that the impact from crown rot may be increased when combined with Pt presence.
Figure 7 shows the yields for each variety. There was little impact from the addition of crown rot inoculum alone in this situation. The most likely explanation is due to the very high level of natural infection from the 2011 cereal stubble. Stubble samples in March 2012 had shown significant levels of crown rot inoculum with increased levels in the EGA Bellaroi![]() stubble (i.e. the ’low’ Pt strips)
stubble (i.e. the ’low’ Pt strips)
Stubble samples were pulled from each wheat plot after harvest and sent to NSW DPI, Tamworth for assessment of incidence levels (based on plating) and disease severity which was a combination of a visual assessment of the % tillers with basal browning and the extent or height of browning up the stem. All varieties recorded very high levels of incidence of the crown rot pathogen - Fusarium pseudograminearum (Fp). Figure 8 highlights that there was no significant difference in Fp incidence between the Pt strips i.e. crown rot incidence was generally uniform across the strips with marginally higher levels in the ‘low’ Pt strips, following EGA Bellaroi![]() . Figure 9 shows the crown rot severity ratings. Despite no difference in incidence between the ‘low’ and ‘high’ Pt strips, there was a significant increase in crown rot severity across all varieties in the ‘high’ Pt strips. Varieties with lower crown rot tolerance appeared to be more impacted. It is expected that the ‘high’ Pt strips were limiting root growth and access to moisture (and nutrition). The reduction in the ability to extract available soil moisture appears to be driving increased crown rot severity.
. Figure 9 shows the crown rot severity ratings. Despite no difference in incidence between the ‘low’ and ‘high’ Pt strips, there was a significant increase in crown rot severity across all varieties in the ‘high’ Pt strips. Varieties with lower crown rot tolerance appeared to be more impacted. It is expected that the ‘high’ Pt strips were limiting root growth and access to moisture (and nutrition). The reduction in the ability to extract available soil moisture appears to be driving increased crown rot severity.
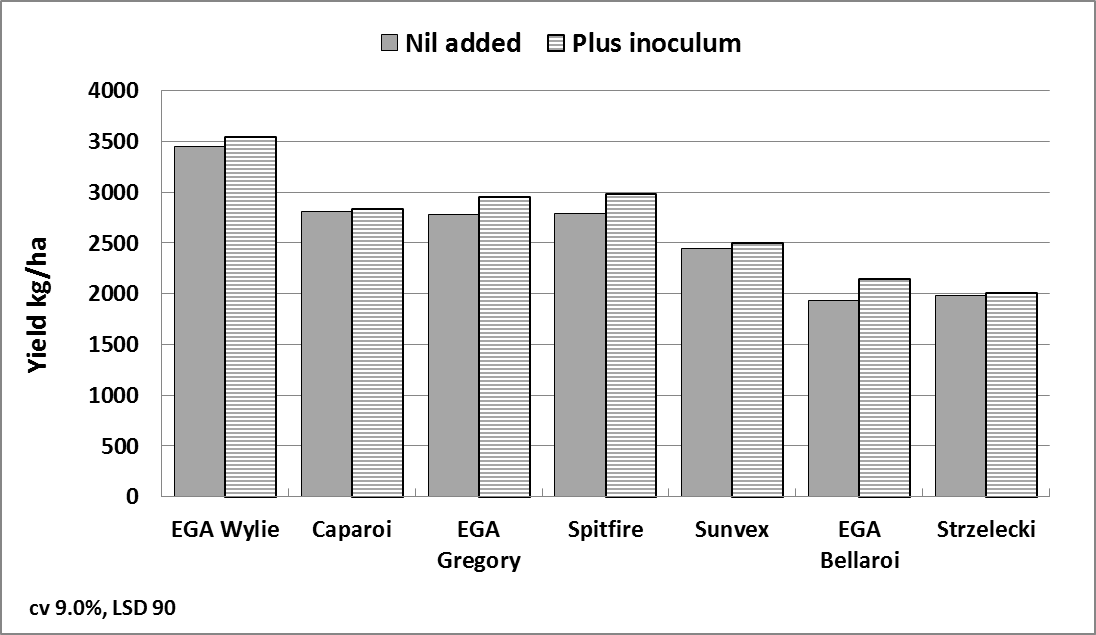
Figure 7: Wheat yield with additional crown rot inoculum (RH1213)
NB Averaged across all varieties there was a significant increase in yield in the plus inoculum plots
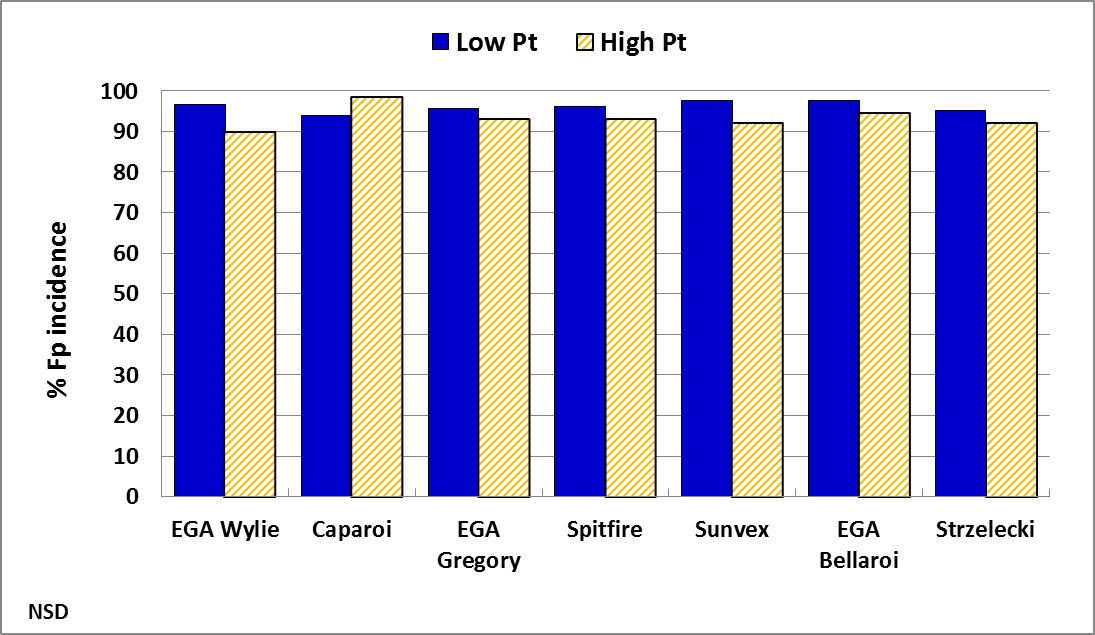
Figure 8: Wheat Fusarium pseudograminearum incidence (RH1213)
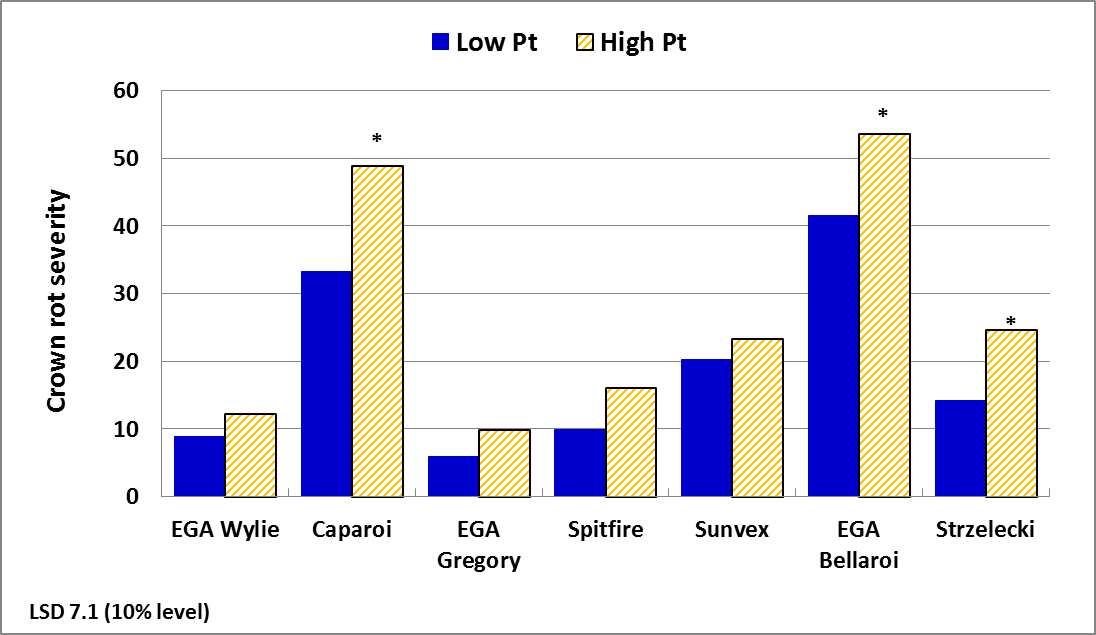
Figure 9: Wheat crown rot severity (RH1213)
* = significant increase in crown rot severity between ‘low’ and ‘high’ Pt strips at p=0.10
Key points:
- High levels of natural infection across trial site
- Negligible impact from addition of extra crown rot inoculum
- Crown rot severity increased in the presence of higher populations of Pt
Economic impact
There are at least two ways to look at the economic impact from Pt in this trial;
- Loss in production from ‘low’ to ‘high’ Pt strips within each variety
- Loss in production compared to the most Pt tolerant variety in either ‘low’ or ‘high’ Pt strips eg EGA Wylie
The first approach is the most scientifically accurate as it looks at the impact of increasing Pt population on individual variety performance. However our ‘low’ Pt strips already had Pt populations at the threshold level. Consequently the yield impacts reported are a CONSERVATIVE estimate of the actual losses caused by Pt at this site.
NB the problem with the second approach is that it does NOT just evaluate the impact of Pt but will take into account other factors such as crown rot tolerance, variety yield potential etc. Variety economic loss compared to EGA Wylie![]() is likely to be a combination of Pt tolerance but also crown rot tolerance, although the results from this site suggest Pt is likely to have been a dominant factor.
is likely to be a combination of Pt tolerance but also crown rot tolerance, although the results from this site suggest Pt is likely to have been a dominant factor.
Table 3: Economic loss in $/ha from Pt in wheat varieties
|
Variety |
Grain receival grade |
Due to increasing Pt pressure WITHIN same variety |
Compared to EGA Wylie (EGA Wylie |
Compared to EGA Wylie (EGA Wylie |
|
EGA Wylie |
ASW1 |
nsd |
- |
- |
|
Caparoi |
FED1 |
nsd |
-184 * |
-220 * |
|
EGA Gregory |
GP1 |
nsd |
-144 * |
-211 * |
|
Spitfire |
ASW1/GP1 |
-206 * |
-62 * |
-251 * |
|
Sunvex |
ASW1 |
-251 * |
-125 * |
-359 * |
|
EGA Bellaroi |
FED1 |
-134 * |
-317 * |
-434 * |
|
Strzelecki |
GP1 |
-284 * |
-243 * |
-510 * |
* = significant yield reduction between ‘low’ and ‘high’ Pt strips at p=0.05 or compared to EGA Wylie![]()
Grain prices (delivered Moree): ASW1 $237, AGP1 $227 and FED1 $222
Spitfire![]() quality downgraded in ‘high’ Pt strips due to significant increase in screenings
quality downgraded in ‘high’ Pt strips due to significant increase in screenings
Total cereal fertiliser and crop protection cost was ~$276/ha
There were no significant differences in yield within canola or faba bean varieties so no economic data is presented. In chickpeas there was a trend to reduced yield in ‘high’ Pt strips, significant at p=0.10. The mean impact across all chickpea varieties was ~380 kg/ha. At a grain price of $480/t, the impact from ‘high’ Pt strips was ~$180/ha.
Table 4: Mean crop economic performance in ‘high’ Pt strips compared to EGA Wylie![]()
|
Variety |
Total fertiliser and crop protection cost $/ha |
Mean net benefit in ‘high’ Pt $/ha |
|
Canola |
345 |
$642/ha |
|
Faba bean |
222 |
$470/ha |
|
Chickpea |
252 |
$642/ha |
|
EGA Wylie |
276 |
$553/ha |
Grain prices: Canola $495, Chickpeas $480, Faba beans $300, ASW1 $237
Key points:
- Yield losses of ~$130-280/ha occurred in ‘less Pt tolerant’ wheat varieties due to increasing populations of Pt.
- This figure is conservative as it measures the loss above threshold rather than from a nil Pt population
- Spitfire performance was unusual. It had high yield in the ‘low’ Pt strips but significantly reduced yield and grain quality in the ‘high’ Pt strips
- All wheat varieties were significantly lower in yield than EGA Wylie in both ‘low’ and ‘high’ Pt situations when combined with very high incidence levels of crown rot
- Economic impact of a poor cereal variety choice was ~$400-500/ha
Multiplication of nematodes
Soil cores were taken from all plots in early January 2013. Data on final Pt populations were not available when this paper was prepared.
The future in wheat varieties?
'One of the entries in the modelling trial was QT8447 a pre-breeding wheat line developed by DAFF for both good tolerance (yields well in presence of Pt) and resistance (reduces Pt multiplication in the roots).'
This strategy is important for long term management as we need to include more crops or varieties in the rotation which help to reduce the ongoing population and impact of this nematode. QT8447 performed very well and was significantly higher yielding than EGA Wylie![]() in the ‘high’ Pt strips. It also provided significantly higher N recovery than any other variety in the ‘high’ Pt strips.
in the ‘high’ Pt strips. It also provided significantly higher N recovery than any other variety in the ‘high’ Pt strips.
Acknowledgments
This was an exceptional trial in both size and complexity but also in the way it was managed. Sincere thanks to Sean Coleman - trial co-operator and to Rachel Norton (NGA) and Kalyx for field trial activity and their ability to successfully manage the multi-crops grown. Thanks also to AGT, Becker Underwood, DAFF QLD, NSW DPI, CSIRO, Pacific Seeds, Pioneer, University of Sydney PBI, Seedmark, Seednet and Viterra for providing seed, inoculants or research input.
Contact details
Richard Daniel,
Northern Grower Alliance
Ph: 07 4639 5344
Email: richard.daniel@nga.org.au
Reviewed by
Special thanks to Steven Simpfendorfer (NSW DPI) and John Thompson (DAFF QLD) for constructive comments and edits.
![]() Varieties displaying this symbol beside them are protected under the Plant Breeders Rights Act 1994
Varieties displaying this symbol beside them are protected under the Plant Breeders Rights Act 1994
GRDC Project Code: NGA00003; DAN00143; CES00055,
Was this page helpful?
YOUR FEEDBACK