‘Jack’ of frosts – recent trends and drivers of change
Author: Steven Crimp, David Gobbet, Dane Thomas, Shuvo Bakar, Uday Nidumolu, Peter Hayman and Garry Hopwood | Date: 17 Feb 2015
Steven Crimp, David Gobbet, Dane Thomas, Shuvo Bakar, Uday Nidumolu, Peter Hayman and Garry Hopwood,
CSIRO Agriculture Flagship.
GRDC project code: MCV 00010
Keywords: climate, frost, phenology, trends
Take home messages
- In Southern regions of Australia, despite global warming, the number of spring frosts has increased and the period of frost occurrence has changed (i.e. broadened over the southern NSW, Victoria and part of South Australia and become later over WA and western parts of South Australia).
- Frost occurrence is linked to a long-term southerly shift in position and intensification of the band of high pressure typically located over central Australia in spring.
- Over many parts of NSW the frost season length has broadened by as much as 40 days.
- Field and simulation studies of wheat have shown flowering and maturity occurring at a rate of seven days earlier per 1oC of warming. This quicker phenology combined with changes to the underlying likelihood of frost will contribute to a significant increase in risk of frost damage.
- Subsequent studies have shown that this level of current risk is expected to continue over the next 20 years despite continued warming in mean temperatures.
Background
Assessments of the changing nature of frost occurrence in Australia have used high quality temperature recording station data and examined changes in the number of frosts between 1960 to present. Common results from these studies include statistically significant increasing trends in the incidence of cold nights and “frosts” since the 1970s for climate stations in southern New South Wales (NSW), northern Victoria, western Tasmania and southern parts of Western Australia. The most recent climate station based analysis posted by the Australian Bureau of Meteorology (BoM) in 2014, show that whilst mean minimum temperatures have been increasing over Australia, the number of frost events have increased on-average by three events per decade since 1970 over south eastern parts of NSW, by between one and three events over southern parts of Western Australia, up to two more events in Tasmania and one more event per decade in northern Victoria.
The links between frost and crop production are well understood and have been extensively reported. Recent statistics for frost related damage in Australia estimated agricultural losses at between $120M and $700M each year.
Given that the profitability of Australian agriculture production is strongly dependent on effectively responding to seasonal climate conditions, understanding the changing nature of climate, in this case extreme minimum temperatures will have positive implications for profitability
Methodology
Using high quality climate data from the Australian Bureau of Meteorology for the period 1960 to 2010 inclusive we have analysed changes and trends for a range of climate variables including:
- Frost season length.
- Consecutive frost days.
- Cold wave duration.
- 10th percentile cold spells.
- 10th percentile cold days.
- 10th percentile cold nights.
- The proportion of cold nights/ days below the 10th percentile.
The months of August to November were the focus of this study based on the well understood links between the timing of frosts and crop damage. The August to November period represents the post head-emergence growth stage for winter cereals. Frosts that occur during or after ear-emergence often result in severe stem and head damage. This can serve to reduce average grain yields and quality by up to 80%, depending on location, altitude, soils and the severity of the frost event.
The ACORN-SAT data were analysed using the Climate Data Operators (CDO) software. This software has been developed by the Max-Planck Institut für Meteorologie to allow for the manipulation and analysis of large climate and Numerical Weather Prediction (NWP) datasets.
Results and discussion
The results from these analyses highlight strong decadal and regional variation for the different measures of frost mentioned above. Consistent increases in the number of frosts are found in both southern NSW and Northern Victoria since 1970. The spatial analysis shows much of the increase in frost frequency has occurred in August, although the date at which the last frost occurs has increased by as much as three weeks in some parts of eastern Australia (Figure 1). Our analysis indicates a broadening of the frost window in the east and a shift in the window to later in the year in the west (Figure 1).
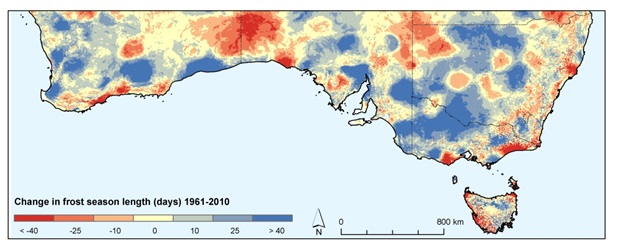
Figure 1. Trends in the frost season duration (number of days) for the period August to November (1961 to 2010) based on the BoM high quality gridded minimum temperature dataset. Regions coloured in dark grey represent areas of increasing frost season length areas depicted in light grey indicate declining frost season length. The legend values represent the change in mean length of the frost season in days per year.
Much of Victoria, NSW, southern WA and SA also show a mean increase of up to six consecutive days with minimum temperatures at or below 2oC (Figure 2). In the eastern parts of Victoria and southern coastal regions of NSW the number of consecutive days below 2oC has declined by 2.5 to 4 days for the period 1960 to 2010.
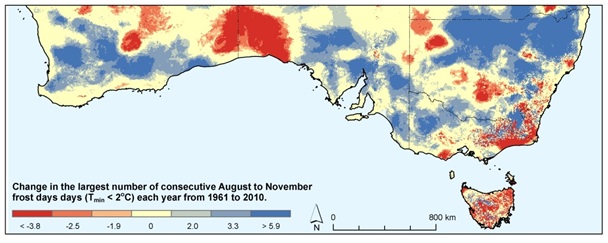
Figure 2. Trends in the number of consecutive frost events (temperatures below 2oC) for the period August to November (1961 to 2010) based on the BoM high quality gridded minimum temperature dataset. Regions coloured in dark grey represent areas of increasing frost number and areas depicted in light grey indicate declining frost number. The legend values represent the change in length of consecutive events per month, per year.
Our research suggests that increases in number and change in the period of frost occurrence is driven by a long-term southerly shift in position and intensification of the band of high pressure typically located over central Australia in spring. The east to west variation in effect on frost indices, suggests that the strongest driver of change (i.e. the southward displacement and strengthening of subtropical high pressures) is most acutely felt in the eastern states.
We have also examined individual frost events at six sites in Victoria, six sites in NSW and eight sites in WA using the National Centres for Environmental Prediction (NCEP) and National Centre for Atmospheric Research (NCAR) climate reanalysis data set known as Reanalysis 1. The dominant synoptic systems identified on each day that the minimum temperature fell to 2°C or less at any of the stations. The results presented in Figure 3 represent an analysis for the period 1961 to 2010 of six NSW sites (i.e. an aggregation of events). The results show that 86% of frost events in September to November occurred in association with high pressures systems situated between 32.5oS and 37.5oS and between 138.4oE to 147.5oE (Figure 3). This analysis also shows that more extreme minimum temperature events are associated with highs centred further south (i.e. 37oS) and further west (i.e. 147.5oE) than for less severe events. This is highlighted in Figure 4a and b for Wagga Wagga.
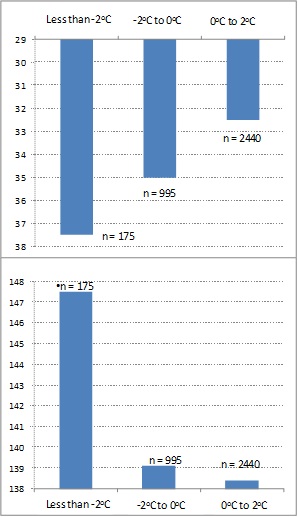
Figure 3. Mean (a) latitudinal and b) longitudinal position of MSLP high centres for minimum temperatures below thresholds of 2°C to 0°C; 0°C to -2°C and less than -2°C for six NSW sites for the period August to October 1960 to 2010.
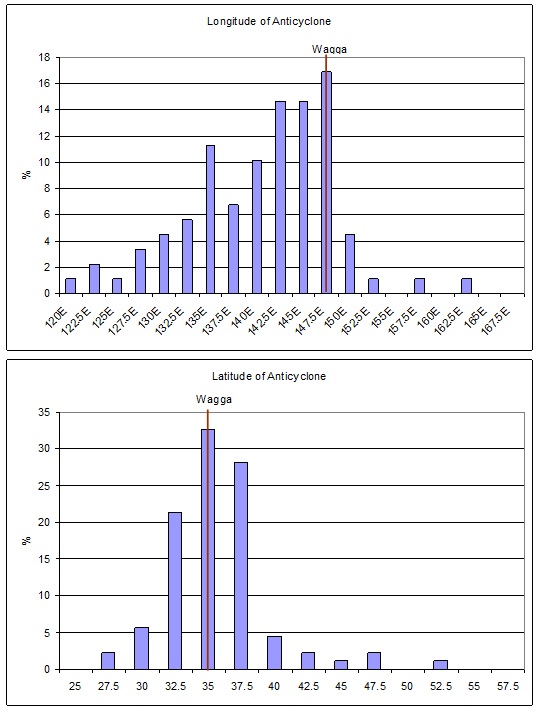
Figure 4. a). The percentage frequency of MSLP high pressure centres (estimated at 1800 UTC) occurring at a given longitude when Tmin ≤ -2°C on that morning and b) The percentage frequency of MSLP high pressure centres (estimated at 1800 UTC) occurring at a given latitude when Tmin ≤ -2°C on that morning.
Given that changes in frost risk have been identified by almost all of the participating farmers as a significant management issue we attempted to understand how change in frost risk is interacting with production risk across Victoria. With the widespread adoption of no‐till seeding across the northern Victoria, during which weeds are controlled before and at sowing with contact and residual herbicides, many crops are now sown by the calendar. An increasing number of farmers begin sowing in mid‐April. Early sown crops are at risk from frost damage during flowering, and late sown crops are at risk of dry conditions and heat shock events during the grain filling period. Farmers are finding that targeting the least risk flowering window using different crop types and varieties is not easy, particularly as the current sowing program can now extend across multiple weeks.
To provide contextually relevant information about frost risk to Victorian farmers, modelling was undertaken to determine when frost risk corresponds with production risk. We have examined the interaction between sowing and flowering dates for three widely used wheat varieties in northern Victoria: the early flowering Axe, mid variety Yitpi and the late-maturing Rosella. Using APSIM (the crop model behind Yield Prophet®) we planted each variety each week from April 1 (day 90) to July 15 for the period 1960 to 2011. We then calculated a mean flowering date for each sowing date for the three varieties across the 17 locations. The time of flowering was then graphed against the risk of frost (Figure 5).
For the Birchip site 90% of the frosts occurred at, or before, day 240 (August 27), 10% of frosts occurred after day 290 (October 16). If you wanted to avoid all but 10% of the frosts that may occur in any one year then planting on day 170 (June 18) for early maturing, day 160 (June 8) for medium and day 150 (May 29) for late, would achieve that end.
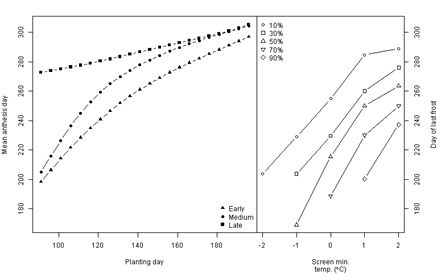
Figure 5. Left: Simulated flowering dates as a function of planting date (1 April = day 90; 15 July = day 197) for an early (e.g. cv ‘Axe’), medium (e.g. cv ‘Yitpi’) and a late (e.g. cv ‘Rosella’) maturing wheat variety at a Birchip (DS) site. Right: Corresponding frost probabilities, based on the entire temperature record for the period 1961 to 2013.
The results from the analyses show a consistent broadening of the frost window and therefore the occurrence of the 10th percentile frost risk occurs much later in the growing season. In some instance the 10th percentile frost risk window ends three weeks later. As a result, later planting of the medium growing season length wheat variety appears to be an effective method to avoid frost damage in the northern Victorian region given the current trend.
Contact details
Steven Crimp
CSIRO Agriculture Flagship, GPO BOX 1700, Canberra
02 6246 4095
GRDC Project Code: MCV 00010,
Was this page helpful?
YOUR FEEDBACK