Summer weeds reduce moisture and nitrogen
Author: Colin McMaster and Neroli Graham | Date: 17 Feb 2015
Colin McMaster1and Neroli Graham2
1NSW DPI, Cowra; 2NSW DPI, Tamworth.
GRDC project code: CWF0013
Keywords: plant available water, summer fallow management, water use efficiency
Take home messages
- Where weeds were controlled, 58 % of canola (Hyola®575CL) grain yield in 2011 was attributed to increased stored moisture and nitrogen retained via clean weed free fallow.
- Controlling summer weeds increased:
- Canola grain yield by 830 kg/ha where full weed control was implemented.
- Plant available water (PAW) at sowing by 86 and 50 mm in 2011 and 2012, respectively.
- Mineral nitrogen by 69 and 45 kg N/ha in 2011 and 2012, respectively.
- For every 1 mm of moisture lost through summer weed growth during the fallow period, there was also reduced mineral nitrogen levels of approximately 0.56 kg N/ha.
- Summer weeds affected soil moisture to a depth of at least 1.2 m.
- Every dollar invested in controlling summer weeds returned up to $ 7.20 /ha.
- Where full fallow weed control was implemented, the return on investment (ROI) was up to 720%.
Trial aim
To evaluate the impact of summer weed growth during a summer fallow period on stored moisture, nutrient retention and overall grain yield.
Background
This trial is part of a series of summer fallow management trials funded by GRDC through the Central West Farming Systems “Rain & Grain” project.
Previous research conducted in central NSW has highlighted that 50 % of yield potential can be attributed to summer rainfall and summer fallow management (Haskins and McMaster, 2012).
Summer weed control was found to be more important than stubble management as clean weed free fallows increased both moisture and nutrient availability. A dollar invested in fallow sprays averaged a $3.90 gross return across three trial sites (Haskins and McMaster, 2012).
Treatments
The trial site was located 30 km north west of Forbes NSW, and comprised three replicates of each combination of summer weed control (refer to Table 1) and additional nitrogen fertiliser (refer to Table 2).
Table 1. Summer weed control treatments.
|
Treatment |
Protocol |
|---|---|
|
Nil spray |
No summer spray (knockdown applied just prior to sowing). |
|
Miss first spray |
The first initial spray of the fallow period was not applied. |
|
Full spray |
Zero tolerance to weeds – herbicide applied approx. 10 days after significant rainfall event*. |
|
Delayed spray |
Herbicides applied approx. 24 days after significant rainfall event*. |
* Significant rainfall event was considered to be >20mm.
Table 2. Rates of applied additional nitrogen fertiliser treatments.
|
2011 (kgN/ha)a |
2012 (kgN/ha)d |
|---|---|
|
0 |
0 |
|
70b |
50 |
|
140c |
100 |
a Additional N applied as urea ammonium nitrate (UAN) using streaming nozzles.
b Applied at early budding.
c 70 kgN/ha applied at early budding and additional 70 kgN/ha at stem elongation.
d All additional nitrogen applied in 2012 was predrilled urea.
Table 3. Monthly rainfall (mm) at Gunningbland.
|
Month |
2011 |
2012 |
||
|---|---|---|---|---|
|
mm |
Decile |
mm |
Decile |
|
|
January |
8 |
1 |
35 |
3.8 |
|
February |
70 |
7.2 |
179 |
9.8 |
|
March |
83 |
8.5 |
128 |
9.4 |
|
April |
25 |
4.4 |
37 |
5.8 |
|
May |
34 |
4.3 |
60 |
7.2 |
|
June |
12 |
0.7 |
44 |
5.1 |
|
July |
17 |
1.5 |
43 |
4.6 |
|
August |
57 |
6.6 |
15 |
1.1 |
|
September |
23 |
3.0 |
33 |
4.5 |
|
October |
56 |
6.3 |
7 |
0.4 |
|
November |
139 |
9.7 |
18 |
2.4 |
|
December |
102 |
8.9 |
14 |
1.5 |
|
Total rainfall |
626 |
613 |
||
|
Incrop rainfall* |
136 |
202 |
||
*In-crop rainfall includes May to Oct rainfall
Trial results
Moisture retention
Controlling summer weeds, through application of herbicide spray, had a significant effect on stored moisture in 2011(P=0.009) and 2012 (P=0.021).
There was an additional benefit of 86 and 50 mm PAW at sowing for 2011 and 2012, respectively, when summer weeds had been fully controlled when compared to the nil spray treatment (Table 4).
Stored PAW in 2011 for the full (201 mm PAW) or delayed (167 mm PAW) was greater than either the missed first (122 mm PAW) or nil (115 mm PAW) spray treatments (Table 4). The full, delayed and missed first spray treatments stored more water than the nil spray in 2012 with 147, 159, 155 and 97 mm PAW, respectively (Table 4). This may have been influenced by the higher rainfall over the summer fallow period in 2012 (Table 3).
In both, 2011 and 2012 the additional PAW was largely conserved between the depths of 15cm to 105cm (Figures 1 and 2). Summer weeds in the nil spray treatment reduced PAW to a depth of 120 cm (Figures 1 and 2).
Residual moisture (115 mm PAW) was measured after the 2011 harvest with no difference between the spray treatments (data not shown).
Table 4. Plant available water (mm) for each of the four spray treatments measured at sowing.
|
Spray treatment |
2011 PAW (mm) |
2012 PAW (mm) |
|---|---|---|
|
Nil |
115.5 |
97.3 |
|
Missed First |
121.6 |
155.0 |
|
Full |
201.3 |
147.3 |
|
Delayed |
167.6 |
158.7 |
|
LSD (P=0.05) |
43.2 |
37.2 |
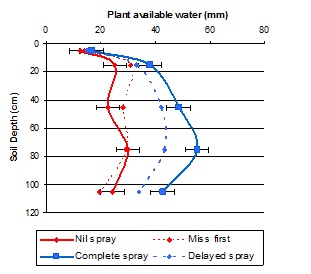
Figure 1. Plant available water (mm) and standard error for the four spray treatments in 2011.
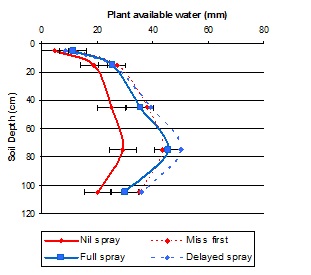
Figure 2. Plant available water (mm) and standard error for the four spray treatments in 2012.
Nutrient retention
Nitrogen (mineral N)
Summer weeds had a significant effect on available soil nitrogen at sowing in 2011 (P=0.02) and 2012 (P=0.007) (Figure 3 and 4, respectively).
A zero tolerance to summer weeds increased the level of mineral nitrogen by 69 and 45 kgN/ha in 2011 and 2012, respectively.
Nitrogen losses increased as weed control was delayed, missed or nil spray in 2011, when compared to full spray treatment (Table 5). The nil spray treatment had lower mineral nitrogen levels in the soil when compared to the other three spray treatments (Table 5). Increased nitrogen levels were evenly distributed throughout the whole soil profile (Figure 3 and 4).
Table 5. Level of mineral nitrogen (kgN/ha) for four spray treatments measured at sowing.
|
Spray treatment |
2011 Nitrogen (kgN/ha) |
2012 Nitrogen (kgN/ha) |
|---|---|---|
|
Nil |
44.4 |
80.4 |
|
Missed First |
72.2 |
120.6 |
|
Full |
113.8 |
125.5 |
|
Delayed |
81.7 |
112.9 |
|
LSD (P=0.05) |
36.0 |
20.9 |
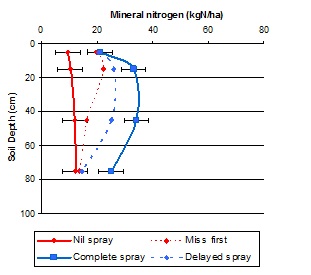
Figure 3. Mineral N (kgN/ha) and standard error for the four spray treatments in 2011.
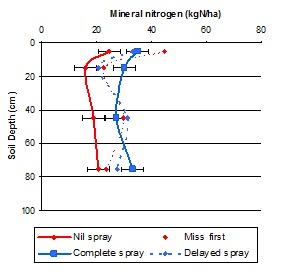
Figure 4. Mineral N (kgN/ha) and standard error for the four spray treatments in 2012.
Phosphorus (Colwell P), Potassium (Colwell K) and Sulphur (KCL)
Control of summer weeds did not influence the level of soil phosphorus, potassium or sulphur levels in 2011 or 2012 (Appendix, Table 6).
Relationship between moisture and nutrient retention in 2011 and 2012
A strong relationship (R2=0.62) was observed between PAW and nitrogen availability at sowing. For every millimetre of moisture that was lost through summer weed growth during the fallow period, there was also reduced mineral nitrogen levels of 0.56 kg/ha
For example, if an extra 75 mm of moisture was conserved by controlling summer weeds, there was also 42 kg/ha of extra available nitrogen to the following winter crop (Figure 5). The additional nitrogen benefit was likely due to a combination of increased mineralisation, as the soil surface stayed wetter for longer where weeds were controlled, as well as reduced nitrogen loss through summer weed uptake.
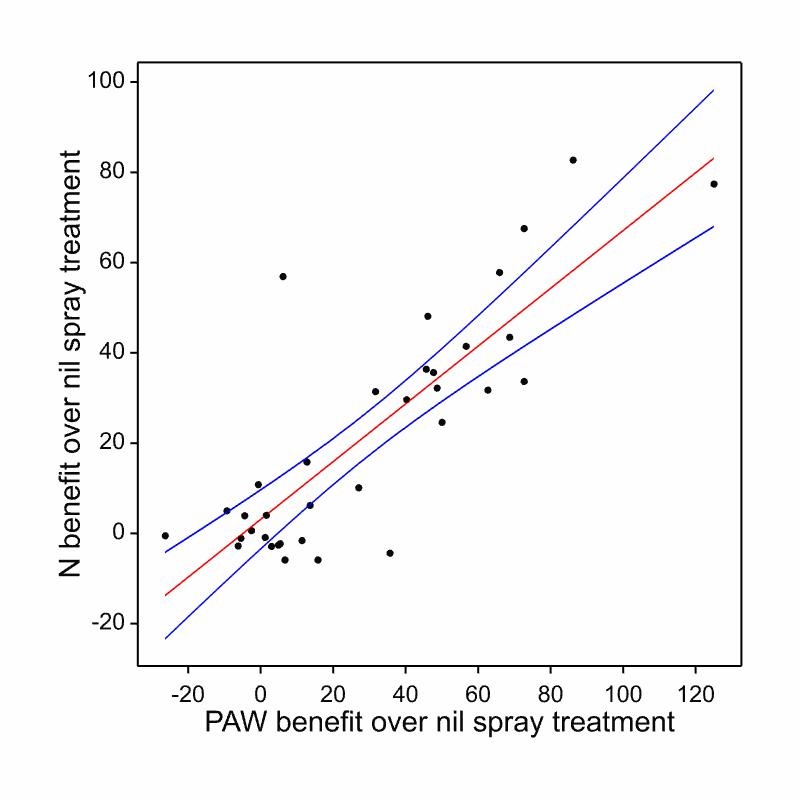
Figure 5. Fitted and observed relationships between moisture (PAW mm) and nitrogen (Mineral N kgN/ha) loss via summer weed growth with 95% confidence intervals (across 2011 and 2012).
Summer weed growth and additional nitrogen fertiliser on grain yield, protein and oil content
Differences in grain yield through summer weed control (P<0.001), additional nitrogen fertiliser (P<0.001) and their interaction (P=0.004) were observed in 2011.
Grain yields for complete (1.78 t/ha), and delayed (1.75 t/ha) spray treatments were higher than either missed first (1.26 t/ha) or nil (0.95 t/ha) spray treatments.
Additional nitrogen fertiliser increased grain yield from 1.10 t/ha to 1.43 t/ha and 1.78 t/ha respectively for 0 kgN/ha, 70 kgN/ha and 140 kgN/ha. The effectiveness of additional fertiliser on grain yield varied with summer weed control. Nitrogen fertiliser coupled with good summer weed control (increased stored moisture) showed higher grain yields compared to when nitrogen fertiliser was applied to weedy fallows (low stored moisture) (Figure 6).
The trial in 2012 was not harvested due to a miscellaneous adventure (contract harvester went through trial site during the night!).
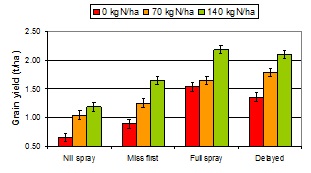
Figure 6. Canola grain yield (t/ha) and standard error for the four spray and three nitrogen fertiliser treatments in 2011.
Return on investment (ROI)
The key driver for profitability in this study was through controlling summer weeds; the greater the delay, the greater the economic loss. For every dollar invested in fallow herbicides, the missed first spray treatment returned $1.90 /ha, full spray treatment returned $7.20 /ha and the delayed spray treatment returned $3.90 /ha (Appendix, Table 7).
The application of nitrogen fertiliser was not profitable in all treatments (Appendix, Table 7) and did not have the high returns on investment that resulted from full weed control alone. Addition of nitrogen fertiliser on top of spray treatments provided an increased return that ranged from -$1.20 to $0.80 (Appendix, Table 7). However seasonal conditions would have strongly impacted N uptake and hence ROI, as rain did not occur for 20 days after N application. Some early upfront N applied at sowing could have improved crop response to N.
Discussion
These results show that summer weed control is a key driver for profitable cropping systems in central NSW.
Crop profitability was optimised through effective control of summer weeds (Appendix, Table 7). Highest returns were calculated when full weed control was undertaken. This was due to lower rates of herbicides being applied, higher residual PAW and higher residual nitrogen, resulting in increased grain yields. Negative returns were calculated when no summer weed control was undertaken (Appendix, Table 7). This is consistent with other local trial results across central NSW (Haskins and McMaster, 2012).
Controlling summer weeds using either the full or delayed spray treatments allowed for the highest amount of PAW (Table 4). This stored moisture being conserved for subsequent winter crops.
The stored PAW at the beginning of the winter cropping season in both 2011 and 2012 was seen throughout the profile, with the majority being measured below 30 cm in depth (Figure 1 and 2). This deep stored moisture can be highly valuable to dryland crops as it can become available during the post-anthesis period when grain yield is particularly sensitive to water deficit. French and Schultz (1984) stated that additional subsoil water can achieve a marginal water use efficiency of three times the value for water use calculated on a whole season basis (20 kg/mm/ha).
In addition to increased stored PAW, when summer weeds were controlled with the full spray treatment, the soil had the highest level of mineral N (Table 5).
Conserving moisture via controlling summer weeds had an additional benefit of 0.56 kgN/ha of nitrogen for every extra 1 mm of stored moisture in the soil profile (Figure 5). Sadras et al (2012) observed that the extra nitrogen conserved by controlling summer weeds is vital to capture the extra benefits of additional summer water, and reciprocally high water supply is required to capture the benefits of additional nitrogen.
The rate and timing of summer weed control did not influence the level of phosphorus, potassium or sulphur within the soil profile (Appendix, Table 6).
Canola grain yields were highest under the full or delayed spray treatments, and also under higher nitrogen regimes (Figure 6).
Summer weeds should be controlled when small and actively growing, as this lowers the rate of herbicide required and generally increases herbicide efficacy. In addition, stored soil moisture and nitrogen has not been depleted by summer weed plant growth.
Water and nitrogen impact grain yield as they influence grain number (more tillers and more grains per head) and grain size. Consequently the return on investment for controlling summer weeds in both this trial and others (Haskins and McMaster, 2012) has consistently been shown to be between $2.20 - $7.20 per ha for every dollar invested.
Summer weed control has also been reported to enhance early sowing opportunities in some seasons, which could increase grain yield by a further 21-31% according to Hunt et al. (2010).
References
Haskins B, and McMaster C (2012) Summer fallow management. Australian Agronomy conference proceedings.
Kirkegaard JA, and Hunt JR (2010) Increasing productivity by matching farming system management and genotype in water-limited environments. Journal of Experimental Botany 61, 4129-4143.
French RJ, and Schultze JE (1984) Water use efficiency of wheat in a Mediterranean–type environment. I. The relationship between yield, water use and climate. Australian Journal of Agricultural Research 45, 93-117.
Sadras V, Lawson C, Hooper P, McDonald G (2012) Contribution of summer rainfall and nitrogen to the yield and water use efficiency of wheat in Mediterranean-type environments of South Australia. European Journal of Agronomy 36, 41-54
Acknowledgement
Thanks to Jim Cronin for allowing us to run the trial on “Durran”, Gunningbland NSW. The contributions of Tracy Reid (NSW DPI), Sandy McMaster and James Hunt (CSIRO) are gratefully acknowledged in running this trial, and Rohan Brill (NSW DPI) for reviewing this trial report.
Contact details
Colin McMaster
NSW Department of Primary Industries, Cowra.
0427 940 847
colin.mcmaster@dpi.nsw.gov.au
Appendix
Table 6. Level of soil nutrients phosphorus, potassium and sulphur prior to sowing trials 2011 and 2012.
| Weed control | Depth | 2011 Soil test results | 2012 Soil Test results | ||||
|---|---|---|---|---|---|---|---|
| P (Colwell) mg/kg | K (amm-acet) Meq/100g | S (KCL) mg/kg | P (Colwell) mg/kg | K (amm-acet) Meq/100g | S (KCL) mg/kg | ||
|
Nil Spray |
0-10 cm |
14.3 |
1.3 |
3.0 |
6.3 |
607.3 |
26.6 |
|
10-30 cm |
- |
- |
3.4 |
12.0 |
229.0 |
16.6 |
|
|
30-60 cm |
- |
- |
7.2 |
6.0 |
165.3 |
11.6 |
|
|
60-90 cm |
- |
- |
17.9 |
12.7 |
183.3 |
13.9 |
|
|
Miss first |
0-10 cm |
29.3 |
1.3 |
3.8 |
5.0 |
635.7 |
10.8 |
|
10-30 cm |
- |
- |
4.1 |
12.0 |
241.7 |
18.9 |
|
|
30-60 cm |
- |
- |
6.1 |
7.0 |
183.7 |
28.8 |
|
|
60-90 cm |
- |
- |
13.6 |
10.7 |
183.3 |
21.7 |
|
|
Complete |
0-10 cm |
19.3 |
1.3 |
3.7 |
3.7 |
553.7 |
9.5 |
|
10-30 cm |
- |
- |
4.7 |
12.3 |
235.7 |
16.5 |
|
|
30-60 cm |
- |
- |
8.4 |
7.0 |
156.0 |
22.4 |
|
|
60-90 cm |
- |
- |
12.7 |
8.3 |
182.7 |
23.1 |
|
|
Delayed |
0-10 cm |
16.3 |
1.3 |
3.2 |
6.0 |
606.7 |
10.1 |
|
10-30 cm |
- |
- |
4.2 |
12.3 |
275.3 |
14.9 |
|
|
30-60 cm |
- |
- |
8.9 |
6.0 |
186.3 |
26.3 |
|
|
60-90 cm |
- |
- |
18.5 |
10.7 |
205.7 |
26.1 |
|
|
|
|
|
|
|
|
|
|
|
P value |
Spray trt |
0.096 |
0.984 |
0.274 |
0.762 |
0.394 |
0.515 |
|
|
Depth |
- |
- |
<0.001 |
0.002 |
<0.001 |
0.001 |
|
|
Spray x depth |
- |
- |
0.108 |
0.994 |
0.359 |
<0.001 |
|
|
|
|
|
|
|
||
|
LSD (P = 0.05) |
Spray trt |
12.6 |
0.3 |
2.06 |
3.238 |
51.680 |
4.907 |
|
|
Depth |
- |
- |
1.77 |
3.745 |
23.260 |
4.139 |
|
|
Spray x depth |
- |
- |
3.57 |
7.164 |
61.280 |
8.397 |
|
|
|
|
|
|
|
|
|
Table 7. 2011 Economic analysis of summer weed control and additional nitrogen fertiliser
| Spray tearment | Trt 1: Fallow spray | Trt 2: N fertiliser | Partial analysisᵇ | Total variable costs | Yield (t/ha) | Income ($/ha)ᵃ | Gross margin ($/ha) | ||||||
|---|---|---|---|---|---|---|---|---|---|---|---|---|---|
| No of sprays | Herbicide rate (low) | Cost ($/ha) | kgN/ha | Cost ($/ha) | Cost ($/ha) | Benefit ($/ha) | Return on investment | ||||||
| Trt 1&2 | Trt 2 only | ||||||||||||
|
Nil Spray |
1 |
H |
$24 |
0 |
$0 |
$24 |
|
|
|
$461 |
0.65 |
$323 |
-$138 |
|
70 |
$119 |
$143 |
$196 |
0.4 |
0.6 |
$580 |
1.04 |
$519 |
-$61 |
||||
|
140 |
$238 |
$262 |
$267 |
0.0 |
0.1 |
$699 |
1.18 |
$590 |
-$109 |
||||
|
Miss first |
2 |
H,L |
$42 |
0 |
$0 |
$42 |
$120 |
1.9 |
|
$479 |
0.89 |
$443 |
-$36 |
|
70 |
$119 |
$161 |
$299 |
0.9 |
0.5 |
$598 |
1.25 |
$623 |
$25 |
||||
|
140 |
$238 |
$280 |
$501 |
0.8 |
-0.2 |
$717 |
1.65 |
$825 |
$108 |
||||
|
Complete spray |
3 |
L,L,L |
$54 |
0 |
$0 |
$54 |
$441 |
7.2 |
|
$491 |
1.53 |
$764 |
$273 |
|
70 |
$119 |
$173 |
$500 |
1.9 |
-0.5 |
$610 |
1.65 |
$823 |
$213 |
||||
|
140 |
$238 |
$292 |
$767 |
1.6 |
0.4 |
$729 |
2.18 |
$1,091 |
$362 |
||||
|
Delayed spray |
3 |
H,H,H |
$72 |
0 |
$0 |
$72 |
$352 |
3.9 |
|
$509 |
1.35 |
$675 |
$166 |
|
70 |
$119 |
$191 |
$571 |
2.0 |
0.8 |
$628 |
1.79 |
$895 |
$267 |
||||
|
140 |
$238 |
$310 |
$727 |
1.3 |
-1.2 |
$747 |
2.1 |
$1,050 |
$303 |
||||
Notes
ᵃ Canola valued at $500/t
ᵇ Partial analysis in benefit and cost related to treatment change
ᶜ Ration compares the benefit of treatments over the Nil spray /Nil N fertiliser treatment
ᵈ Total variable costs have been sourced from I&I NSW Farm Gross Margin Guide 2011 (Canola, short fallow (no-till) Central zone - \
ᵉ H = High herbicde rate requirred ($24/ha including application)
L = Lower herbicide rate required ($18/ha including application)
ᶠ Ezy N was the form of nitrogen applied at $1.70 per unit N
GRDC Project Code: CWF0013,
Was this page helpful?
YOUR FEEDBACK