Topping up wheat with foliar phosphorus – does it work?
Author: Therese McBeath, Evelina Facelli, Courtney Peirce, Mike McLaughlin and Ed Hunt | Date: 10 Feb 2015
Therese McBeath1, Evelina Facelli2, Courtney Peirce2, Mike McLaughlin2 and Ed Hunt3,
1Agriculture, CSIRO, Waite Campus, Urrbrae, SA, 5064; 2School of Agriculture Food and Wine, University of Adelaide, Waite Campus, Urrbrae, SA, 5064; 3Ed Hunt Consulting, Wharminda, SA.
GRDC project code: UA00139
Keywords: phosphorus, leaf physiology, wetters, adjuvants, deficiency.
Take home messages
- Leaves need to be healthy to uptake foliar applied phosphorus. Wheat leaves that are severely deficient in phosphorus (P) cannot take up foliar applied P as the leaf structure is compromised.
- An adjuvant is required in the formulation for the P applied to stick to the leaf and be taken up. However, the type of adjuvant does not appear to be important, as long as it contains a surfactant and is compatible with the fertiliser.
- Earlier applications of foliar P (tillering) results in a lower fertiliser recovery than at flag leaf emergence through to mid-booting.
- It is possible to increase wheat P uptake using foliar P application but we have not increased grain yield (in the growth room and after one year of field trials).
- The dry finish in 2014 meant that we did not measure significant wheat grain yield responses to soil applied P, despite measuring some responses in early biomass.
Background
Prices for P fertiliser are expected to increase and strategies that result in more efficient use of fertiliser P are potentially valuable. Recent surveys of grain cropping soils for levels of available P suggest that many soils have marginal to adequate supplies of available P due to build up from previous fertiliser applications. In these soils, the crop requirements for additional fertiliser are marginal and highly dependent on seasonal rainfall and there are opportunities to optimise the management of fertiliser P.
We have been testing whether it is possible to top up P supply with in-season foliar application to the plant in seasons of higher yield potential, and as a result reduce the amount of fertiliser applied at sowing time.
The efficacy of foliar P is controlled by several factors: plant physiology (wettability of leaf, crop nutrient status), growth stage (leaf surface uptake, leaf area available for product interception), P formulation (P source and adjuvant, rate) and soil P fertility. These factors do not affect the efficacy of the foliar P independently and the outcomes of their interactions are difficult to predict.
The area of leaf available to intercept foliar applied product controls the maximum possible recovery. One of our aims is to determine the “window of opportunity” where we could maximise the amount of fertiliser intercepted by the leaves at the peak of leaf demand for P in growth room and field experiments.
Properties of the leaf surface regulate the absorption and movement of the product applied into crop plants. A second aim is to investigate these factors in detail in order to identify the conditions under which foliar P is likely to be more effective, and which additives (adjuvants) in the formulation are likely to improve the efficacy of the product.
We are also investigating the optimum combinations of P source and adjuvant, timing and rates suitable for different levels of soil and crop P fertility. To do this we are using a multi-disciplinary approach where we use detailed measurements of the processes and conditions controlling the efficacy of foliar P uptake to inform field based evaluation of foliar P in wheat crops.
Laboratory and growth room evaluation of when, what and how much?
When to apply?
In theory the timing of canopy closure of wheat falls within the timing of peak uptake of P (between tillering and head emergence).To study the effects of timing of foliar application on P uptake and response of wheat plants to foliar-applied P, we established a growth room experiment where phosphoric acid was sprayed at various growth stages of wheat (tillering to anthesis) with plants harvested 10 days after each application, and another subset of plants grown through to maturity.
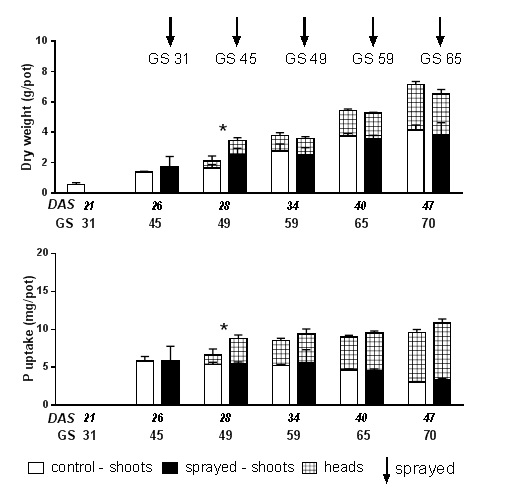
Figure 1. Dry weight and P uptake of wheat plants sprayed with phosphoric acid (2 kg P/ha) plus LI700® (0.3% w/v) at Zadoks growth stages (GS) 31, 45, 49, 59 and 65 compared with a nil foliar control. Plants were harvested ≈10 days after foliar P application (DAS=days after sowing).
Application of foliar P resulted in a transient increase in plant biomass (65%) and P uptake (33%) when plants were sprayed at booting (Figure 1, GS45) with differences measurable 10 days after the application of the foliar product, but not at maturity.
What level of P fertility?
Previous research in our group indicated that P deficient plants had leaves with a reduced ability to take up foliar applied P. The leaves were smaller and the structures that control the uptake of solutes were compromised (e.g. stomata and leaf hairs were not properly formed) (Fernandez et al. 2014). In fact, the severely P deficient wheat leaves were not able to take up any foliar applied P despite the leaf being dipped in the fertiliser solution rather than being applied as a spray. This is a very interesting finding and fits with our hypothesis that the only potential fit for foliar P is as a ‘top-up’ fertiliser in soils with marginal to adequate P status and in seasons of higher yield potential. With this finding in mind, we have avoided situations of severe P deficiency (e.g. highly calcareous soils).
Our motivation to work in this area was based on an earlier study where we measured a 25% grain yield response to a foliar P top-up in the growth room in one of the two soils we evaluated (McBeath et al. 2012). At the time of this work we evaluated the literature and found that responses to foliar P were difficult to predict and sporadic and we attributed this to the disjointed nature of the research and the application in situations of low P demand (Noack et al. 2010). However, we have now completed several growth room studies and the ability to achieve a consistent and predictable positive effect on wheat growth appears evasive, despite being able to trace that the foliar product has been taken up by the plant and that it has increased the total amount of plant P uptake (eg. Peirce et al. 2014). Because of inconsistencies in the response of wheat to foliar applied P we have screened a range of agricultural soils for responsiveness of wheat to different levels of soil and foliar (booting) applied P to identify the most appropriate soil type and P rate for field evaluation (Table 1).
Table 1. Soils used in growth room evaluation of responses of varying doses of soil and foliar applied P. Relative yield is the maximum biomass measured/yield measured with nil P input.
|
Location |
General description |
pH |
Soil Test P |
|||
|---|---|---|---|---|---|---|
|
DGT P (μg/L) |
Colwell P (mg/kg) |
PBI# |
Relative Yield (Max/nil P yield) |
|||
|
Black Point* |
Calcareous Sand |
8.5 |
3 |
2 |
75 |
5.5 |
|
Lock* |
Siliceous Sand |
8.2 |
64 |
19 |
40 |
1.1 |
|
Tumby Bay* |
Sandy loam |
6.3 |
2 |
6 |
55 |
97.3 |
|
Cummins |
Deep Clay |
6.9 |
109 |
48 |
52 |
^1.0 |
|
Marrabel |
Ironstone Soil |
5.3 |
42 |
17 |
26 |
NA |
*Soil types used to evaluate a dose response to foliar applied P. # PBI, phosphorus buffering index. ^Harvested post-anthesis, all other sites were grown to maturity and relative yield is expressed for grain yield.
In soils where plants showed a relative yield of >1 in response to soil P applied, doses of foliar applied P ranging from 0-4 kg P/ha equivalent were tested. In all cases the relationship between anthesis dry weight and sowing applied P did not differ substantially between different inputs of foliar applied P (Figure 2).
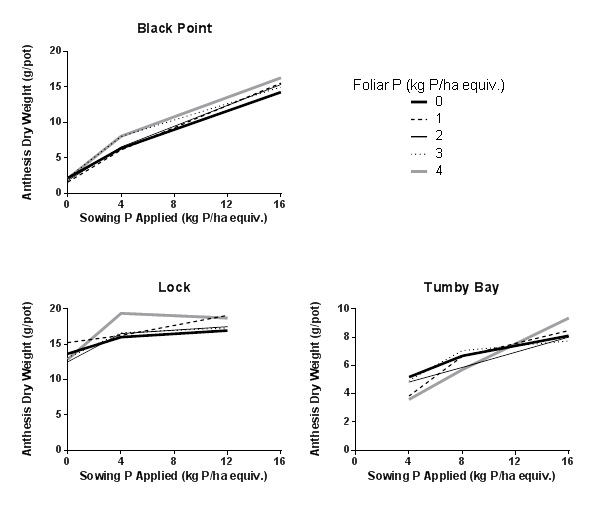
Figure 2. Anthesis dry weight response to sowing (applied to soil) and foliar (applied at booting) applied P in three different soils found to be P responsive.
The outcome of this screening work has been that while we have been able to identify soils in which wheat is very responsive to varying rates of soil applied P, identifying soils in which wheat plants are highly responsive to varying rates of foliar applied P remains evasive.
What to apply and how much?
Through collaboration with Dr Craig Priest based at the Ian Wark Research Institute our PhD student Courtney Peirce has undertaken some really interesting research looking at the interactions between different formulations (in particular different adjuvants in combination with phosphoric acid) and wheat leaves using contact angle and spreading drying measurements in order to evaluate the importance of the adjuvant in the formulation. The commercially available adjuvants LI700® and Agral® were compared with the laboratory grade surfactant Genapol® and the adjuvants were tested at a range of concentrations that included the label rate.
In the absence of adjuvants, the wheat leaves were very difficult to wet and phosphoric acid without adjuvant did not stick to the leaf surface resulting in droplet bounce and loss of fertiliser to the soil (Figure 3). With adjuvants, while the interaction between the leaf and the formulation was quite different at the first measurement taken after 20 seconds (Figure 3) all formulations caused complete wetting of the leaf taking 13-20 minutes for LI700® and Agral® compared to 10 seconds for Genapol®. The slower spreading time correlated with smaller leaf area coverage for each droplet resulting in Genapol® having a 3-fold higher surface coverage compared to both LI700® and Agral®.
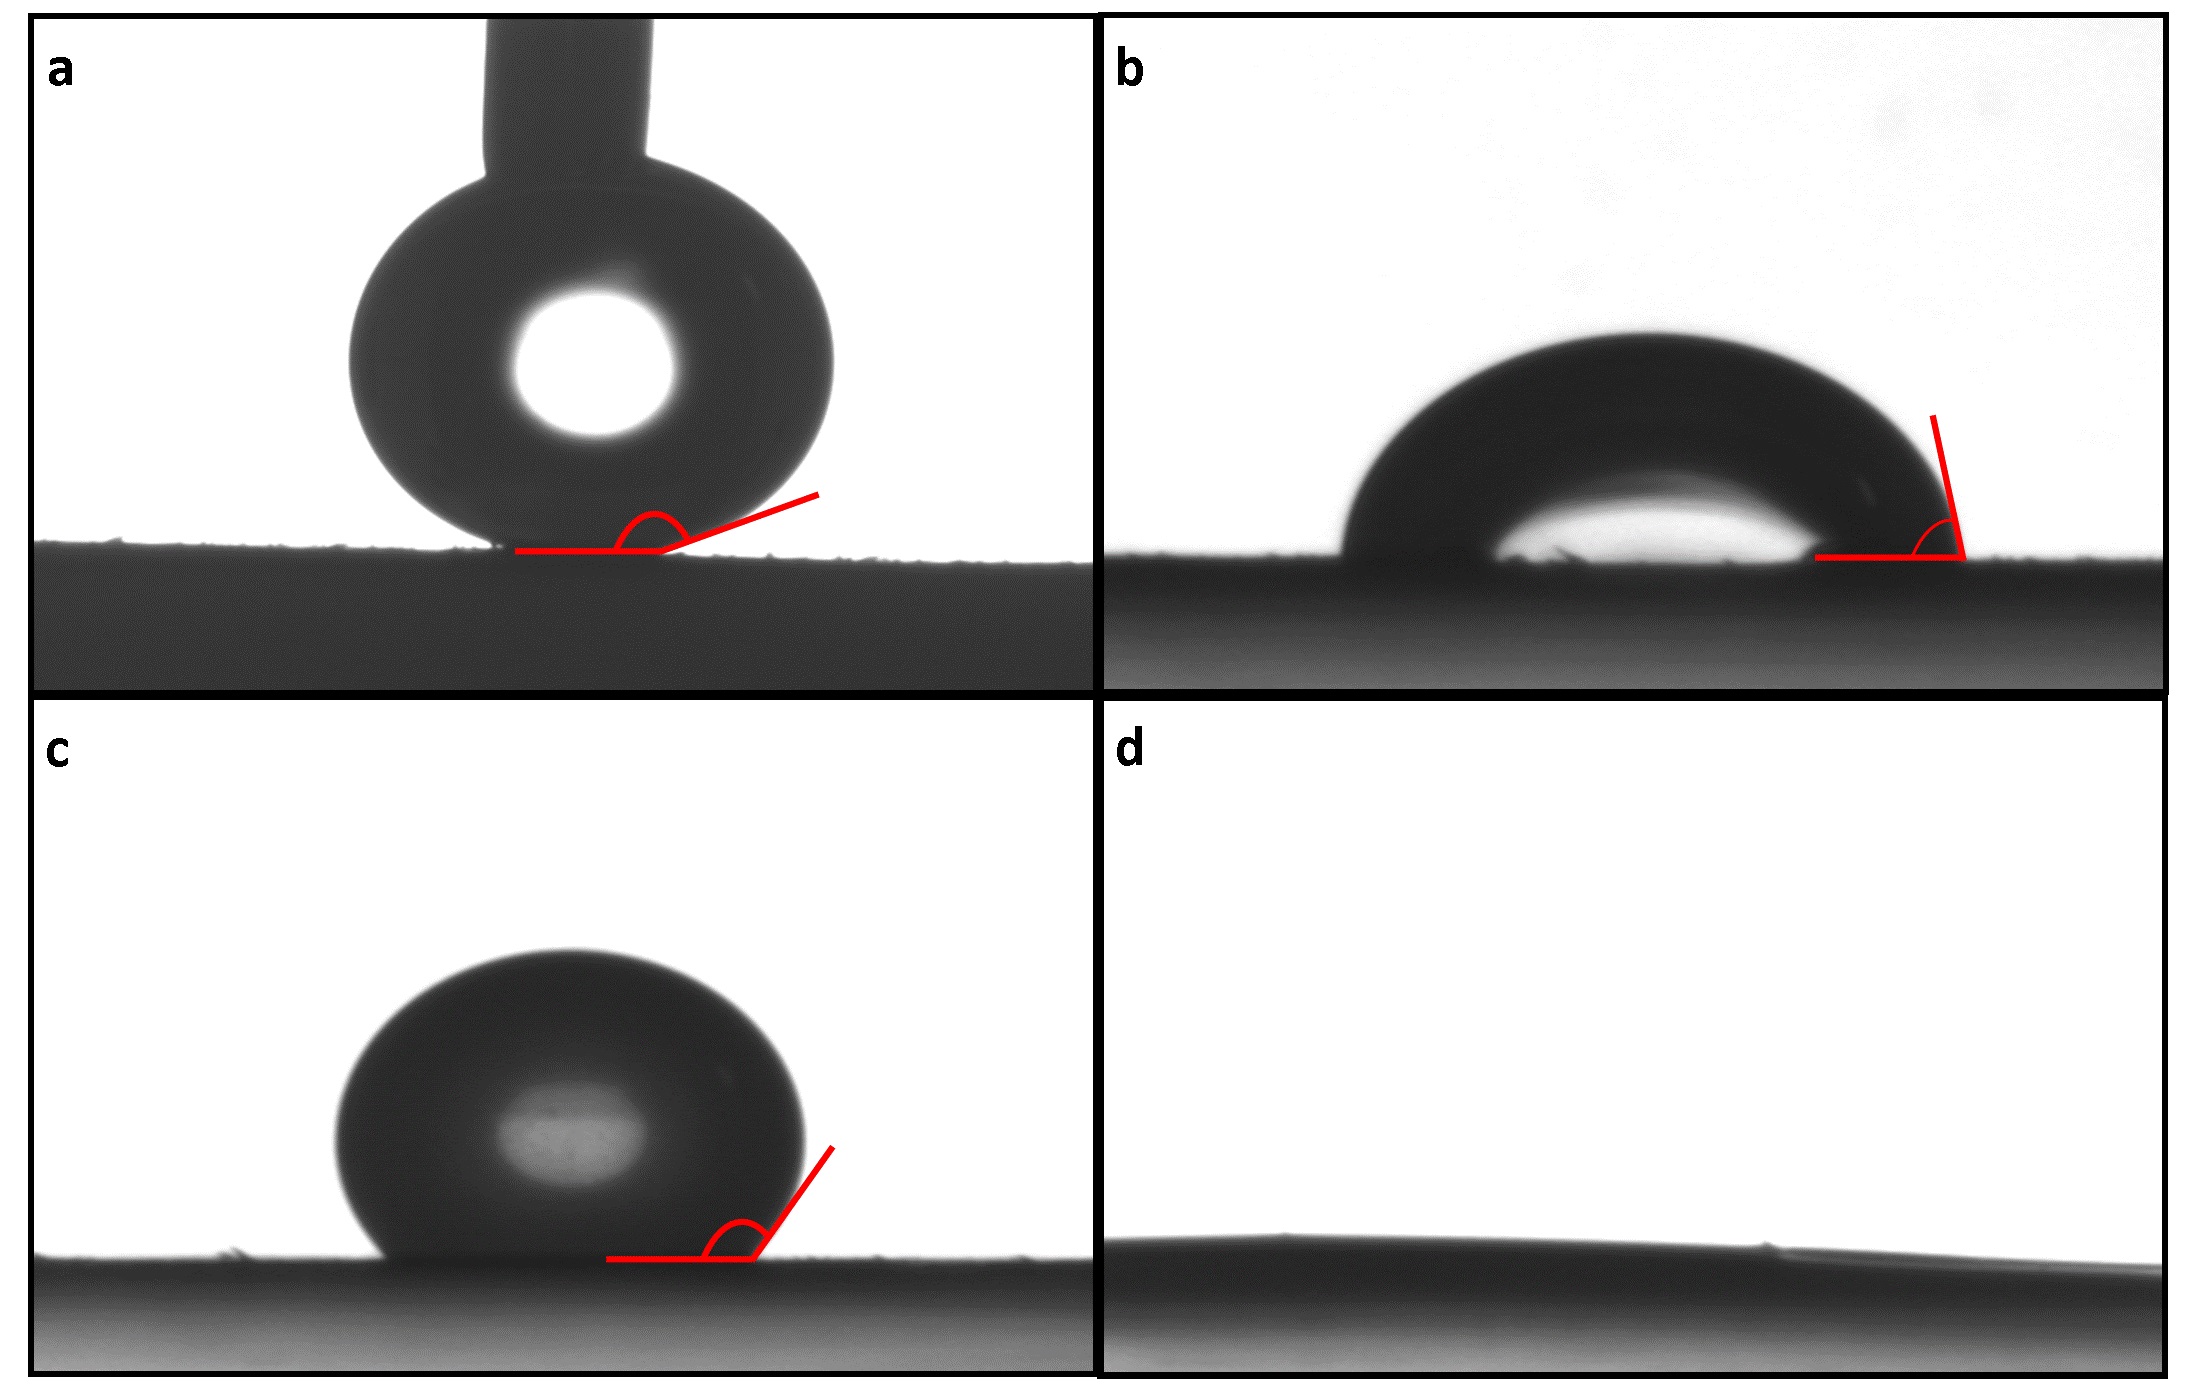
Figure 3. Profile images of phosphoric acid solution with and without added surfactants on wheat leaves. Wetting of (a) Phosphoric acid, (b) Agral® 0.1% w v-1 at 20 s, (c) LI700® 0.3% w v-1 at 20 s and (d) Genapol 0.1% w v-1 at 20 s. The drop without adjuvant has the needle still attached because the water/phosphoric acid droplet will not detach from the needle (the leaf is too hydrophobic).
In addition to the contact and spreading measurements a radiolabel was used to measure how much of these formulations was taken up by wheat plants and how much moved away from the point where it was absorbed. Despite the differences in spreading behaviour of the adjuvants, the uptake was the same for all treatments when measured seven days after application and at maturity. Between 79 and 94% of the foliar-applied P was absorbed by the wheat leaf and 24-57% of the foliar-applied P moved away from the point where it was absorbed. The translocation was higher for treatments applied at flag leaf emergence and less efficient for the treatments at tillering. Despite higher P uptake when foliar P was applied, there were no differences in the yield of treatments when compared to a control treatment with no foliar P application. In preparation for the 2015 growing season we are evaluating a range of formulations in combination with different adjuvants in a growth room experiment comparing the effect of seven products (Table 2) combined with three different adjuvants (LI700®, Hasten® and Spreadwet 1000®) on wheat growth, P uptake and peak biomass. Plants will be grown in a highly P responsive soil, with foliar fertilisers applied at flag leaf visible (GS37). The use of an isotopic technique will enable us to trace the recovery of the foliar applied fertiliser.
Table 2. Phosphorus formulations currently being evaluated in the growth room.
|
P source |
N:P:K |
pH of applied fertiliser |
|---|---|---|
|
*Phosphoric acid |
0:26.9:0 w/w |
1.4 |
|
#Ammonium phosphate |
12.2: 27:0 w/w |
4.3 |
|
*Maxi Phos Neutral ® |
7.8:12.5:0 w/w |
4.3 |
|
*Ammonium polyphosphate |
16:23:0 w/v |
6.6 |
|
*PeKacid® |
8:22:16.6 w/w |
2.2 |
|
#Sodium Phosphate |
0:22.5:0 w/w |
6.5 |
|
#Potassium Phosphate |
0:22.8:28.7 w/w |
4.4 |
|
*Pick® |
0:9.4:26.3 w/w |
8.7 |
*Commercially available fertiliser #Lab grade reagent
2014 Field Evaluation of when, what and how much?
Based on the preliminary evaluations that we had completed in the lab and growth room and keen collaborating farmers and advisers we implemented some field experiments in 2014.
Table 3. Details of field experiments in the Eyre Peninsula and Wimmera regions in 2014 where timing, foliar and sowing P rate and adjuvant combined with phosphoric acid as the P source were tested. As there were no differences between treatments, the mean ± standard deviation of grain yield for each trial are given.
|
Location |
Soil type |
Soil P status |
Sowing P kg P/ha |
Foliar P kg P/ha |
Adjuvants |
Timing |
Grain yield t/ha |
|
|---|---|---|---|---|---|---|---|---|
|
Replicated small plots |
||||||||
|
Edillilie |
Ironstone |
Marginal |
0, 15, 30
|
0, 1.5, 3 |
LI700®, Hasten®, Superstick® |
GS31, GS 39 |
#3.5±0.2 |
|
|
Lock |
Siliceous sand |
Marginal |
10
|
0, 1.5, 3 |
LI700®, Hasten®, Superstick® |
GS31, GS 39 |
#2.7±0.2 |
|
|
Cummins |
Deep clay |
NA |
15 |
0, 1.5, 3 |
LI700®, Hasten®, Superstick® |
GS31, GS 39 |
#8.0±1.0 |
|
|
Replicated paddock strips |
||||||||
|
Nhill |
Vertosol |
Marginal |
0, 12 |
0, 0.95 |
LI700® |
GS 32 |
*3.3±0.3 |
|
|
Natimuk |
Vertosol |
Adequate |
0, 11 |
0, 0.95 |
LI700® |
GS 31 |
^2.2±0.4 |
|
|
Paddock Demo Strips |
||||||||
|
Lock |
Calcareous sand |
Marginal |
10
|
0, 3 |
LI700® |
GS31 |
#2.9±0.2 |
|
|
Dimboola |
Vertosol |
Deficient |
0, 5
|
0, 0.95 |
Spreadwet® |
GS 31
|
^1.8±0.2 |
|
|
Telangatuk |
Duplex sandy loam over clay |
Marginal |
0, 6, 11 |
0, 0.95 |
LI700® |
GS 33
|
^2.4±0.4 |
|
|
Kaniva |
Vertosol |
NA |
6, 12 |
0, 0.95 |
LI700® |
GS 31 |
*2.0±0.1 |
|
#Plot Harvester yield, ^Harvest quadrat yields, *Commercial harvester yields
We had three replicated small plot trials on Eyre Peninsula and two replicated paddock strips in the Wimmera with a further four paddock demonstration strips. Across these trials we implemented a range of sowing P treatments, foliar P rates, adjuvants and timings but in all cases the foliar P was applied as phosphoric acid (Table 3).
We measured the tissue P concentration at all replicated sites at GS 31 prior to the application of foliar P and while there were no indications that any of the plants were deficient in P, we were able to pick up some higher tissue P concentrations in response to higher inputs of P fertiliser at sowing (Table 4). On Eyre Peninsula we followed up after the application of foliar P by sampling the flag leaf (which emerged after the application of the foliar spray) to see if we could measure a difference in plant P content with the two different doses of foliar P but we did not find any differences.
Table 4. Wheat tissue P concentration ± standard deviation where replicated pre and post foliar P application at selected sites.
|
Site |
Sowing P input (kg/ha) |
#Pre-application Tissue P (mg P/kg) |
Post-1.5 kg P/ha application Flag Leaf Tissue P (mg/kg) |
Post- 3 kg P/ha application Flag Leaf Tissue P (mg/kg) |
|---|---|---|---|---|
|
Replicated small plots |
||||
|
Edillilie |
0 |
4133±306 |
3533±58 |
3400±265 |
|
15 |
4600±265 |
3467±153 |
3400±100 |
|
|
30 |
5000±100 |
3500±100 |
3467±58 |
|
|
Lock |
10 |
3433±462 |
2833±404 |
3033±208 |
|
Cummins |
15 |
*NA |
3067±153 |
3000±265 |
|
Replicated paddock strips |
||||
|
Nhill |
0 |
3300 |
||
|
12 |
3600 |
|||
|
Natimuk |
0 |
3000 |
||
|
11 |
3300 |
|||
|
Paddock Demo Strips |
||||
|
Dimboola |
0 |
2300 |
||
|
|
5 |
2300 |
||
|
Telangatuk |
0 |
3500 |
||
|
6 |
4400 |
|||
|
11 |
4700 |
|||
|
Kaniva |
6 |
3500 |
||
|
12 |
3900 |
|||
*NA, not available #sampled at GS31, whole plant
All sites had grain yield recorded using quadrat cuts, while Eyre Peninsula sites were also harvested using a plot harvester and some Wimmera sites had commercial harvester measurements of grain yield per treatment. We were not able to measure a significant response to inputs of sowing soil applied or in-season foliar applied P (Table 4). Sites on Eyre Peninsula had above average winter rains with below average spring rain while most parts of the Wimmera experienced very much below average grain yield throughout the growing season. We believe that this would have played a significant role in eliminating responses to P, and to soil applied P in particular.
Conclusion
We have been able to identify sites responsive to inputs of soil applied P fertiliser and effectively load wheat plants with P applied to the foliage from stem elongation to mid-booting under controlled conditions, but we are continuing to work to find situations where foliar applied P has a significant impact on grain yield.
References
Fernandez V, Guzman P, Peirce CAE, McBeath TM, Khayet M, McLaughlin MJ (2014) Effect of wheat phosphorus status on leaf surface properties and permeability to foliar-applied phosphorus. Plant and Soil 384:7-20.
McBeath TM, McLaughlin MJ, Noack SR (2011) Wheat Grain Yield Response to and Translocation of Foliar Applied Phosphorus Crop and Pasture Science 62:58-65.
Noack SR, McBeath TM, McLaughlin MJ (2010) Potential for foliar phosphorus fertilisation of dryland cereal crops: A review Crop and Pasture Science 61:659-669.
Peirce CAE, McBeath TM, Fernandez V, McLaughlin MJ (2014) Wheat leaf properties affecting the absorption and subsequent translocation of foliar-applied phosphoric acid fertiliser. Plant and Soil 384:37-51.
Acknowledgements
Thanks to the GRDC, the Fluid Fertilizer Foundation and the CSIRO Flagship Collaboration Fund for funding. We would like to acknowledge collaboration with Dr Victoria Fernandez, University of Madrid and Dr Craig Priest, University of South Australia. Thanks to Waite Analytical Services, Tanja Lenz, Bill Davoren, Andrew Ware, Brian Purdie, Ashley Flint, Mandy Cook, George Pedler, Bill Gardner and Colin Rivers for technical assistance. We are grateful to the farming businesses of Mark Modra, Stuart Modra, Andrew Polkinghorne, Tom Dunstan, Malcolm Eastwood, Rod Pohlner, Nick Pietsch, George Burdette, Chris Smith, Stephen Hobbs and John McDougall for their collaboration in field trials.
Contact details
Therese McBeath
Agriculture, CSIRO, Waite Campus, Urrbrae, SA, 5064
08 83038455
GRDC Project Code: UA00139,
Was this page helpful?
YOUR FEEDBACK