Wheat variety response to sowing time
Author: Rick Graham(1), Peter Martin(2), Greg Brooke(3), Peter Matthews(4) and Guy McMullen(1) | Date: 25 Feb 2015
1 NSW DPI, Tamworth, 2 Howqua, Consulting, 3 NSW DPI, Trangie, 4 NSW DPI, Orange
Take home messages
- Variety response to sowing time data can be used to better match variety to sowing date.
- Variety selection and response to sowing time needs to be considered in the context of a risk management strategy.
- Trial result case study scenarios highlight the potential yield and economic outcomes, of targeting sowing window opportunities with differing genotypes.
- Growers are encouraged to retain a number of varieties with a range of maturities (yield response curves), to ensure that yield potential is maximised and risk is minimised.
Introduction
Wheat needs to flower when the probability of frost at flowering and heat stress during grain filling are as low as possible. Varieties with large differences in maturity have been released by breeding programs. This maturity difference allows the late maturing varieties to be sown when the break is early and the earlier maturing varieties to be sown when there is a late break. These differences between varieties are implicit in the ‘sowing window’ reported in the NSW “Winter crop variety sowing guide” (Matthews et al., 2014) and the QLD Wheat variety information booklet (Anon, 2014a)
Maturity of wheat varieties is controlled by vernalisation (Vrn) and photoperiod (Ppd) genes (Eagles et al., 2010). Australian varieties have been characterised for presence of some of the Vrn and Ppd genes (Martin et al., 2011). Varieties have been classified into categories of winter, facultative and spring. Varieties grown in NSW include varieties with winter, facultative and spring habit and those grown in QLD facultative and spring habit.
Variety response to changes in sowing time have been estimated using data from both sowing time and National Variety Trials (Martin and Matthews, 2013). This NSW DPI Primefact publication has been updated regularly since 2006 with the most recent version available from the NSW DPI web site.
There seem to be three basic types of genotype response - genotypes that yield better when sown early (negative slope), those that yield better when sown late (positive slope) and those that perform similarly (flat slope) across all sowing times. A range of response types exist in each of the habit groupings, refer to graphs in Primefact for examples. The different response curves indicate that there is the potential to use response to sowing date as an aid in identifying the best genotype for a particular sowing date.
Yield estimates from the Primefact can be used to better estimate the best time to change from varieties suited for early sowing, to varieties suited to later sowing. Yield estimates for some varieties with different responses in the Primefact have been graphed in Figure 1. Many of the yield response curves intersect between about year day 125 and 135, which correspond to May 5 and May 15 respectively. The data suggests for example, that if you are growing EGA Gregory and Spitfire, then the best time to change from EGA Gregory to Spitfire is about year day 132, whilst if you are growing EGA Wedgetail and Spitfire the best time to change from EGA Wedgetail to Spitfire is about year day 127. Whilst Suntop was shown to be high yielding across all sowing times.
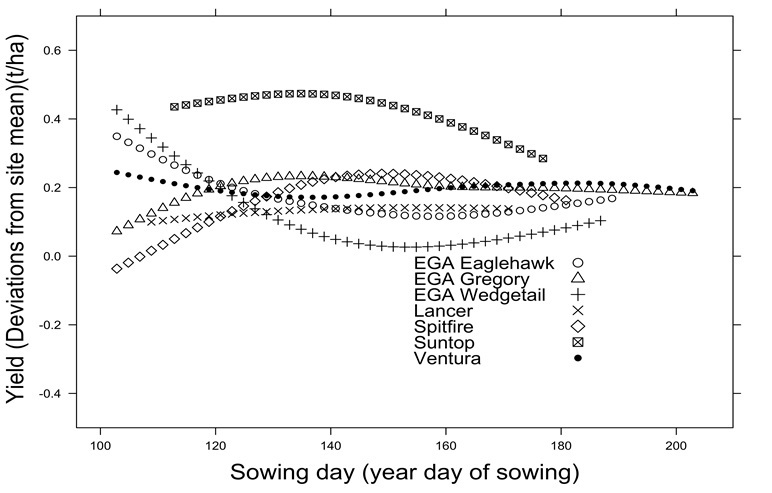
Figure 1. Variety by sowing day response curves of selected varieties
Variety response to sowing time
The combination of variety and sowing date determines the probable timing of environmental stresses (frost and heat stress) at key developmental stages, such as anthesis and during the critical post- flowering grain fill period. The relative maturity of a variety can vary widely and change with changes in sowing time and location. The optimum flowering window is considered an agronomic compromise between avoiding excessive yield loss due to frost and ensuring that flowering occurs early enough to allow a long grain fill period before heat and moisture stress reduce yield. Early maturing varieties sown before their recommended ‘sowing window’ predisposes them to increased risk of frost as well as quickening crop development. On the other hand, earlier than recommended sowing of mid to late maturing varieties, can increase total plant biomass pre-anthesis, potentially reducing the amount of plant available water for grain fill.
Variety response to sowing time trials help to determine how new varieties compare in maturity and yield with existing varieties across the sowing window at a regional level. This provides data to better inform growers about varietal response to sowing window options and therefore to better match variety with sowing time. Overtime, these trials provide greater confidence in varietal performance estimates and flowering behaviour. This is a key trial series for the VSAP project. Recent results suggest for example, that Lancer can vary in maturity relative to EGA Gregory (either earlier or later), depending on sowing time and prevailing seasonal conditions. Suntop has also been observed to vary in relative maturity with changes in location and sowing time.
Trials in the NSW northern grains region
The autumn break and subsequent sowing window in NSW can occur anywhere between March and June, with the reliability of the break being more inconsistent in Northern NSW in comparison to Southern NSW. There are also wheat varieties with a wide range of maturities available to growers in NSW and QLD, which coupled with no till farming systems, has increased the length of sowing date opportunities.
Variety selection (maturity type/genotype response) for a given sow time opportunity and potential implications, in terms of risk management are critical issues for growers. In other words, what genotype response options are available for a sowing date and what are some of the possible outcomes from these options. Although the best estimate of variety response to sowing time is from response curves reported in the Primefact, considerable variation in responses between trials/environments occurs.
To illustrate the variability of variety responses to sowing dates, data has been taken from a selection of VSAP sowing date experiments from the Western Plains, Liverpool Plains and North West Slopes and Plains. Varieties included both commercially available and advanced breeder lines, with a range of maturities and agronomic characteristics. All experiments were replicated with sowing dates spanning the growing season (April – July). Experimental details are reported in the NSW Department of Primary Industries publication ‘Northern Grains Region Trial Results Books’ (http://www.dpi.nsw.gov.au/agriculture/broadacre/guides/ngrt-results). To compare possible varietal selection yield implications, examples using VSAP sowing date experiments as ‘case studies’ are reviewed.
Case Study 1: Long season variety on early sowing
This first example from Trangie in 2014 highlights the potential implications of sowing a long season variety, in this case EGA Eaglehawk across a number of sowing dates rather than moving to a main or short season line. On the first sowing date of April 15 (year day 105) EGA Eaglehawk yielded 5.8 t/ha (Table 1). This was on average more than 2t/ha than the earlier maturing varieties Dart and Spitfire. EGA Eaglehawk was more than 1 t/ha higher yield than the main season lines EGA Gregory, Lancer and Suntop. Yield differences between varieties in the second sowing date (29 April, year day 119) were much lower than in first sowing date. In the third sowing date (14 May, year day 134) however the shorter season lines Spitfire and Dart yielded 0.8 and 0.5 t/ha, respectively more than EGA Eaglehawk. The main season lines EGA Gregory, Lancer and Suntop also yielded between 0.5 and 0.6 t/ha more than EGA Eaglehawk. In this case there is a strong argument to adopt varieties according to their appropriate sowing window (Matthews et al., 2014), and variety response sowing curves (Figure 1) based on yield (Anon 2014b). The gross returns based on listed GrainCorp contract prices also reflect the differences in yield (Table 1).
Table 1. Grain yield (t/ha) and gross economic returns ($/ha) of selected wheat varieties sown at three sowing times at Trangie 2014
|
|
Grain Yield (t/ha) |
Gross Return ($/ha) |
||||
|
Variety |
15th April |
29th April |
14th May |
15th April |
29th April |
14th May |
|
EGA Eaglehawk1 |
5.76a |
4.10abc |
2.92c |
$1428 |
$1016 |
$724 |
|
EGA Gregory2 |
4.40b |
4.14abc |
3.18bc |
$1214 |
$1143 |
$878 |
|
Dart2 |
3.78c |
3.91bc |
3.42ab |
$1043 |
$1079 |
$944 |
|
Lancer2 |
4.61b |
4.42a |
3.49ab |
$1272 |
$1220 |
$963 |
|
Spitfire2 |
3.33c |
3.85c |
3.69a |
$919 |
$1063 |
$1018 |
|
Suntop2 |
4.45b |
4.28abc |
3.42ab |
$1228 |
$1181 |
$944 |
| Benefit $/ha | $156 | $204 | $294 | |||
|---|---|---|---|---|---|---|
|
lsd (p=0.05) (TOS x Var) |
0.48 |
|
||||
Values within columns with the same letters are not significantly different at the 95% confidence level
*(http://www.graincorp.com.au/daily-contract-prices/NorthernNSW-Wheat.pdf?55 January 2015)
1H1 = $248.00/t, 2APH2 = $276.00/t delivered Trangie
Case Study 2: Main season variety across sowing dates
The second example, a 2014 time of sowing by variety experiment sown at the IA Watson Research Centre at Narrabri, demonstrated that in some situations some varieties are high yielding across a range of sowing dates (Table 2). The varieties Suntop and Lancer for example were high yielding across all sowing dates. Even on a very late sowing date of 4th July, the yields of Suntop and Lancer were equivalent to the early maturing lines Dart and Spitfire. These results highlight the yield and economic benefit of sowing in the earlier part of the optimum sowing window, with the main season varieties EGA Gregory, Lancer and Suntop achieving significant yield advantage, when sown in the correct sowing window. Sowing both Dart and Spitfire, both early maturing lines on April 23 (year day 113), well before their recommended sowing windows, resulted in significant yield reductions of 2.4 and 1.8 t/ha or 42% and 28% respectively. This is likely due frost induced sterility. The economic consequence of varietal choice versus sowing date can be seen when gross returns are compared (Table 2).
Table 2. Grain yield (t/ha) and gross economic returns ($/ha) of selected wheat varieties sown at four sowing times at Narrabri 2014
|
|
Grain Yield (t/ha) |
Gross Return ($/ha) |
||||||
|
Variety |
23rd April |
15th May |
12th June |
4th July |
23rd April |
15th May |
12th June |
4th July |
|
EGA Eaglehawk1 |
5.34a |
4.14b |
3.13b |
2.06b |
$1371 |
$1063 |
$803 |
$529 |
|
EGA Gregory2 |
5.68a |
5.10a |
4.07a |
2.74a |
$1606 |
$1442 |
$1150 |
$775 |
|
Lancer2 |
5.86a |
5.71a |
4.18a |
2.79a |
$1656 |
$1614 |
$1182 |
$789 |
|
Dart2 |
3.31c |
5.68a |
4.23a |
3.12a |
$936 |
$1605 |
$1196 |
$882 |
|
Spitfire2 |
4.07b |
5.68a |
4.55a |
2.97a |
$1151 |
$1605 |
$1286 |
$840 |
|
Suntop2 |
5.65a |
5.55a |
4.65a |
3.13a |
$1597 |
$1569 |
$1314 |
$885 |
|
lsd (p=0.05) (TOS x Var) |
0.67 |
|
||||||
|---|---|---|---|---|---|---|---|---|
Values within columns with the same letters are not significantly different at the 95% confidence level
*(http://www.graincorp.com.au/daily-contract-prices/NorthernNSW-Wheat.pdf?55 January 2015)
1H1 = $256.67/t, 2APH2 = $282.67/t delivered Narrabri
Case Study 3: A comparison of maturity types across sowing dates
The third example from Tamworth, highlights the benefit of targeting the early sowing window with the correct genotypes. Results from 2014 at Narrabri (Table 2) and Breeza on the Liverpool plains (results not shown), also report the yield penalty from sowing varieties too early and or outside their maturity/sowing window.
Although earlier maturing varieties have the potential to perform well from earlier than optimum sowing dates, for example the 2012 Tamworth experiment (Table 3). The yield advantage is often small (e.g. Yield difference; Spitfire vs. Lancer or Suntop not significant) whilst the potential yield penalty shown in Table 2, brings the risk management considerations into focus.
Table 3. Grain yield (t/ha) of selected wheat varieties sown at three sowing times Tamworth 2012
|
Variety |
26th April |
20th May |
20th June |
|
EGA Eaglehawk |
5.82a |
4.85b |
3.87ab |
|
EGA Gregory |
5.26b |
5.23a |
4.16a |
|
Dart |
5.32b |
5.44a |
3.58bc |
|
Lancer |
5.91a |
4.23c |
3.59bc |
|
Spitfire |
6.19a |
4.90b |
3.25c |
|
Suntop |
5.99a |
5.06ab |
3.71b |
|
lsd (p=0.05) (TOS x Var) |
0.41 |
||
|---|---|---|---|
Values within columns with the same letters are not significantly different at the 95% confidence level
Summary
Variety selection to best match sowing date and variety needs to be considered in the context of a risk management strategy. Trial results show the importance of targeting varieties to their appropriate sowing window, taking into account potential yield penalties of early sowing or delayed sowing, past the optimum window. Genotype yield response curves also help to quantify varietal response to sowing date and can assist in varietal selection. Given the variability of the seasonal break and hence sowing window in any given season, growers would be encouraged to retain a number of varieties with a range of maturities (yield response curves), to ensure that yield potential is maximised and risk is minimised. Importantly, when considering variety selection, growers and advisors need to consider a wide range of information including long term NVT trial analysis results, market demand and disease ratings.
Acknowledgements
The research undertaken as part of this project is made possible by the significant contributions of growers through both trial cooperation and the support of the GRDC and NSW DPI through the Variety Specific Agronomy Packages project (DAN00167) and Variety Extension in QLD project (HCP00001). The authors would like to thank them for their continued support.
Contact details
Dr. Peter Martin
Howqua Consulting
Ph: 0418 972 105
Email: howqua.consulting@gmail.com
Mr. Rick Graham
NSW DPI, Tamworth
Ph: 0428264971
Email: ricky.graham@dpi.nsw.gov.au
References
Anon (2014a). Queensland wheat variety guide 2014. Grains Research and Development Corporation and Queensland Department of Fisheries and Forestry.
Anon (2014b) Financial returns from APH wheat varieties in NSW, Online accessed 15 January 2015 [URL: http://www.ausgraintech.com/news.php?id=35]
Eagles, H. A., Cane, K., Kuchel, H., Hollamby, G. J., Vallance, N., Eastwood, R. F., Gororo, N. N., and Martin, P. J. (2010). Photoperiod and vernalization gene effects in southern Australian wheat. Crop and Pasture Science 61, 721-730.
Martin, P., Eagles, H., and Cane, K. (2011). Flowering time of wheat varieties in New South Wales. In "GRDC Update". Grains Research and Development Corporation, Young, NSW.
Martin, P., and Matthews, P. (2013). "Yield response of wheat varieties to sowing time 2012." New South Wales Department of Primary Industries.
Matthews, P. W., McCaffery, D. W., and Jenkins, L. (2014). "Winter Crop Variety Sowing Guide 2014," New South Wales Department of Trade and Investment, Regional Infrastructure and Services.
Reviewed by
Guy McMullen
GRDC Project Code: DAN00167,
Was this page helpful?
YOUR FEEDBACK