Accessing and using day degrees in field crops as a tool to assist crop management
Author: Jeremy Whish, CSIRO Agriculture | Date: 23 Feb 2016
Take home message
- Day degrees are a “temperature clock” that are a valuable tool in crop management
- Crops that are only temperature responsive are easier to work with
- Crop growth can be described by accumulating day degrees to a know target
- Day length can modify the day degree targets in some crop varietie
- Tools such as Yield Prophet® are a simple way to get accurate day degree information.
Background
Plant physiology and the stages of plant growth
Plants don’t work by calendar days – but by “day degrees”. Simply described, this means that if the average temperature in a day is 20oC then a plant accumulates 20 day degrees in one calendar day. On a course scale this temperature clock is how trees know to drop their leaves in winter and why herbs bolt to seed in spring. Day degrees are a way of measuring the physiological development of a plant. All plants receive signals from the environment that influence their rate of development. When studying the physiology of plants, distinct stages of growth have been identified and these have been formalised into keys that are often used in both plant physiology and agronomy (Figure 1). The description of crop growth stages is called the phenology of the plant.
The most well know key is the Zadocks key for wheat. Similar keys exist for canola, cotton and the pulses and describe each plant development stage. The most common and easily recognised stages are emergence, flowering, grain fill and maturity. Temperature, day length and available water are the key environmental triggers that influence plant development (Figure 1). This paper will not describe the chemical reactions that occur within the plant as a result of changes to temperature and day length. However, as these reactions occur, different hormones are released to trigger the plant to progress through its developmental stages.
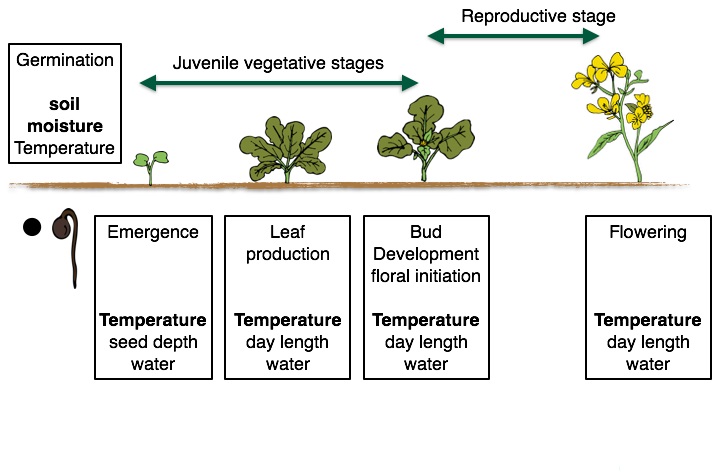
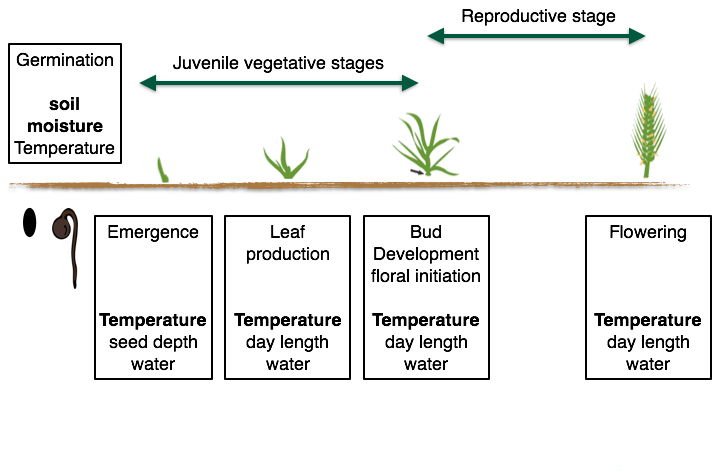
Figure 1. Growth stages for monocot and dicot crops, highlighting the different growth stages and the dominant environmental signels that influence growth in that stage.
What are day degrees and thermal time targets?
Day degrees (also known as thermal time) is a way of combining time and temperature into a single number. In its simplest form it is the average temperature recorded during a day (Figure 2). To calculate the thermal time for a plant’s development stage you accumulate the day degrees until a specific target is reached, e.g. variety X accumulates 500 degree days between emergence and flowering.
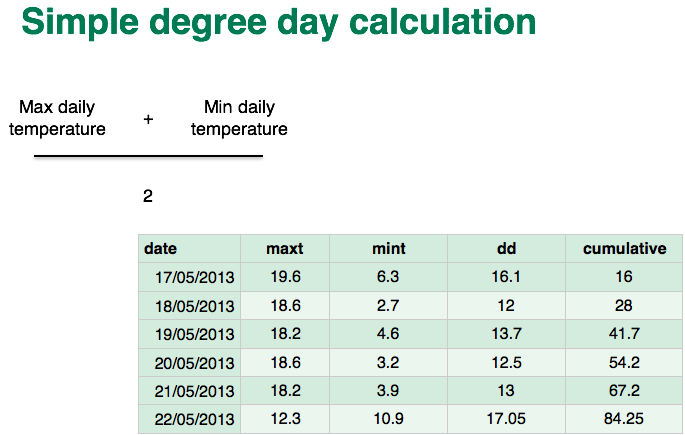
Figure 2. Calculation for simple day degrees (average daily temperature) and how the day degrees can be accumulated over time to calculate a thermal time target to move from one plant growth stage to another.
This example is the simplest form and assumes that the plant has a base temperature of 0°C, and that no growth occurs below this temperature. This is generally the case for winter crops. Summer crops like cotton and maize have not developed to grow at cold temperature. Therefore, they have a base temperature well above 0. Cotton for example, has a base temperature of 12°C so when the average temperature is below 12 no growth occurs. The use of a base temperature increases the complexity of our simple day degree calculation to:
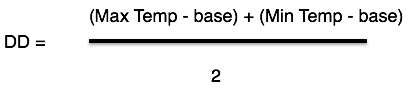
Figure 3. A simple day degree calculation using a base temperature.
Another way of thinking about this is as a switch when you are above the base temperature, in this case 12, you can accumulate Day degrees (Figure 4). This diagram also shows a maximum, that is a temperature when day degrees won’t be accumulated because it is too hot and the plant stops growing. In Figure 4 the maximum is 36 degrees.
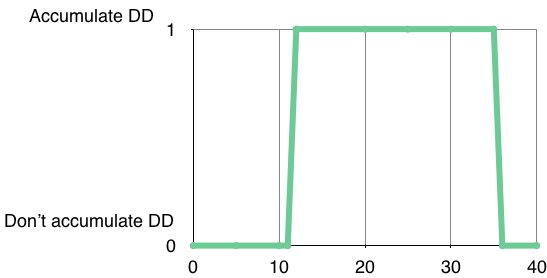
Figure 4. A representation of the cardinal temperatures (temperatures describing the upper and lower limits for plant growth) for growth of a plant that will accumulate day degrees when the temperature is above 12°C and below 36°C.
The inclusion of the maximum temperature has moved our simple average daily temperature calculation into a more complex calculation. We now have cardinal temperatures for plant growth - when we are inside these temperatures (between 12°C and 36°C for the example above) day degrees are accumulated and plant growth occurs. At this point calculating day degrees becomes more than a simple calculation and computers are needed. Crop models like APSIM use day degrees in this way to calculate the growth stages of plants. To improve the accuracy of the calculation and because computers are good at doing lots of calculations very quickly more information is included. We know that temperatures fluctuate during the day so different lengths of time will be spent within the cardinal temperature range so the day is divided into segments. APSIM uses 8, but some models that run on hourly temperature data use 24.
Why would we want to know this?
Understanding how the environment affects the growth of a plant can assist in crop management. Many management decisions are time critical. That is, for optimum results the intervention (spray application, defoliation, cease grazing or fertilisation) needs to occur before a plant reaches a particular growth stage. Identifying these stages can be difficult. For example, floral initiation can occur well before any visible sign appears in the plant. If the crops are grazed, or stressed during this floral initiation period by frost or high temperatures then a yield penalty can occur. Knowing what stage a plant is at can often help prevent yield loss or ensure untimely management does not occur.
In many environments it is important that a crop flowers within a particular window to avoid frost on one hand, and high temperature heat stress on the other hand. If you farm in a region that generally has sowing rain within a particular month you can match your varieties’ maturity to ensure you flower inside the optimum window every year. However, a sowing rain in many areas is unpredictable and may occur too early or too late. An understanding of phenology for different varieties allows for specific variety selection to ensure flowering occurs at the optimum time, and the risk of crop loss is reduced. An example of this was presented by Richards et al. 2014 and has been reproduced here with its original caption to highlight the value of understanding the mechanisms of plant development.
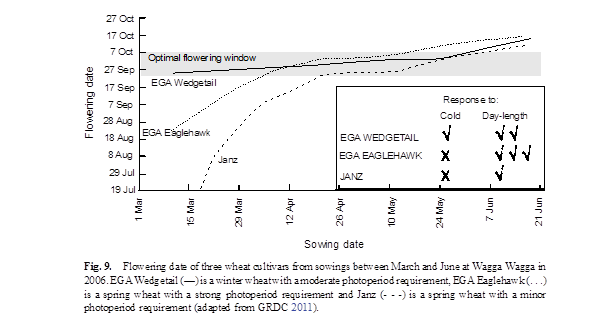
Figure 5. Flowering date of three wheat cultivars from sowings between March and June at Wagga Wagga in 2006. Reproduced from Richards et al. 2014
What crops are day degrees commonly used in?
Day Degrees are used for many specialty crops particularly in horticulture. In broad-acre cropping they are most commonly used for the management of cotton crops and Day Degree calculators are available (COTTASSIST) for growers to monitor their crops and be aware of issues, cold shock and heat shock, that can affect the crop development.
Why are they not commonly used in all crops?
Cotton is predominantly temperature sensitive, that is, its growth and development can be described using only day degrees. However, many winter crops are more complex and have additional factors that influence their development.
Phototropism is the effect of day length. As the days lengthen, the crop requires fewer day degrees to move between growth stages like flowering. For example, if we think about a canola crop with no day length sensitivity, it would not matter when you planted it. If you planted it in April it would take the same number of day degrees to flower as if you planted it in June (Figure 6). However, if the plant was sensitive to day length then as the days became longer the plant’s thermal target would be reduced requiring fewer day degrees to be accumulated and reducing the time to flowering. This complicates growth calculations because day length is not only seasonal, it is also dependent on your position on the earth surface. For example, in winter, Narrabri has a minimum day length of about 11 hours while Melbourne has about 10.5 hours. If you grew a day length sensitive crop somewhere near Melbourne that had exactly the same growth temperatures as Narrabri, it would flower earlier in Narrabri due to day length effects.
This is why recommending a time to flowering for a variety in calendar days after sowing is meaningless, unless the date of sowing and location are presented. The data presented in Table 1 show this with a real canola variety grown at Gatton in 2015. There were 5 different sowing dates and at the final sowing date, a sixth treatment was included that increased the day length to 16 hours with the use of lights. The increase in day length significantly shortened the time to flowering.
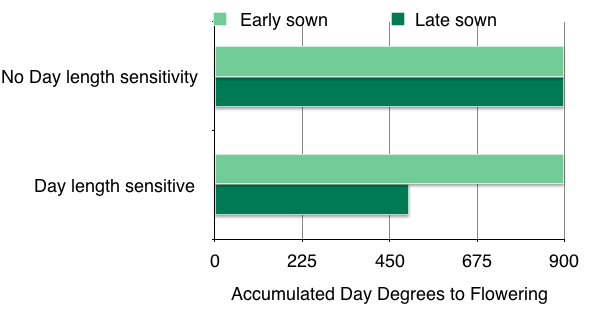
Figure 6. How day length can reduce the flowering thermal time target, that is, the number of accumulated degree days required to reach flowering.
Table 1. Observed phenological date recroded from a canola cultivar in Gatton Qld. As the day length increased the thermal time required to reach flowering reduced.
|
Sowing date |
Flowering date |
Thermal time to flowering |
Day length at flowering |
|
7-4-2015 |
7-8-2015 |
2304 |
11 |
|
21-4-2015 |
28-8-2015 |
2118 |
12 |
|
20-5-2015 |
4-9-015 |
1812 |
12 |
|
25-5-2015 |
11-9-2015 |
1812 |
12 |
|
2-7-2015 |
30-9-2015 |
1423 |
13 |
|
2-7-2015 Lights |
24-9-2015 |
1543 |
16 |
To complicate things further, different varieties within a crop type will have different degrees of day length sensitivity. Some will be minor and the variety is basically temperature sensitive, others are like the data presented above and very sensitive to day length. The inclusion of day length sensitivity has complicated the prediction of growth stages from the simple day degree calculation. However, a third plant sensitivity can occur in some winter crops and specific varieties.
Vernalisation
Vernalisation is the need for a plant to accumulate cold days before the day degree calculation can begin. In APSIM we treat vernalisation in a similar way to day degrees, but instead of accumulating temperatures above a threshold we accumulate temperatures below a threshold.
One way of thinking about this is that once a plant has emerged it is vegetative and grows leaves, and if there is no vernalisation requirement the vegetative stage immediately transfers to the juvenile stage and starts accumulating day degrees until it reaches its flowering thermal target. If the vernalisation requirement is not achieved the plant remains vegetative and continues to produce leaves. Winter type crops are the best example of this, especially when planted in warmer areas like Queensland. In these environments they don’t satisfy their vernal requirement or take time for the vernal requirement to be achieved. Once it is achieved they break out of the vegetative stage and then progress through the juvenile stage until their flowering thermal target is achieved. This delay can cause them to flower late when heat stress is an issue.
Winter wheats and winter canola are extreme examples of this, but many spring wheats and canola varieties have some vernalisation requirement. Varieties grown in Victoria can be short season, but when moved to Queensland become long season as vernalisation is not satisfied. It is not uncommon for varying degrees of vernalisation, thermal time and day length sensitivity to occur within different varieties of a crop so every variety is different and needs to be measured.
The complexity of winter crops is one of the reasons that the use of day degree calculations is not standard practice. However, the development of crop simulation models has shown that we can understand the complexity, and predict it. The use of tools such as Yield Prophet® provides a platform to accurately assess crop phenology (the measurement of plant growth incorporating vernalisation, degree days and day length) and allow specific growth stage management to be improved. However, many management decisions do not require the degree of accuracy available when using a cropping systems model. The simple day degree calculation presented in figure 1 will provide some insight as to why a crop planted at the same time as last year flowered earlier this year. A rule of thumb for wheat varieties like Gregory grown in Coonabarabran is that it will take between 1400 and 1500 degree days to flower from a May sowing. A long term climate file is all that is required to calculate day degrees. These can be purchased from the BOM web site.
Future work
There are a number of projects that are currently being funded by GRDC to improve our understanding of plant phenology and the components to describe them. Systems are being set up to accurately assess new varieties and genetic approaches are being examined to describe a variety by its DNA. Over time this information combined with tools such as Yield Prophet® will enable the type of specific management seen within the cotton industry to be practiced in grains.
Reference
Richards, R.A., Hunt, J.R., Kirkegaard, J.A., 2014. Yield improvement and adaptation of wheat to water-limited environments in Australia—a case study. Crop Pasture Sci. 65, 676-689 doi:10.1071/CP13426
Acknowledgements
The research undertaken as part of this project is made possible by CSIRO and the significant contributions of growers through both trial cooperation and the support of the GRDC, the author would like to thank them for their continued support.
Contact details
Jeremy Whish
CSIRO, Toowoomba Qld
Ph: 07 46881419
Email: Jeremy.Whish@CSIRO.au
Reviewed by John Kirkegaard
GRDC Project Code: CSP00187,
Was this page helpful?
YOUR FEEDBACK