Better profits from good soil water decisions (Coonabarabran)
Author: Dr Peter Wylie and Simon Fritsch, AgriPath | Date: 23 Feb 2016
Take home message
Profit on the average farm can be doubled by good planning of farming systems, operations, crop choice and attention to detail on crop agronomy. Crop margins can be improved by optimising soil water storage and making decisions based on soil moisture, seasonal outlook and time of planting.
Water Use Efficiency benchmarks can be used to estimate attainable yield for various amounts of soil water or the total water available, if looking back in hindsight. WUE has a wide variation and the accuracy of estimating attainable yield is improved if benchmarks are used for low, medium and high yields. For wheat and sorghum these WUE benchmarks in the Northern Region are 9, 12 and 15 kg/ha/mm for low, medium and high yields respectively.
Introduction
Average farm profit on grain farms in New South Wales, according to ABARE surveys, is around 2-3% Return on Assets Managed (ROAM). From here there is a large gap, to move up to the profits achieved by the Top 20% of benchmarked farmers, of 8 to 10% ROAM. Top performing farms produce an additional $500,000 profit each year compared to their peers.
Part of this profit gap is the difference between average farm yields and the attainable yields which result from good farming practices. Across the Northern Grain Region this yield gap is some 50 to 90%. Farm profitability would more than double with a 50% increase in yield.
Closing the yield gap requires getting a lot of things right, which requires time to be spent on management, seeking advice and planning for good crop margins and farming operations.
Good yields are about more than weeds and fertilisers. Farming systems are the key to good profits. Well-planned rotations which manage disease, nematodes and weeds can provide extra gains in crop yields, by improving timeliness and reducing grain losses from weather risks.
Yields are a product of soil water, in-crop rainfall and water use efficiency. Good farm profits depend upon making good decisions based on soil water and profit margins which might be achieved from various planting opportunities.
1. What is an extra 20mm of soil water worth
Good practices for storing rainfall during fallow may result in an extra 20mm of soil water, which on the average can result in an extra 400 kg/ha of wheat and around 50% more profit. Extra soil water not only produces more grain, it improves the water use efficiency on the total amount of water used by the crop.
The results of wheat yields at Gunnedah, modelled using APSIM, show an extra 24mm of soil water increased WUE from 11 to 12 kg/ha/mm and yield by 537 kg/ha. At Coonamble an extra 16 mm increased yield by 381kg/ha.
Table 1. Effect of soil water capacity on water storage and crop yield. APSIM modelling by G. Mclean, DAFF Qld. 2014
|
Soil PAWC mm |
Wheat |
Planting soil water |
In-crop |
Harvest soil water |
WUE kg/ha/mm |
Yield average kg/ha |
|
150 |
Gunnedah |
136 |
236 |
28 |
11.1 |
3814 |
|
180 |
Gunnedah |
158 |
236 |
30 |
12.0 |
4351 |
|
Increase |
22 |
24.1 |
537 |
|||
|
150 |
Coonamble |
126 |
201 |
16 |
8.7 |
2716 |
|
180 |
Coonamble |
142 |
201 |
17 |
9.5 |
3097 |
|
Increase |
16 |
23.4 |
381 |
Profit would increase from $280/ha to $408/ha with an extra 20mm at Gunnedah, a rise of 46% and for a yield increase of 0.47 t/ha from an extra 20mm at Coonamble, profit would rise 75% from $123 to $216/ha.
2. Optimising soil moisture
Building a healthy soil is the key to good infiltration of rainfall. In most seasons there is some heavy rainfall which causes runoff during a summer fallow. Soil cover is maximised by zero-tillage and a well-planned rotation. With minimal compaction as a result of controlled traffic the soil will have an improved infiltration rate. With high levels of organic matter input, soil structure and earthworm numbers improve over the years, rather than decline.
At Gunnedah, rainfall during a summer fallow is 400 mm on average, of which around 25%, or 100 mm, is commonly stored for the next crop. Good fallow management may increase storage of fallow rainfall to around 30% and result in average soil water storage of 120 mm.
Good control of weeds during fallow is important for good water storage. Delayed weed control or a few escapes can quickly reduce the water stored by 20 mm or more. A good rotation program is important for managing weeds and herbicide resistance.
Residual herbicides can keep down weed control costs and help in managing glyphosate resistance grass weeds. Residual herbicides can also improve timeliness by taking the pressure off the fallow spraying when weed control in hot weather is needed in a short space of time. Residual herbicides require planning and sometimes locking in a crop sequence, to avoid problems with plant back periods and effects on the following crops.
Good spray techniques are important for good weed control and soil water storage. Farmers should seek advice on nozzle selection, water rates, adjuvants, speed of spraying and weather.
3. Attainable Yield projections based on WUE
Rather than using a fixed estimate of attainable wheat or sorghum yields for a district, it is more useful to calculate attainable yield using water use efficiency (WUE) benchmarks for a particular soil type or the amount of soil water available.
WUE calculations in summer rainfall areas need to take into account soil moisture at planting and harvest. Evaporation is variable in the Northern Grains region. It should be ignored, because it shows high WUE in a dry season when in fact it can be quite low. WUE is calculated by dividing grain yield by water available, which is soil water at planting, plus in-crop rainfall less an estimate of soil water at harvest.
Data from 200 farm and trial observations on wheat in the Northern Region over the 7 years 2005 to 2013 has shown an average yield of 3.36 t/ha with a WUE of 12.3 kg/ha/mm.
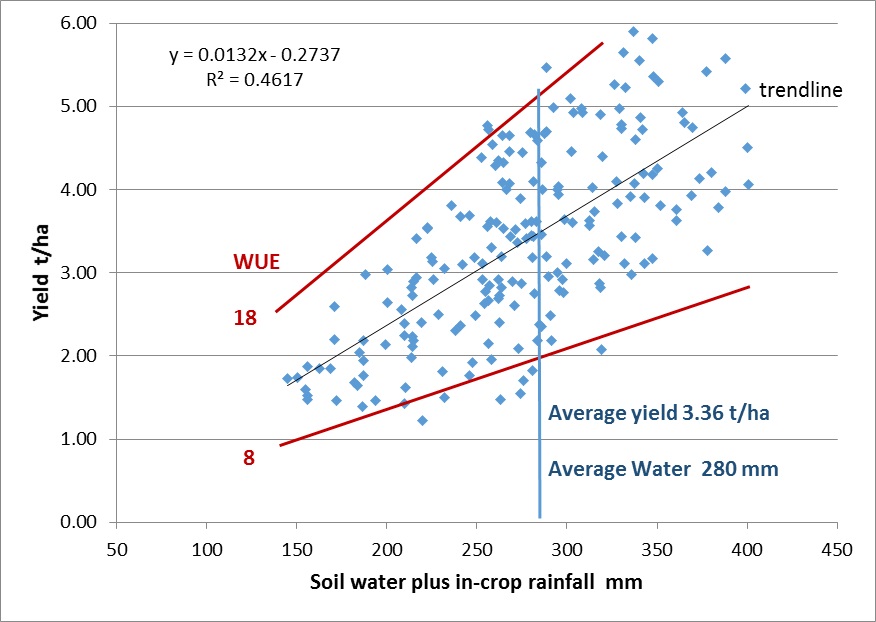
Figure 1. Yield of wheat vs water available in the Northern Grains Region (Trial data and farm records 2005-2013, collated by Agripath)
WUE is mostly within the range of 8 -18 kg/ha/mm, with the major variation being an increase in WUE as the yield increases. One explanation for WUE improving is the increase in Harvest Index, which is the ratio of grain to total above ground biomass. At low yields the harvest index is low due to fewer heads per plant, each with less grains and lower grain weight. The harvest index of wheat is 0.2 at a yield of 2 t/ha and peaks at 0.4 when yields are above 4 t/ha. (See Figure 2)
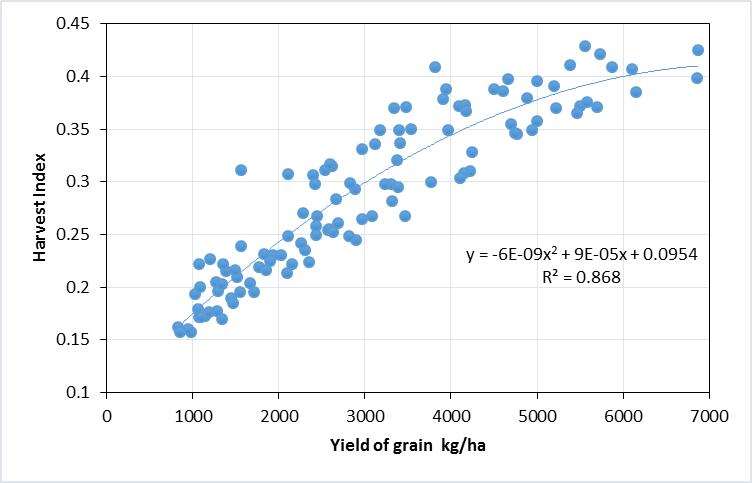
Figure 2. Harvest Index of wheat at Gunnedah (100 years of Apsim simulated yields)
Table 2. WUE data and benchmarks at low, medium and high yield levels. Data is from trials and farm records, across the Northern Grains Region: 2007-2013
|
Low yield |
Medium |
High yield |
|
|
Wheat Yield Range |
<2.5 t/ha |
2.5-4 t/ha |
>4 t/ha |
|
Observed WUE |
9.01 |
11.86 |
15.07 |
|
STDEV |
1.87 |
1.92 |
2.04 |
|
Benchmark for WUE |
9 |
12 |
15 |
|
Sorghum Yield Range |
<3 t/ha |
3-5 t/ha |
>5 t/ha |
|
Observed WUE |
8.6 |
11.4 |
15.2 |
|
STDEV |
1.48 |
2.13 |
2.60 |
|
Benchmark for WUE |
9 |
12 |
15 |
|
Chickpea Yield Range |
<1.5 t/ha |
1.5-2.5 t/ha |
>2.5 t/ha |
|
Observed WUE |
6.55 |
8.55 |
10.46 |
|
STDEV |
1.02 |
1.61 |
1.81 |
|
Benchmark for WUE |
7 |
9 |
11 |
The wide range in WUE values means that using the average of 12 kg/ha/mm is a crude benchmark. Using more than one number for WUE will improve the accuracy and usefulness of this benchmark, both in predicting yield and reviewing yield in hindsight. Data in Table 2, shows the average WUE for wheat in the Northern Region at low, medium and high yields.
These values for WUE are in accordance with the French and Schultz benchmark of 55 kg/ha of wheat biomass per mm of water transpired. When soil evaporation is included in the equation, 37 kg/ha of biomass is produced per mm of water (French and Schultz 1984). At a low yield level, with a harvest index of 0.2, there would be 7.4 kg/ha of grain per mm, rising to 14.8 kg/ha of grain, with a harvest index of 0.4 at high yields.
Attainable yields in the table below are derived from average rainfall and the WUE benchmarks derived from a mix of trial and farm data. They compare well with APSIM modelled yields which show variation in potential yield for soils of different plant available water capacities (150 to 200 mm).
Average rainfall during summer between November and May at Gunnedah is close to 400mm, with the potential to store 110 mm of soil water. An extra 28 mm of soil water at the start of the fallow brings this to 138 mm on average at wheat planting. With average winter rainfall from June to September of 198 mm this means 308 mm of water is available to a wheat crop, which at 12.5 kg/ha/mm is an attainable yield of 3.84 t/ha.
Table 3. Attainable yield estimates of wheat and sorghum in Northern NSW
|
Attainable wheat yield (t/ha) – Northern NSW - May 30 plant |
||||||||
|
|
Planting soil water |
In-crop Jun - mid-Oct |
Soil water at harvest1 |
Available water (mm) |
WUE kg/ha/mm2 |
Yield average3 |
APSIM yield 150mm4 |
APSIM yield 180mm5 |
|
Goondiwindi |
141 |
176 |
25 |
292 |
11.5 |
3.35 |
3.4 |
3.92 |
|
Gunnedah |
138 |
198 |
28 |
308 |
12.5 |
3.84 |
3.81 |
4.35 |
|
Moree |
130 |
173 |
23 |
280 |
12 |
3.36 |
2.98 |
3.47 |
|
Coonamble |
106 |
159 |
16 |
249 |
12 |
2.98 |
2.72 |
3.10 |
|
Walgett |
106 |
142 |
20 |
228 |
11 |
2.51 |
2.53 |
2.90 |
|
Attainable Sorghum Yield – September 30 plant |
||||||||
|
Goondiwindi |
149 |
203 |
28 |
324 |
12 |
3.89 |
3.61 |
4.34 |
|
Gunnedah |
136 |
274 |
14 |
396 |
13 |
5.15 |
3.65 |
v4.29 |
|
Moree |
121 |
252 |
22 |
351 |
11 |
3.85 |
3.08 |
3.72 |
|
Coonamble |
118 |
137 |
15 |
240 |
11 |
2.64 |
2.28 |
2.54 |
|
Walgett |
111 |
148 |
14 |
245 |
11 |
2.70 |
2.3 |
2.59 |
|
||||||||
4. Making decisions on double crops
Decisions on which crops to grow and the rotation program are important for good farm profit. Changes to fallow length and planting opportunity crops should be based on potential crop margins, which are influenced by soil water and commodity prices.
Too much opportunity cropping can result in a string of low margin crops and low farm profitability. Including some long fallow in cropping plans can reduce risk and boost profit in dry years. In the example below, for the Liverpool Plains, the combined margin of a double crop of mung bean and the following crop of sorghum is less than a sorghum crop on long fallow. This may not always be so and depends upon the price.
The key is to evaluate the potential margin of the crop based on soil moisture and to decide whether it is good enough to proceed.
Table 4.Margins from crops with different fallow length and price
|
|
Mungbean double crop |
Sorghum after mungbean |
Sorghum on long fallow |
Mungbean double crop |
|
Yield (t/ha) |
1 |
3.5 |
6 |
1 |
|
Price |
680 |
240 |
240 |
1200 |
|
Gross $/ha |
680 |
840 |
1440 |
1200 |
|
Fertiliser: |
30 |
118 |
178 |
30 |
|
Seed |
40 |
35 |
35 |
40 |
|
Fallow sprays |
40 |
40 |
60 |
40 |
|
Weeds, Pests |
75 |
45 |
45 |
75 |
|
Fuel & Repairs |
90 |
90 |
105 |
90 |
|
Harvest costs |
50 |
50 |
55 |
50 |
|
Freight & Misc. |
45 |
92 |
145 |
45 |
|
Labour and machinery |
160 |
190 |
215 |
160 |
|
Total costs |
530 |
660 |
838 |
530 |
|
Gross Margin |
150 |
180 |
602 |
670 |
There are advantages of long fallows, where soil water storage allows, such as reducing the pressure of harvest and allowing more use of residual herbicides – which may in turn help manage herbicide resistance and keep down the cost of fallow weedicides.
Decisions on fallows and other aspects of crop sequencing should be made to favour the most profitable or pillar crop. If sorghum is the pillar crop, then it might be appropriate to grow some or all of it on a long fallow from wheat or barley. If chickpea is the most profitable crop then it is not given the best opportunity for yield if it is all grown as a double crop after sorghum. If there is not a reasonable amount of soil water to grow as a double crop after sorghum, some chickpea may be grown on a fallow. In western districts, sorghum might well be late planted and harvested in May or June. A fallow over the next summer may store good soil moisture for a high margin chickpea crop.
5. WUE declines with soil water and planting time
One of the most important determinants of wheat yield is the decline in yield which occurs with delays in planting. The WUE of wheat declines around 0.5 kg/ha/mm for each week of delay past the optimum time around mid-May, increasing to 0.8kg/ha/mm after mid-June. Yield loss from late planting is worst in dry years with a hot finish. If WUE is 12 kg/ha/mm for wheat at Gunnedah, planted in mid-May, it will decline to around 8 kg/mm for wheat planted in early July.
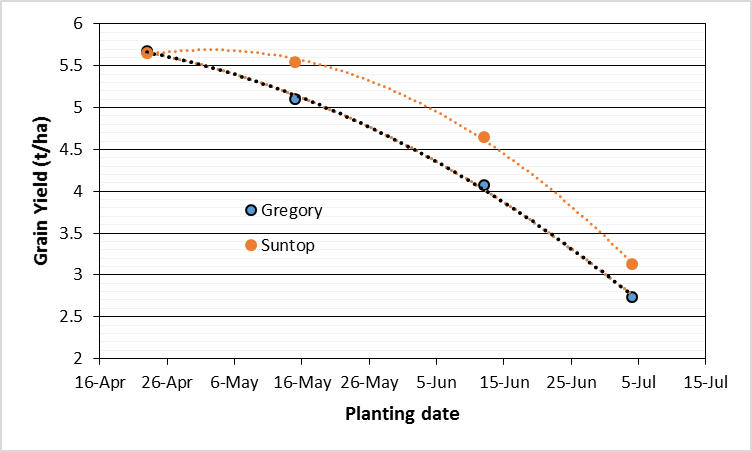
Figure 3. Yield of wheat at four sowing times, Narrabri 2014 (Graham et al 2015)
The loss in yield makes a huge difference to profit potential, with estimates of profit from wheat at the optimum time of more than four times that of wheat planted six weeks late.
Table 5. Effect of planting time on WUE, yield and profit of wheat. Data from Agripath benchmarking
|
|
Liverpool Plains |
Liverpool Plains |
||
|
Wheat planted: |
mid May |
Late June |
mid May |
late June |
|
Average water (mm) |
308 |
305 |
248 |
245 |
|
Water use efficiency |
13 |
9 |
11 |
7.7 |
|
Yield (t/ha) |
4.00 |
2.74 |
2.72 |
1.89 |
|
Price |
250 |
250 |
250 |
250 |
|
Gross $/ha |
1000 |
685 |
680 |
471 |
|
Fertiliser |
144 |
104 |
100 |
80 |
|
Seed |
30 |
30 |
30 |
30 |
|
Weeds, Pests |
75 |
75 |
75 |
75 |
|
Fuel & Repairs |
90 |
90 |
90 |
90 |
|
Harvest costs |
50 |
50 |
50 |
45 |
|
Freight & Miscell. |
92 |
75 |
74 |
62 |
|
Labour & Machinery |
181 |
181 |
181 |
181 |
|
Total costs |
660 |
605 |
600 |
563 |
|
Gross Margin |
340 |
80 |
80 |
-92 |
This loss from late planting is much greater than the risk of loss from frost. Even late plantings can be damaged by frost, while it is not much of a proposition to grow wheat with a profit potential which may be less than $50/ha. See Table 5. This effect of planting time on profit highlights the benefits of moisture seeking on wheat margins, if more wheat crops can be planted at the optimum time.
6. Using yield estimates to vary management decisions
Yield estimates using soil water and WUE benchmarks can be useful for making better decisions on fertiliser and other aspects of crop agronomy, such as varietal selection or seeding rate.
An example is that sorghum yield potential in the higher rainfall areas is likely to exceed 10t/ha in 30% of years, but yields in these years are likely to be limited by nitrogen supply. Adjusting N application at planting can be profitable using yield estimates at planting based on soil moisture and seasonal outlook. Improved soil moisture and seasonal outlook (Table 6) show rising yield estimates. The SOI is more useful for summer crop than winter crop and rainfall for much of the Northern Grains Region is greater on average with a positive SOI, rather than a negative one.
A second way to improve nitrogen supplies to improve sorghum yields in above average rainfall years is to regularly apply feedlot manure or recycled organics. An application of 10 t/ha of feedlot manure will contain around 160 kg N, mostly in an organic form. In a dry summer there will be very little nitrogen released from the manure, but in a wet season when conditions are favourable, 30 to 50 kg of N may be mineralised. If an additional 40 kg N becomes available in a wet season, it could be enough to improve sorghum yields by 2.5 t/ha, assuming grain protein in a high yielding year is likely to be around 8%.
Table 6. Nitrogen required by sorghum according to soil moisture and SOI – Gunnedah
|
Soil water mm |
In-crop rainfall SOI <-5* |
Average expected rainfall |
In-crop rainfall SOI >+5* |
Expected WUE kg/ha/mm |
Yield estimate t/ha |
Nitrogen required kg/ha** |
|
80 |
175 |
10 |
2.55 |
43 |
||
|
80 |
205 |
11 |
3.13 |
53 |
||
|
80 |
220 |
12 |
3.60 |
61 |
||
|
160 |
175 |
14 |
4.69 |
80 |
||
|
160 |
205 |
15 |
5.47 |
93 |
||
|
160 |
220 |
16 |
6.08 |
103 |
||
|
*SOI is for August and September prior to a Sept 30 sowing, with data from Rainman. |
||||||
A third way to improve the supply of N for a good year is simply to increase the annual N fertiliser rate. If the rate was increased to 22kg N/t., rather than a 17kg/t target, this would result in an extra 30 kg N being applied for a yield estimate of 6 t/ha. The extra N could increase yield by around 1.5 t/ha in a good year. If 4.5 tonnes of extra sorghum was produced in the highest yielding 3 years over a 10 year period, this could be worth $1000 for an outlay of $420/ha. In the drier seasons, some of the extra N would be exported from the farm as higher protein levels in the grain, but overall the extra N might contribute to a small increase in N reserves in soil organic matter.
7. Rotations and resilient farming systems
Good farming systems involve crop selection, rotations, sound practices for zero-tillage and planting, combined with good risk management. Well-planned rotations which manage disease, nematodes and weeds not only improve crop yields, they can improve timeliness, keep down costs and reduce grain losses from weather risks.
It is not possible to make good profits without managing problems such as nematodes and crown rot. In combination these two problems could be dragging down wheat yields by 20% and profit by 40%. Nematodes require a plan to keep soil populations low, using break crops, such as sorghum and canola. New varieties of wheat, such as Suntop, offer potential to suppress nematode populations.
Management of weeds, particularly glyphosate resistant summer grass weeds, is another factor driving decisions on rotations. Rotation plans which include some fixed cropping plans and long fallows can pave the way for increased use of residual herbicides to help reduce costs and to better manage glyphosate resistance.
Timeliness of operations, a poor strike or harvest losses can affect yield and drag down profit. A rotation program which provides diversification of crops can make a big difference to the timeliness of planting and harvesting. For example, a program with barley, wheat and chickpea has a planting and harvest window spread over two or three weeks, rather than one week for wheat alone.
8. Monitoring moisture and analysing data on yield, WUE and profit
In most years, somewhere on the farm, a high yielding area of crop shows what is possible. Yield maps, EM surveys, soil moisture, and fertility testing and trials measured by yield maps can help to understand yield differences and the limitations of soils on a farm.
Moisture is the key to grain yields and measuring soil water holding capacity and soil water at planting time can improve decision making. EM measurements allows rapid assessment of soil moisture and soil moisture variability across paddocks.
Benchmarking of crop yields and WUE can indicate where there may have been problems with such things as fallow moisture storage, timeliness or not enough fertiliser.
Acknowledgements
The research undertaken as part of this project is made possible by the growers and the support of the GRDC, the author would like to thank them for their continued support. Some of the information comes from a GDRC project, 'The economics of closing the Yield Gap in the Northern Grains Region'.
References
French R. and Schultz J. 1984. Water use efficiency of wheat in a Mediterranean-type environment. 1 The relation between yield, water use and climate. Aust. J. Agric. Res. 35(6) 743-764
Graham R. 2015. Wheat variety response to sowing time. GRDC Grains Research update Goondiwindi.
Contact details
Simon Fritsch
Agripath Pty Ltd
21 Bourke St, Tamworth, NSW
Email: simon@agripath.com.au
Peter Wylie
Agripath Pty Ltd
4 Alfred St, Dalby, Qld 4405
Mb: 0429 361 501
Email: peterwylie@agripath.com.au
Varieties displaying this symbol beside them are protected under the Plant Breeders Rights Act 1994.
Was this page helpful?
YOUR FEEDBACK