Crop yield impacts and management of soil acidity in Central Western NSW
Author: John Small, Central West Farming Systems | Date: 26 Feb 2016
Take home message
- Soil acidification is a natural process accelerated by high crop yields, fertilizer use and potentially direct drilling and stubble retention. It is an unseen cost of doing business.
- To maintain a good soil pH profile producers should aim for a pH(CaCl) above 5.0 in the 0-10cm of topsoil or 5.5 if subsoil acidity issues are present. The target in the 10-30cm zone is greater than pH (CaCl) 4.8.
- Retesting during 2015 of historic soil pH datasets confirms soil profiles continue to acidify.
- Left unmanaged sub soil acidification is likely to occur in most Central West NSW soils.
- Liming needs to be thought of as a farm input, like checking and changing the oil in the tractor, (maintaining capital) rather than buying urea (dollars returned per dollar invested).
- Cost in managing soil pH are easier to quantify than returns.
Background
Soil acidification is the natural process accelerated by agriculture. Most produce (grain, meat, fibre) is alkaline and harvesting it causes an increase in acidity. Agriculturally generated sub surface soil acidity is a threat to the sustainability of intensive cropping in low rainfall districts. Preventing sub surface acidity is the preferable option, as the cost of attempting amelioration after sub surface acidification has occurred is time consuming, expensive and most likely cost prohibitive. The vast majority of research on ph management, liming response and economics has been conducted in the medium and high rainfall grain production zones in eastern Australia or in Western Australia. Unfortunately the risk reward scenario for producers in low rain areas of NSW, where pH is likely to be a developing issue, means these research findings and economic models are not readily transferrable.
Soil acidification is not as obvious as other soil issues such as salinity, erosion or structural decline. Symptoms are less visible, production declines are gradual and these changes are often attributed to other factors such as weather. To maintain a good soil pH profile producers should aim for a pH (CaCl) above 5.0 in the 0-10cm of topsoil or 5.5 if subsoil acidity issues are present. The target in the 10-30cm zone is greater than pH (CaCl) 4.8.
In soils where aluminium is present a small drop in pH can result in a large increase in soluble aluminium which retards root growth, restricting the crops ability to access water and nutrients. At harvest this results in a yield penalty and smaller grain size, usually most noticeable in seasons with a dry finish as plants have restricted access to stored subsoil water for grain filling.
The rate of acidification will depend on the pH buffering capacity of the soil, its initial pH, cumulative crop yields and the frequency of use of acidifying fertilisers and production of legume crops. Heenan et al reported that a higher rate of acidification was observed with direct drilling and stubble retention at Wagga Wagga. These findings are not a reason to stop stubble retention or using legume break crops, as there are other indicators that business profitability and soil health are significantly improved by these practices. The key message is to be conscious of a gradual decline in soil pH and to take a proactive approach towards limiting the decline.
pH trends in the Central West
The GRDC funded “CWFS Soil acidity and pH management for central west farming districts” project involved identifying and retesting historic pH monitoring sites from previous publicly funded projects. New monitoring sites were also established and GPS located for future reference. A problem encountered in retesting historic sites was accurately identifying the paddock locations and precisely where samples were collected. GPS locating of sample sites was not a technological option when these sites were originally tested.
Six sites were confidently identified and the results of testing are shown in table 1. The critical observation is that pH has generally declined in the 14 years since initial testing. At 3 of the farms topsoil pH is more than likely resulting in a yield penalty. Changes in land use practice may help in explaining the observed change in pH. The Nymagee site had changed from cropping to native pasture. Cropping programs at Tottenham and Euabalong West remained relatively unchanged in mixed farming systems. The sites at Wirrinya, Ungarie and Condobolin West have become more intensive cropping enterprises with more fertilisers and legumes in the cropping cycle, pH at these sites would be likely limiting grain production and sub surface acidification is imminent.
2014 pH at depth data is presented in figure 1. The observed increase in pH at depth is typical of the red brown soil types of the region. Comparisons for pH at depth from 2000 and 2014 are difficult due to the differences in sub sampling depth increments used. Averaging pH readings per depth increment, (practically what happens in the field during sub sampling) and reassigning soil depth increments gave some comparable data. Using the resulting rate of change for pH over the last 14 years, projections have been made for possible readings of Condobolin in 2028 and they indicate a difficult soil environment for cropping. Results are presented in figure 2. The projections need to be considered with caution. Heenan, et al, demonstrated that when a crop system is established, based on a relatively stable long term rotation and management programs, soil pH drop and after a period of time soil pH tend to stabilise or at very least the rate of soil acidification slows. It appears the time before the pH stabilises depends heavily on the paddock history prior to the management change.
Table 1. Observed changes in pH at 6 locations between 2000 and 2015
|
|
Nymagee |
Wirrinya |
Ungarie |
Condobolin west |
Tottenham |
Euabalong West |
|
2000 pH (CaCl) |
4.8 |
4.9 |
5.2 |
4.8 |
5.2 |
5.7 |
|
2015 pH (CaCl) |
5.7 |
4.4 |
4.6 |
4.5 |
5.0 |
5.9 |
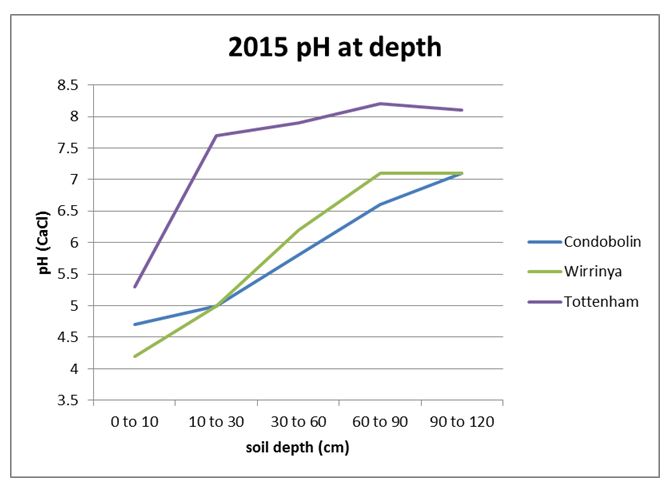
Figure 1. 2015 observation of soil pH at depth for 3 selected historic monitoring sites
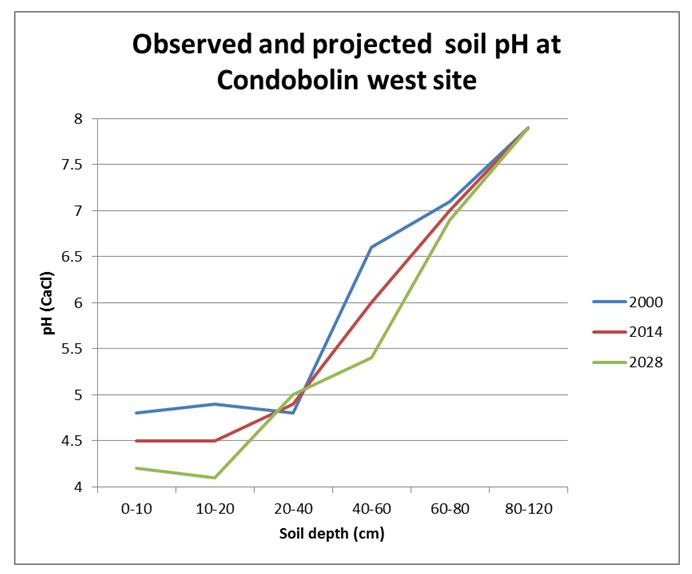
Figure 2. Observed and projected soil pH at Condobolin west site (2000-2028)
Is liming worthwhile in Central West districts?
The application of lime to manage soil pH is not new science, it has been known since Roman times. Current knowledge clearly identifies that to maintain a good soil pH profile producers should aim for a pH (CaCl) above 5.0 in the 0-10cm of topsoil or 5.5 if subsoil acidity issues are present. The target in the 10-30cm is greater than pH (CaCl) 4.8. The economics of applying lime in low rainfall environments is not as clear cut as in medium to high rainfall districts where yields are generally higher and more consistent, resulting in potentially quicker acidification due to product removal, a potential higher dollar loss in production per hectare over time and higher land values which support and or justify more intensive maintenance liming programs.
Agriculturally induced soil acidification is using up the capital in your farming system. A fundamental mindshift is required in low rainfall districts so the application of lime is considered an integral part of maintaining the system’s financial and environmental capital base rather than being considered a stand alone crop input.
If a yield response to liming is observed the reality is that production has historically been lost to soil acidity. Where there is no response but liming was undertaken on the basis of pH and soil testing to determine rates, the liming was not wasted but acting to maintain a good soil pH profile and will prevent yield decline in the future. pH management and the application of lime should be considered similar to changing the oil in the tractor motor according to the manufacturers specifications to maintain reliability and asset value as opposed to purchasing a crop input, like nitrogen fertiliser, to improve yields or protein and receive a dollar return for the investment in a cropping cycle.
Other GRDC supported initiatives have produced models and computer based decision support tools to aid producers planning. Two calculators may be of use and are available at the following web address’s;
SoilQuality.org Lime Calculator - this calculator is relatively simple and requires a nominated yield improvement over time to be nominated from liming to calculate the $ return. Such an approach is very simplistic. It does not allow for a yield reduction over time if soil pH is allowed to decline. As suggested earlier where there is no response but liming was undertaken on the basis of pH and soil testing results, the activity is about maintaining farm capital rather than considering the application of one variable crop input over another.
Liebe Farming Systems Group Lime Calculator - this calculator was developed in Western Australia by the Liebe Farming Systems Group which represents some low rainfall cropping areas of the state. It is very in depth and naturally focused on Western Australian conditions but is potentially useful for local producers. The CWFS “Soil acidity and pH management for central west farming districts” project creates partnerships with the Western Australian owners of the calculator and the intention is to develop a similar model suitable for low rainfall cropping districts in NSW, but this a few years away.
As stated previously a change in thinking is required in low rainfall districts so the application of lime is considered an integral part of maintaining the system’s financial and environmental capital base rather than considered a stand alone crop input. Remember more like justifying changing the oil in the tractor rather than justifying buying urea. If this occurs there are clearly two opportunities when liming should be considered. Firstly following those financially rewarding years when returns allow for replacement and improvement in capital items on the farm (soil is part of the farms capital equipment). Secondly in stubble retained systems where the trend is for “strategic” cultivation in the rotations. Lime incorporated into the topsoil acts quicker than surface applied lime. Is should be noted that the impact of take-all disease appears greater immediately following liming so if the disease is a likely concern inoculum levels should be managed in the paddock in the seasons prior to lime applications and wheat production.
Commercial calculators are also available through the Back Paddock Company site.
Developing and costing of a soil pH management program
The cost and returns of a pH management program is not as comparable between farms as are operations such as sowing, spraying or harvesting; no relevant benchmarks for low rainfall districts likely exist. Individual business’s will need to develop their own programs and subsequent costings using accurate soil testing and interpretation as the basis. Generally returns are more difficult to quantify than costs.
Figure 3 provides a quick reference to an individual paddock’s pH and its likely impact on crop performance. Understanding the effects of pH levels on crop performance in a particular paddock requires accurate spatial information about soil chemistry across that paddock and an understanding of what of the limiting factor of crop performance pH is influencing. For example if acidification is resulting in increasing availability of aluminium than response to liming is likely to be seen quite quickly. If alternatively decreasing pH was making phosphorus less available then economic return would more than likely be lower and slower to achieve.
pH management is about maintaining the farms capital value. Unfortunately it does not readily show up in a valuation like other long term investments such as a silo complex or new fencing. It is reasonable to expect though that an ability to demonstrate good soil pH management would add to a property’s value if it was sold.
If on the basis of historical soil test declining pH levels are observed a time line for remediation could be developed. Figure 4 is a decision support tree that highlights likely responses. A guide to application rates is presented in Table 2 but it is critical that final rates be determined on the basis of sound soil sampling procedures and interpretation of test results.
Costs are easier to quantify then returns and fall into 3 basic variables, namely:
1. Cost of collecting and interpreting accurate spatial soil chemistry data. Results to any amelioration of soil pH will only be as good as the data used to develop application rates. Over liming, particularly on light soils can lead to nutrient tie up issues and create as many agronomic problems as the liming was attempting to resolve. Approaches to data collection vary from basically spending time in the field with a simple soil pH indicator kit to rapid pH assessments across a paddock on a fee for service basis from commercial suppliers.
2. On farm cost of lime. Lime quality and freight cost from source need to be considered to establish a cost per hectare. A simple measure of lime quality or purity is its neutralising value. It is a measure of the amount of acid on a weight basis the lime will neutralise. The higher the value the lower the rate of lime per hectare required to achieve the same change. The use of neutralising value to develop application rates per hectare is a similar concept to using fertiliser analysis in developing application rates.
3. Cost of spreading. Obviously only consider lime sources that physically can be spread using owned machinery or contractors available in the district. Some “manufactured granular” as opposed to mined and sieved lime products are becoming available. Generally they are more expensive per tonne but may offer significant advantages in terms of material handling and application for some producers.
Careful consideration and costing of the options based on the aims of your pH management programme could lead to significant savings in cost over time.
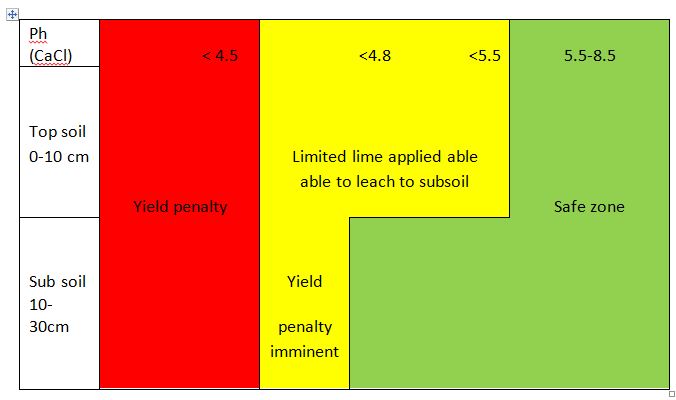
Figure 3. The likely impact of liming. (Dept of Food & Agriculture Western Australia)
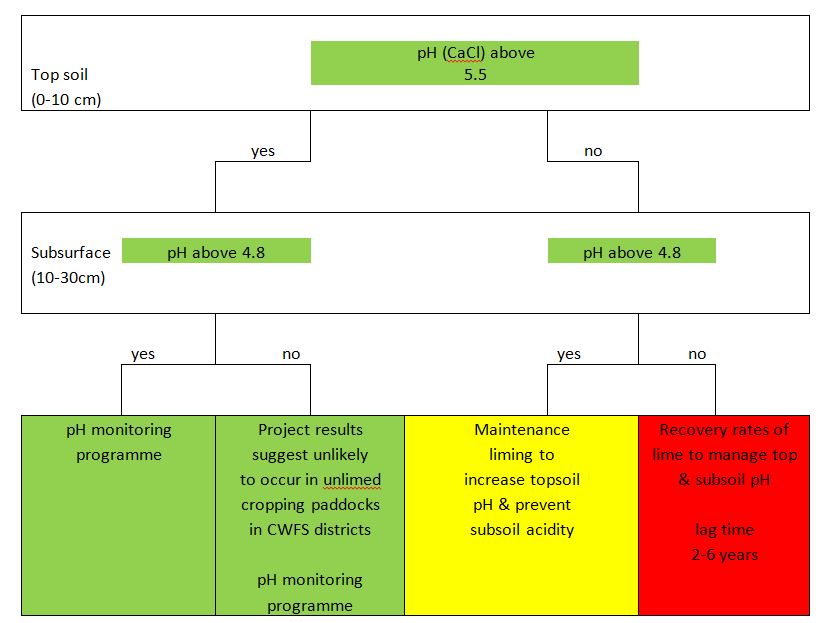
Figure 4. A decision support tree to aid liming decisions
(Dept of Food & Agriculture Western Australia)
|
Soil test |
Lime required (t/ha) to lift pH in top 10 cm |
|||
|
ECEC |
From 4.0 |
From 4.3 |
From 4.7 |
From 5.2 |
|
1 |
1.6 |
0.8 |
0.3 |
0.2 |
|
2 |
2.4 |
1.2 |
0.5 |
0.4 |
|
3 |
3.5 |
1.7 |
0.7 |
0.5 |
|
4 |
3.9 |
2.1 |
0.9 |
0.6 |
|
5 |
4.7 |
2.5 |
1.1 |
0.7 |
|
6 |
5.5 |
3 |
1.2 |
0.8 |
|
7 |
6.3 |
3.3 |
1.4 |
1 |
|
8 |
7.1 |
3.8 |
1.6 |
1.1 |
|
9 |
7.9 |
4.2 |
1.8 |
1.2 |
|
10 |
8.7 |
4.6 |
1.9 |
1.3 |
|
15 |
12.5 |
6.7 |
2.8 |
1.9 |
Table 2. A basic guide to application rates of lime (fine lime,NV>95%) required to alter soil pH.
(NSW DPI Soil acidity & liming Agfact)
Soil pH management and precision agriculture technologies
Similar to most soil characteristics spatial variability of soil pH can be significant, particularly in the large area paddocks common in the low rainfall zone. The development of management zones and use of variable rate technology in lime application is already commercially available. A distinct advantage with using variable rate application technology in liming is that it limits the potential for higher than required application rates in some areas of the paddock that would occur in a blanket single rate application. Excessive rates can impact crop performance similarly to not managing pH at all.
The starting point to development of management zones is quality paddock mapping. Commercial providers of rapid pH assessments across the paddock are operating in NSW. Figure 4 and 6 below are examples of commercially available services. They were supplied by a cooperating farmer in the project and form the basis for their pH management.
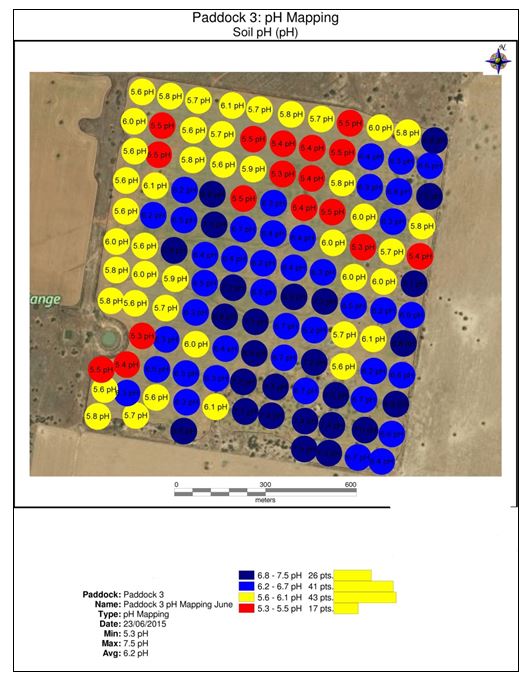
Figure 5. Results of pH assessments across a paddock. Note spatial variability
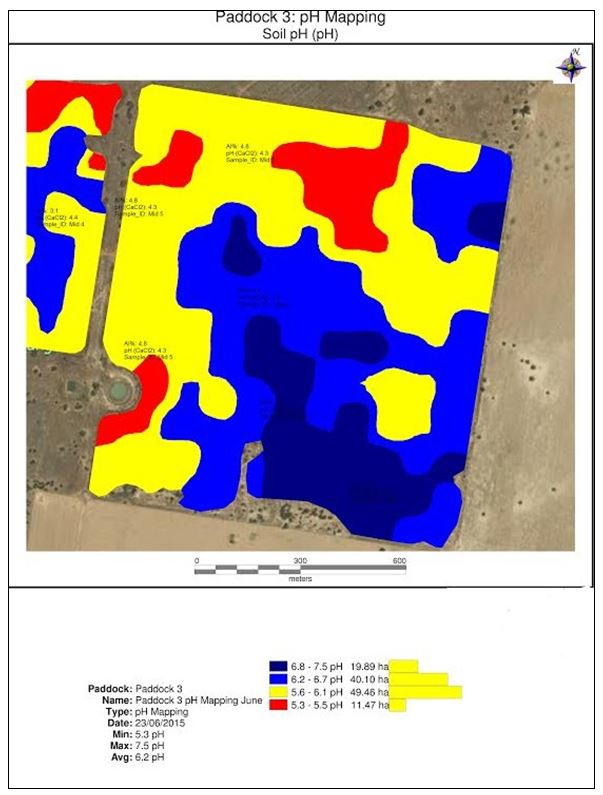
Figure 6. Management zones developed from pH assessments in figure 4
References
Heenan, D.P., McGhie W.J., Conyers M.K. “Soil pH change over time in relation to rotation, N fertiliser, stubble management and tillage”. 1998
Acknowledgements
The research undertaken as part of this project is made possible by the significant contributions of growers through both trial cooperation and the support of the GRDC. The author would like to thank them for their continued support.
I would also like to acknowledge the support of Nick Hill, former CWFS project manager who was responsible for the data collection reported in this paper.
Contact details
John Small
Central West Farming Systems
PO Box 171, Condobolin 2877
Ph: 02 951009
Mb: 0488 951 001
Email: john.small@dpi.nsw.gov.au
GRDC Project Code: CWF00119,
Was this page helpful?
YOUR FEEDBACK