Background
The Making Better Fertiliser Decisions for Cropping Systems in Australia project (BFDC) aims to provide the fertiliser industry, agency staff and agribusiness advisers and growers with knowledge and resources to improve nutrient recommendations for optimising crop production. The BFDC database is a national database of historical fertiliser response data (50 years) for the main grain crops grown in Australia. BFDC is recognised by the Fertiliser Industry Federation of Australia as the best available data for supporting the decision tools that fertiliser industry members use as the basis for interpretation of soil tests and formulating recommendations.
Fertiliser decisions made by grain growers and their advisers should all start with, and rely on, objective knowledge of the fertility status of paddocks. These decisions need to account for the nutrient requirements of plants for growth, nutrient availability in soils, and nutrient losses that can occur during crop growth (e.g. de-nitrification or erosion).
Making better decisions about soil nutrient management and crop nutrition starts with gaining an understanding of how soil fertility fits into the whole crop production process. The BDFC Interrogator provides information about soil test critical levels for the four nutrients that frequently account for 20-30 per cent of variable crop production costs – nitrogen (N), P, potassium (K) and sulphur (S).
Different soils have different critical nutrient ranges and differing P availability. Understanding your soil type and its critical P values is crucial to making informed fertiliser decisions in cropping. BFDCII allows you to look at different soil types, cropping scenarios and many other agronomic factors that may come into play in a season.
Methodology
Historic soil test crop response trials were manually entered into the BFDC database stretching back over 50 years. This data was then used, as well as current research data sets, to produce a soil test calibration for N, P, K and S. The data is presented in critical nutrient levels for 80 per cent, 90 per cent and 95 per cent of relative yield, as well as a confidence range for the relative yield levels. The critical nutrient ranges are across all soil types and can be interrogated for many agronomic fields such as rainfall, soil pH and yield. The major crops are included in the database and the soils are classified under the Australian soil classification system. The data sets are classified into A and B data sets depending on how much information is supplied and the trial’s scientific vigour. When filters are applied to the database, you can interrogate it to look for factors that may affect P responsiveness, factors such as pH, growing season rainfall, and tillage practice.
Results and discussion
The BFDC database holds extensive historic data for 5,698 key N, P, K and S trial treatment series for different grain crops and soil types across Australia. Each trial has a soil test and relative grain yield data that enable users to determine the critical soil test ranges for a variety of management and growing conditions. These include farming system, growing season rainfall and paddock history.
The data set is currently still being added to via the online data entry tool through researchers from the More Profit from Crop Nutrition (MPCNII) project, as well as other agency researchers and agribusiness.
The database allows the authorised user to interrogate the database across different soil tests, tillage systems and growing season and allows the user to be able to calibrate a soil test crop response calibration for their own particular conditions. For example, a consultant wishing to know the critical nutrient range for a red chromosol for wheat can interrogate the database and find the levels required for 80 per cent, 90 per cent and 95 per cent relative yield post 1987.
For critical P values, there is much variance in different soil types with other factors coming into play such as tillage, rainfall and time of sowing. Interrogating the database and filtering for years that full cultivation practices were common show that the critical P values were a lot lower than when growers changed to minimum till practices. This may be attributed to the nutrient stratification that can occur within minimum or no till situations. The P may be concentrated in the top few centimetres and not throughout the profile where the crop can more readily access it.
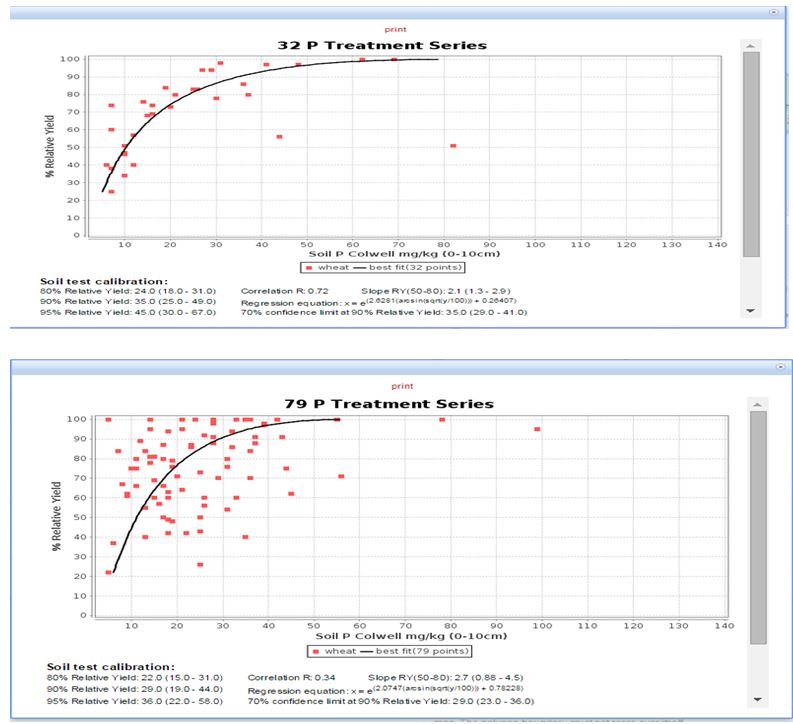
Figure 1: Colwell P critical nutrient ranges for wheat on different soils 0-10cm.
Changing farming systems from full cultivation to minimum till has had an effect on the critical nutrient levels especially in P. Under minimum till practice, the data shows that a higher nutrient level is required to achieve a given relative yield. This can be partly attributed to nutrient stratification under minimum till conditions.
Under MPCNII there is a continuation of work by Col McMaster at Cowra Research station looking at different rates of P under different cultivation regimes.
Roger Armstrong has a third year PhD student, Katherine Dunsford, under project DAN00167. Roger has been looking at this issue for a few years and is continuing his research.
MPCNII is also looking at N x P interactions correlating with high rates on N and the corresponding rates of P required to meet crop demand. This is being undertaken by project UA00154 (A/Prof. Timothy Cavagnaro from Adelaide). Col McMaster from NSW DPI is also continuing to look at P by sowing time interactions at Cowra Research Station.
Conclusion
Soil testing remains the most critical tool we have for understanding nutrient levels in our soils.
P critical ranges will vary between soil types and tillage practices.
Scatter on the soil test – fertiliser calibration curves within BFDC are real. Seasonal conditions and time of sowing will affect soil P availability and hence response to fertiliser.
Acknowledgements
Funding for this work was provided through the GRDC Project DAN00166 and their support is gratefully acknowledged.
Contact details
Tony Cox