Local lime results and what you need to consider in buying and applying lime
Author: Lisa Miller (Southern Farming Systems) | Date: 25 Feb 2016
Background
Liming is an integral part of our farming systems for the prevention of soil acidity. Soil monitoring through the Corangamite soil monitoring program (CSMP) and trial sites shows soil acidification issues are not limited to the topsoil (0-10cm) but commonly extend to 10-20cm in all soils types, indicating our liming practices are not keeping pace with acidification rates.
Lime response trials for preventing and ameliorating soil acidity have been set up across south west Victoria by Southern Farming Systems (SFS) through support by the Corangamite Catchment Management Authority through funding from the Australian Government and GRDC. The data generated from these trials and soil monitoring will be used to develop tools and messages that can help producers make better decisions on liming.
Where is the soil acidity and where should we test?
SFS have amassed a large data base of soil test results: 100 paddocks as part of the Corangamite soil monitoring program, 31 south west (SW) lime response trials and at SFS’s Inverleigh site. Testing has been mainly at 0-10, 10-20 and 20-30cm soil depths and to approximately one metre which has provided good insights into what soil types are most likely to have soil acidity and at what depths the soil acidity is likely to be. Below is a summary of our findings. All soil pH results in this paper report pH results using the calcium chloride test which is approximately 0.7 units lower than the pH water test due to its consistency across seasons.
Acidity in the top 20cm
- All soil types except limestone soils were affected by acidity in their topsoil (0-10cm)
- There is an acidity issue that has developed in the 10-20cm soil depth that was unexpected. Soil testing found subsurface acidity (pH <4.8) in:
- 29 of 100 paddocks tested as part of the Corangamite catchment soil monitoring project (CSMP)
- 16 of 31 lime trial sites which extend across south west Victoria
- Generally if you have surface acidity issues (0-10cm) then you are also likely to have issues within the 10-20cm depth
- Paddock histories from the soil monitoring network found that 36 per cent of the paddocks with subsurface acidity had been limed in the last 10 years indicating that liming does not always appear to address this soil acidity issue; the reasons of which are discussed later.
Subsoil acidity
- Subsoil acidity (pHCa <4.8) or acidity within the B horizon (often greater than 25cm depth) was found in:
- twenty five per cent of soils surveyed as part of the Corangamite Catchment soil monitoring project (another two soils had acidity within their A horizon that extended to 65cm in depth)
- eight of 31 lime trial sites
- Close to half the CSMP paddocks (44%) that had acidity in the subsurface 10-20cm also had subsoil acidity or acidity located at 30 to 85cm depth
- The soil types (Australian soil order) with subsoil acidity detected in CSMP were found in Chromosols (12 of 29 sites sampled), Dermosols (7/19), Kandosols (4/7), Sodosols (2/25), Kurosols (1/3) and Vertosols (1/16)
- The parent geology with subsoil acidity issues were sedimentary (12/31), basalt (8/44), Gellibrand Marl (3/8), alluvial (3/12) and granite (1/2)
- Sodosols or basalt soils in which most of our cropping soils are located increase in pH at depth due to containing some carbonate but even some acidity examples were found on these soils suggesting that it is wrong to make generalisations. It is also possible that the basalt is shallow (depth 40cm) and that an underlying older more weathered geology system is contributing to acidity at depth.
Acidity layer formation
Acid layer formation is where the soil is more acidic within the 10-20cm zone (pH <4.8) than the topsoil (0-10cm) or subsoil (20-30cm). This can occur as a result of surface applied liming. It was not as prevalent as reported in other states but was found at:
- eight CCSMP paddocks represented by different enterprises
- one lime trial site
- locally at the SFS Inverleigh research farm.
The issue at these sites is that plant roots will need to find less acidic areas to grow through (termite holes or old root channels) to try and reach better soil. If the roots find the same or more hostile acid conditions at the 20-30cm depth then root growth will be further stunted depriving plants access to nutrients and moisture at depth.
Where to test
The results have enabled us to make recommendations on what depths we need to monitor soil acidity. We recommend testing at 0-10cm and at least 10-20cm. If the pH is close to 4.8 in the 10-20cm depth then it is worthwhile also testing 20-30cm.
Deeper sampling of 10-30cm has been recommended in the past but, as many basalt derived soils (Sodosols and Vertosols) generally increase in pH at depth, it is likely to mask an issue that could be occurring in the 10-20cm soil layer. The 0-30cm is sampled for deep nitrogen (N) and can raise red flags regarding soil acidity. Below are 2015 results of soil testing at different bay locations at our SFS Inverleigh trial site. They show bay D-E bay with a pH of 4.7 for the 0-30cm layer which is lower than that occurring in 0-10cm and 10-20cm layers. This suggests the 20-30cm may be even more acidic and requires follow up testing.
The SFS site results also highlights the potentially variability in soil results that can occur within the one paddock where areas of high acidity will show up as patchy yield or growth. Notably bays C-E, E-E and I-W have pH levels within 10-20cm zone that will potential cause aluminium toxicity. Large differences in pH between 0-10 can 10-20cm are probably occurring where lime has been surface applied in the last few years.
Table 1: Inverleigh SFS site pH (Ca) and exchangeable aluminium (%).
| Depth (cm) | B-E | C-E | D-E | G-E | E-F | H-W | I-W | |||||||
|---|---|---|---|---|---|---|---|---|---|---|---|---|---|---|
| 0-10 | 5.0 | 2.8% | 4.5 | 6.1% | 4.9 | 2.6% | 4.8 | 3.3% | 5.5 | 2% | 4.8 | 4.1% | 4.8 | 3% |
| 10-20 | 4.8 | 5.2% | 4.6 | 8.2% | 5.1 | 1.5% | 4.9 | 3.7% | 4.3 | 21% | 4.8 | 3.8% | 4.5 | 11% |
| 0-30 | 5.4 | 4.9 | 4.7 | 4.8 | 5.3 | 5.3 | 5.2 | |||||||
Soil pH targets and lime movement
Soil pH is a good guide to make liming decisions, both for maintaining optimal pH levels and for preventing yield losses. We have commonly used soil pH(Ca) of 5.0 in the topsoil to trigger liming and although this helps avoid yield losses it does not create enough excess alkalinity to treat subsurface acidity. The problem with soil testing only in the 0-10cm is that it has created a false impression that acidity has been successfully treated with liming when often it has not.
Soil pH targets that account for subsurface/subsoil acidity appeared in the literature in 1999. They are Acid Soil Action based and the targets are:
- Greater than soil pH 5.5 in the topsoil (0-10cm) to allow lime movement down the profile
- Greater than soil pH 4.8 in subsurface and subsoil depths to avoid yield losses.
Evidence of lime movement has been reported in many trials and in particular the long term soil acidity trial at Wagga Wagga which commenced in 1992, and specifically looked at lime movement from the topsoil to the subsurface and under what pH levels this occurred at. There was indications of lime movement in six CSMP paddocks which had lime applied three to ten years earlier and often in multiple applications. These paddocks had subsurface soil pH levels above 4.8 seemingly as a result of having kept topsoil pH above 5.5. This was in contrast to 11 paddocks that had also been limed and still had subsurface acidity issues and topsoil pH <5.5.
The movement of alkalinity is controlled by the pH level. A pH greater than 5.5 was established because it was only above this pH level that the carbonate from lime is in the form of bicarbonate ions. Any excess bicarbonate ions (alkalinity) could be leached downwards in the soil solution and react with excess hydrogen ions (acidity) to form water and carbon dioxide. When soil pH levels are less than 5.5, the carbonate is in the form of carbonic acid and if leaching occurs it is downward movement of acidity.
Lime response trials
There are many negative effects on plant growth and soil biology, fertility and structure when soils become too acidic. One major effect is when pH falls to 4.8. At this point aluminium starts to become more soluble where it is toxic to plants and restricts their root growth and function. As pH falls below 4.5, the amount of aluminium increases markedly and even plants tolerant of aluminium will suffer yield reductions or fail to persist.
The aluminium test used in this program reflects the amount of aluminium within the soil solution which roots are exposed to and is expressed as a percentage of cations. When interpreting the results, the electrical conductivity (EC) - the measure of salts within the soil - of the soil is needed to accurately predict the effect of aluminium on plant growth. A table with critical concentrations of aluminium for different aluminium tests can be found at the SFS website (Table 2).
Table 2: Aluminium sensitivity of some crop and pasture plants.
| Sensitivity to aluminium | Exchangeable Al% where yield reduced for medium EC (0.07 to 0.23 dS/m) |
Crop and pasture species |
|---|---|---|
| Highly sensitive | 2-8 | barley, faba bean, lucerne, balansa clover, strawberry clover, berseem and persian clovers |
| Sensitive | 9-12 | canola, phalaris, red clover, caucasian clover |
| Tolerant | 13-21 | wheat varieties, annual and perennial ryegrass, tall fescue, chicory, fodder rape, white clovers and subclover |
| Highly tolerant | 22-30 | oats, triticale, cereal rye, cocksfoot, serradellas |
Source: Table adapted from soil acidity monitoring tools, DEPI, 2005
There are currently thirteen crop and eighteen pasture lime response trials being monitored across south west Victoria by SFS. SFS trials are a randomised block design, replicated four times with six different rates of surface applied lime: 0, 500, 1250, 1750, 2500, 3750kg/ha and a soil fertility treatment with and without lime at 2.5t/ha. The Woady Yaloak trials had lime rates 0, 250, 750, 1250 and 2500kg/ha with 250 and 750 kg/ha reapplied every three years.
Lime yield responses from trials established in 2014 and 2012 are shown in Tables 3 and 4. Our lime trials have shown us:
- The level of exchangeable aluminium is a good predictor of lime response and is generally impacting on yield at levels above five per cent although sensitivity varies for different crop and pasture species (Table 2)
- With faba bean and presumably lucerne, soil pH is a good guide to lime yield responses which start to occur when pH falls to 5.0 as the effectiveness and survival of rhizobia that fix nitrogen is reduced
- Most of our lime responses have been to barley, faba bean and canola but not wheat which is considered tolerant of aluminium. The implication of this is that lime needs to be applied possibly two or more years before acid sensitive species are grown and not just in the year of sowing canola
- Surface applied lime rarely gives lime responses in the first year of application except where the crop is highly acid sensitive and the soil pH is very low <4.5 or aluminium levels high >10 per cent
- Liming can increase the risk of take-all fungi if grass weeds have not been well controlled
- Crop lime responses can be variable and this can be attributed to a number of reasons:
- Soil pH levels are already good and are not limiting production and so only maintenance liming is required (i.e. liming ideally to match acidification rates)
- The plant species sown is tolerant of the current soil acidity levels
- Subsurface or subsoil acidity is constraining production whilst surface applied liming has addressed acidity in the topsoil
- Disease, weeds, nutrient deficiencies and possibly dry conditions are holding back yield responses
- When lime responses occur, the extra yield grown more or less pays for itself in the first year. Lime spread at 2.5t/ha costs about $100 to $150/ha.
Table 3: A summary of soil testing and yield results for SFS lime response trials where lime was surface applied in May 2014.
| Location | Depth (cm) | pH (Ca) | Al% of CEC (%) | 1st year yield responses to lime 2014 | 2nd year yield responses to lime 2015 |
|---|---|---|---|---|---|
| Bellarine | 0-10 10-20 20-30 |
4.2 4.4 4.9 |
16.6 10.7 2.5 |
barley lime 3 t/ha increased yield by 59% or 1.26t/ha LSD (p<0.01) = 0.58 CV 12.87 |
canola lime 3t/ha increased yield by 33% or 0.43t/ha. LSD (p<0.01) = 0.24. CV 6.97 |
| Gatum | 0-10 10-20 20-30 |
4.4 4.5 5.4 |
12.8 5.5 0.1 |
canola lime yield responses N.S. ranged from -5% to 22% CV 16.22 |
wheat lime yield responses N.S. ranged from 6% to 14%. CV 10.94 |
| Hensley Park | 0-10 10-20 20-30 |
4.4 4.7 5.3 |
7.7 1.7 0.5 |
wheat lime yield responses N.S. ranged from -6% to 6% CV 4.11 |
Hay lime yield responses N.S. ranged from -1% to 11%. CV 9.97 |
| Mingay | 0-10 10-20 20-30 |
4.8 4.2 4.7 |
1.8 1.4 0.1 |
barley lime yield responses N.S. ranged from -1% to -14% CV 12.12 |
barley lime yield responses N.S. ranged from -5% to 2%. CV 9.29 |
| Modewarre | 0-10 10-20 20-30 |
4.6 4.6 5.0 |
1.4 2.3 0.7 |
wheat lime yield responses N.S. ranged from -6% to 1% CV 8.77 |
barley lime yield responses N.S. ranged from -1% to 7%. CV 6.95 |
| Shelford | 0-10 10-20 20-30 |
4.9 5.4 5.0 |
0.4 0.1 0.1 |
canola, no measurements as accidently harvested |
faba bean lime yield responses N.S. ranged from -12% to 6%. CV 13.25 |
| Warncoort | 0-10 10-20 20-30 |
4.5 4.6 5.2 |
2.1 2.4 0.9 |
wheat harvested for hay due to ryegrass. Lime yield responses N.S. ranged from 0% to 23% CV 8.4 |
canola lime yield responses N.S. ranged from -14% to 23%. CV 28.33 (too high) |
| Westmere | 0-10 10-20 20-30 |
4.3 4.7 5.5 |
3.9 5.9 0.1 |
wheat lime yield responses N.S. ranged from -5% to 19% CV 14.5 |
barley lime yield responses N.S. ranged from 1% to 23%. CV 23.27 |
| Yulecart | 0-10 10-20 20-30 |
4.5 4.5 5.0 |
9.2 9.3 0.9 |
canola lime yield responses N.S. ranged from -9% to 12% CV 15.9 |
barley lime yield responses N.S. ranged from -1% to 9%. CV 9.93 |
Where P value is reported it reflects results that were significant and we are confident that the lime has caused the response and is not due to chance. N.S. = non-significant. Note lime responses for 0.5t/ha not reported in table above. CV = coefficient of variation. CV reflects the variation amongst the results for each treatment in each replicate. Generally a CV of 10 per cent reflects the data set is tight.
Table 4: A summary of soil testing and yield responses for Woady Yaloak catchment group trials where surface applied lime was applied to crops in 2012.
| Location | Crop | 2014 pH (Ca) | 2014 Al% of CEC (%) | Lime response comments |
|---|---|---|---|---|
| Rokewood North, starting pH in 2012 (0-10cm) was 4.8 |
canola 2012 W. wheat 2013 red wheat 2014 faba bean 2015 |
4.6 4.8 5.3 |
5.5 5.0 1.7 |
Canola lime 2.5t/ha increased yield by 30.6% or 0.53t/ha. LSD (p<0.1) = 0.20. CV 9.58.Lime 1.25t/ha increased yield 19%. N.S. P= 0.04, LSD (p<0.1) = 0.243. CV 10.2 No response to either wheats. Faba bean response with lime 2.5t/ha growing an extra 37% or 0.35t/ha. LSD (p <0.05) = 0.23. CV 15.2 |
| Rokewood West, starting pH in 2012 (0-10 cm) was 4.8 |
wheat 2012 faba beans 2013 canola 2014 W. wheat 2015 |
4.7 5.1 6.4 |
1.8 1.8 0.5 |
No data collected in 2012. Faba beans were cut for hay due to ryegrass, no DM yield response, N.S. Canola lime yield responses N.S. ranged from 0% to 16%. CV 16.5 Wheat lime yield responses N.S. ranged from -4.8% to 3.5%. CV 5.8 |
| Werneth, starting pH in 2012 (0-10 cm) was 4.7 |
canola 2012 wheat 2013 faba Beans 2014 W. Wheat 2015 |
4.5 5.4 5.8 |
4.7 1.2 0.9 |
Canola lime yield responses N.S. ranged from 0.8% to 7.9%. CV 5.8. Faba bean, no lime response in 2014 but fungal disease thought to hold back response. N.S. CV 8.84. No wheat lime yield response 2015 yield. CV 5.6 |
Note: lime responses for 0.25 t/ha not reported in table above.
Lime movement
With concerns of acidity occurring at the 10-20cm depth SFS investigated how far and fast surface applied liming was moving at our Bellarine trial site and Woady Yaloak Catchment Group sites.
After one year
Table 5: Soil pH change at the Bellarine lime trial where lime three t/ha was applied April 2014.
| Depth (cm) |
Starting pH April 2014 (before lime 2014) |
Lime June 2014 (2 months after liming) |
Lime August 2014 (Four months after liming) |
Lime Oct 2014 (Six months after liming) |
Lime March 2015 (12 months after liming) |
Lime June 2015 (15 months after liming) |
|---|---|---|---|---|---|---|
| 0-2.5 | 4.3 | 4.6 | 5.0 | 5.5 | 5.4 | 6.2 |
| 2.5-5 | 1.4 | 4.4 | 4.4 | 4.7 | 4.4 | 4.7 |
| 5-7.5 | 4.1 | 4.2 | 4.1 | 4.5 | 4.4 | 4.2 |
| 7.5-10 | 4.2 | 4.3 | 4.2 | 4.3 | 4.3 | 4.2 |
Below is a summary of lime movement in the first year and its implications.
- Lime moved to about 5cm after one year, which partly explains why lime responses are rarely seen in the year of application. This is similar to SW Sustainable Grazing System trials in the late nineties and reported in other trials. Although in an unseasonably high rainfall year, lime moved to 10cm after one year at Department of Agriculture trials near Hamilton. Faster movement is likely to occur from large leaching rainfall events which can wash particulate lime (when it is fine) down soil macropores
- Most of the pH change occurred in the first year and then it slowed due to the rate of lime movement slowing which might be about 1cm per year
- The pH in the top 2.5cm of soil increases to high levels (pH 6.2) and this could mean extended plant back periods for legumes (22 months) with some sulphonyl urea herbicides as the herbicide without acid conditions doesn’t break down easily (e.g. Logran®)
- As excess hydrogen ions are neutralised by bicarbonate ions, those in excess move downwards via leaching to the next zone and the reactions are repeated. The implications are the more acidic the soil is, the more likely that our current rates of two or three t/ha of lime is used up before it even reaches 10cm depth
- Not all the lime dissolved in the first year and some was evident on the surface. The reason for this is that lime dissolves into Calcium and carbonate ions only when there is moisture and acid soils. The rate of dissolution becomes very slow at pH 5.4 to 5.8
- Temporal soil pH variation occurs following long hot dry summers and this can be up to 0.45 pH unit, so interpreting of late summer and autumn results should be treated with caution
- The way lime dissolves and moves has implications for surface spreading or banding lime rather than mixing it throughout the soil as the pH can become too high for the chemical reactions to occur and a proportion of the lime will sit there undissolved until the soil becomes more acid. Large clumps of lime (approx. 5mm diameter) have been observed to remain intact for at least 20 years surrounded by high soil pH.
After three years
Trials established by the Woady Yaloak catchment group in 2012 and now monitored by SFS show that surface applied lime hasn’t moved after three years into the 10-20cm soil layer (Table 6). This is not unusual where trials show surface applied lime taking between two to 15 years to move beyond 10cm (Scott 1992). We anticipate that after four to five years the pH change might only occur at the 10-15cm depth and will involve only minimal pH change and only on those sites with pH >5.5.
Table 6: Soil pH change recorded in autumn 2015 in surface applied lime 2.5t/ha (autumn 2012) and un-limed plots in Woady Yaloak Catchment Group trials.
|
Site
Type
Texture
Geology
|
Illabarook
Pasture
Sandy loam
Sedimentary
|
Pittong Pasture Sandy Loam Granite |
Mt Mercer Pasture Clay Basalt |
Werneth Crop Clay loam Basalt |
Rokewood Nth Crop Loam Alluvial |
Rokewood West Crop Clay Loam Basalt |
||||||
|---|---|---|---|---|---|---|---|---|---|---|---|---|
| Starting pH in 2012 | 4.9 | 5.2 | 4.8 | 4.7 | 4.8 | 4.8 | ||||||
| Depth (cm) | Nil | Lime | Nil | Lime | Nil | Lime | Nil | Lime | Nil | Lime | Nil | Lime |
| 0-10 | 5.3 | 6.2 | 5.4 | 5.5 | 4.9 | 5.6 | 4.5 | 5.2 | 4.6 | 5.6 | 4.7 | 5.4 |
| 10-20 | 4.9 | 4.8 | 4.6 | 4.6 | 4.7 | 4.8 | 5.1 | 5.0 | 4.8 | 4.8 | 5.1 | 5.1 |
| 20-30 | 5.1 | 5.1 | 4.5 | 4.5 | 4.9 | 4.9 | 5.8 | 5.7 | 5.3 | 5.1 | 6.4 | 6.5 |
The aluminium results for the three crop sites are given in Table 4. The exchangeable aluminium for the three pasture sites with increasing depth was:
- Illabarook: 2%, 5%, 5%
- Pittong: 2%, 17%, 20%
- Mt Mercer 1%, 3%, 2%.
The Pittong site on granite soils has shown no dry matter responses to lime at 2.5t/ha and is a good example of how the underlying subsurface acidity is constraining production even though the topsoil acidity has been addressed.
Incorporating lime
The decision to incorporate or surface apply lime is really dependent on where the acidity issue is and how fast you need the response. If it is deeper than 10cm and you are losing yield then incorporation will give you the fastest response but it comes with its disadvantages such as:
- It will add to the expense
- Potentially germinate weeds
- Paddock may not be trafficable for some time
- Likely to increase the rate of breakdown of organic matter
- May cause erosion.
However benefits of incorporation can include:
- Breaking up of compaction layers
- Weed seed burial
- Reduce soil and stubble fungal diseases
- Lower snail and slug populations
- Moving immobile nutrients located near the surface.
How much damage is done to soil by occasional tillage in an otherwise no till system is being investigated by GRDC. The other issue is how to get the lime to where it is needed. Different incorporation methods will be tested in two local demonstration sites funded by GRDC in 2017 and will help answer this question.
Ideally you want even spreading of lime or good mixing if incorporating lime. You don’t necessarily want pockets of lime even when it is fine because the surrounding soil will continue to acidify and drop further in pH. Some potential techniques that have been suggested to move lime to depth are listed below with comments made on their likely success and pitfalls. The different techniques need to also be costed before decisions can be made.
Table 7: Incorporation techniques of lime.
| Technique | Comments |
|---|---|
| Stubble incorporation | Likely to incorporate lime to 5cm depth. May speed up breakdown of stubble if soils are moist by improving microbial activity. |
| Mould board plough | Spread on surface and then inverts soil. So effectively bringing subsoil to surface which could be poorer. A good option for burying weed seeds. Deposits lime at 10 or 20cm but unlikely to get mixing. Would need to potentially apply more lime on surface to treat 0-10cm. |
| Disc harrow | From a lime distribution point of view excellent. |
| Offset discs | Used to create partial inversion and so will get some mixing and some weed burial. |
| Deep rip or ploughing | Spread on surface and then rip to layer where soil acidity is. Good distribution of lime and is especially beneficial it there are soil compaction issues. |
| Direct injection | Places lime during deep ripping. Requires the use of modified machinery. Lime will not be evenly distributed through the soil. |
| Subsoil manuring machine | Untested. Likely not to get good distribution throughout the profile as lime is placed in a layer. Organic material deposited is alkaline and provides a similar effect to lime. |
| Liquid lime applied with surfactants | Unproven, liquid lime uses only 20 per cent of limestone products and might need to be applied every year. |
| Deep burrowing worms | Shown to distribute lime. May have a role in non-arable country. Would have to be introduced. |
What factors are important in choosing a lime?
Lime quality is a major factor that affects the rate of lime movement and the rate at which pH is changed. Trials have demonstrated that decreasing the particle size of lime will increase the rate of lime leaching.
There are three factors which control lime performance:
- Chemical composition determines the quantity of base applied to the soil and is accounted for in neutralising value (NV)
- Particle size determines the surface area of lime exposed to the soil volume and its distribution throughout the soil
- Solubility determines the tendency of the material to dissolve and hence the rate of the reaction of a given particle size in the first six to 12 months.
NV is a measure of the lime’s ability to neutralise acidity and is therefore the most important factor in selecting a lime. Pure calcium carbonate (or pure limestone) is taken as the standard with an NV of 100 per cent. The higher the NV the more pure the product is. Lime products sold in Victoria commonly have an NV of 80 to 90 per cent. Dolomite (Ca0.5 Mg0.5 CO3) and burnt lime (CaO) can have a NV greater than 100 percent due to their lighter molecular weight compared to calcium carbonate.
Particle size determines the amount of soil contact and coverage and how fast this reaction will occur and the degree to which the reaction occurs. Surface applied lime rates of 2.5t/ha are likely to give complete soil coverage when they have particle diameters of less than 0.15mm but 18t/ha is needed if the lime is greater than one millimetre (see Table 8). These figures are based on mathematical calculations (Cregan et al. 1989).
The emphasis on the importance of lime particle size has been lost over the years. Part of this reason is that the reporting of quality factors including NV, particle fraction sizes and ENV is no longer mandatory under the under the Victorian Fertiliser and Veterinary Regulations (Control of Use) which was removed in 2003. Now commonly only the proportions of particle sizes greater than one millimetre are reported.
Table 8: Total amount of surface applied lime required to cover one hectare at different particle diameters (mm).
| Particle diameter (mm) | Amount of lime needed to cover one ha (t/ha) |
|---|---|
| 1 | 18.1 |
| 0.5 | 9.1 |
| 0.25 | 4.4 |
| 0.15 | 2.7 |
The effect of fineness on the speed of pH change is demonstrated in Figure 1. This is based on an experiment at Wagga Wagga Agricultural Institute where a hard calcitic lime was incorporated to a 10cm depth. This study is currently unpublished but was used in New South Wales (NSW) Agriculture lime extension programs by Greg Fenton and Bill Schumann in the nineties (Source: NSW Agriculture, Limes and Lemons. n.d.).
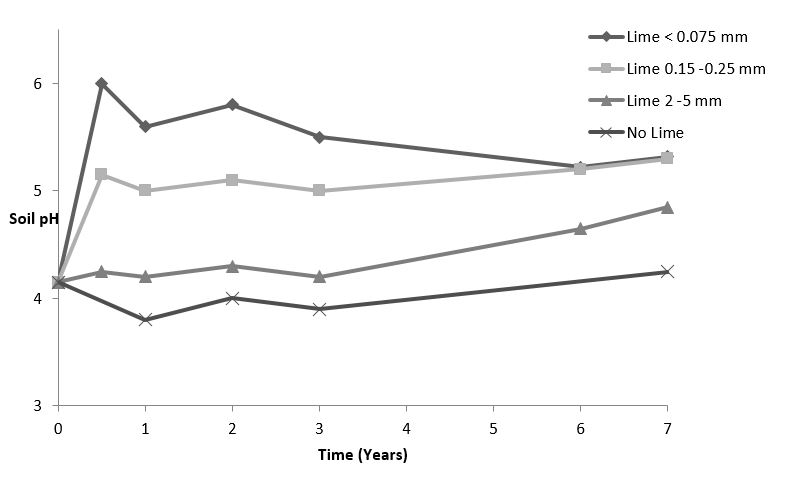
Figure 1: The change in pH over time using different lime particle sizes.
The diagram shows that the finer the lime the greater the increases in pH and that coarse lime (2-5mm) did not achieve the same pH change after seven years. The bottom line is that coarse particles may never catch up. This is because the soil surrounding the lime particle reacts with the acidity and the pH becomes high and the lime ceases to dissolve, meanwhile the surrounding soil continues to acidify. The implication is that the purchase of cheap coarse lime regardless of its NV may never be a good investment.
Ideally if you want a fast response to lime then the majority of the lime should be under 0.1mm. To make informed decisions on the purchase of lime, growers need to pay for the cost of a lime quality report which costs $75 to $100 per sample as there is currently very little information on particle size available to growers.
Solubility affects the lime’s initial performance (first year) and is linked to the type of liming material. From NSW Agriculture field testing of 12 nationally available commercial limes including two from Victoria, they found that soft limes perform 20 per cent more efficiently than calcitic hard limes, whilst dolomites perform 15 per cent less efficiently than predicted in the first six to 12 months after liming. By 12 to 24 months after application these differences disappeared. In the absence of information on different limestone solubilities, it was proposed that this information could be used as surrogates for the relative solubilities of these groups of liming materials.
This conclusion supports what is seen in field studies where soft limes have resulted in pH change down to about 5cm after 12 months compared to rates quoted of 1cm per year which presumably was based on findings using hard limes. However, it could be that the notion of 1cm per year came from measurements of lime movement after the first year.
Approximately 90 per cent of liming products sold in Victoria are regarded as soft limes which are literally physically softer than harder limes. Examples of hard calcitic limes in Victoria are Lilydale and Buchan and they are generally finer than soft limes as undergo further processing.
Tools to work out the cost effectiveness of lime
There are a number of tools that allow producers to make comparisons of different liming materials by accounting for both NV and particle size such as the ENV calculation. Generally the tools are based on an NV multiplied by different sieved fractions which are rated by their effectiveness at changing pH. All of the states agree that the finer the lime the higher its effectiveness, but the particle size at which to set the 100 per cent effectiveness rating varies across states. For example:
ENV = NV × [(% lime particles > 850 um × 0.1) + (% lime particles 300-850 um × 0.6) + (% lime particles < 300 um × 1)]
A comparison of effectiveness ratings is shown in Table 9. The Victorian ENV calculation first originated in the United States in 1971 and was tested in pot trials by the Department of Agriculture in 1987 and slightly changed to fit their standard sieving practices. The calculators originating from Western Australia (WA) use ratings were modified from NSW Agriculture work in 1989. My preference is to use the effectiveness ratings in the NSW agriculture calculator as these were based on field data from 1992 trials and involved commercially available lime products. It also best emphasises that the finer the lime, the more effective it is.
Table 9: Effectiveness ratings used in their calculations for different particle sizes.
| Vic. ENC calculation | NSW Agriculture lime comparison calculator 2003 | WA DAFF calculator and the Soil Quality online Lime Comparison Calculator |
|---|---|---|
| <0.3mm = 100% | < 0.075 mm = 100% | <0.125 mm =100% |
| 0.3-0.85mm = 60% | 0.075 to 0.15 mm = 58% | 0.125 to 0.25 mm =100% |
| >0.85mm = 10 % | 0.15 to 0.25 mm = 42% | 0.25 to 0.5 mm = 100% |
| 0.5 to 1 mm = 34% | 0.5 to 1 mm = 50% | |
| 1 to 2 mm = 22% | > 1mm = 20% | |
| > 2 mm = 12% |
To calculate cost effectiveness of lime using ENV the following formula is used:
Unit cost = Total cost per tonne spread ÷ ENV%
Although it is a simple calculation it can be misleading as it does not take into account any additional costs of having to purchase and spread a lime with a lower NV value. For example, quality factors of two limes are shown in Table 10, and Lime A is slightly cheaper per unit cost of ENV and so would be considered more cost effective. However, if the grower decided to use Lime B then they need to be purchasing 19.1 per cent more of it to have the same neutralising effect. That is, for every one tonne of Lime A they would need to purchase 1.27t of Lime B which may not be considered. Most lime calculators available compute an ENV type sum but also include an NV rate adjustment factor so that the paddock costs of the limes can per compared.
Table 10: Comparison of factors for two lime products.
| Factor | Lime A | Lime B |
|---|---|---|
| Type | Soft earth lime | Soft earth lime |
| Neutralising value % | 90% | 70.9% |
| Material > 5mm | 0.5% | unknown |
| Meterial > 2mm-5mm | 3.4 | 16.3 |
| Material > 1mm-2mm | 8.7 | 22 |
| Material > 0.85mm-1mm |
2.9 | 10.3 |
| Material > 0.3mm-0.85mm |
40.7 | 28.5 |
| Material > 0.075mm-0.3mm |
38.7 | 17.3 |
| Material > 0.075mm |
5.1 | 5.7 |
| Material neutralising factor | 62.8 | 75.5 |
| Cost $/t spread | $62/t | $35/t |
| Unit cost $ per ENV | $1.08 | $1.10 |
What these calculators don’t account for is the effects of solubility, but rules of thumb can be applied particularly if seeking a fast response, which is that soft limes are 20 per cent more effective at changing pH than hard limes in the first six to 12 months.
Visit the soil quality lime comparison calculator online.
Spreadsheets for the other calculators are available from SFS. New calculators are also under development.
Conclusion
Monitoring soil acidity only in the 0-10cm depth is misleading as soil acidity layers could have formed in the subsurface. If surface liming, then there is a need to keep the topsoil at pH >5.5 to allow lime movement. The method of lime application chosen will depend on where the acidity is in the profile and how severe it is, as this affects how fast you need the response to be. To treat an existing subsurface acidity issue then the fastest response will come from incorporating that lime at the depth where the soil acidity issue exists. In deciding how to incorporate lime then growers need to consider what machinery is available and what other constraints could also be addressed (weeds, compaction, slugs) and the costs. Costs are likely to be high in the year of incorporation but spread out over possibly a 10 year period and providing benefits for this time period will make the figures less daunting. The choice of lime also effects the rate of movement of lime with fine limes with particle sizes <0.1mm working most effectively, and soft limes working faster than hard limes or dolomite in the first 12 months.
Acknowledgements
Funding for this work was provided through the GRDC Project SFS00026 and their support is gratefully acknowledged.
Useful resources
GRDC Strategic tillage fact sheet
Corangamite CMA Soil Health Knowledgebase
Soil Quality lime comparison calculator
Pulse Australia Southern Pulse Bulletin article on residual herbicides and weed control
References
Adams F (1971) Soil, crop and economic benefits from lime use. In ‘Increasing lime use in the Tennessee Valley region,’ Bulletin Y-20 National Fertiliser Development Centre, Tennessee Valley Authority, Muscle Shoals, Alabama
Cregan PD, Hirth JR and Conyers MK (1989) Amelioration of soil acidity by liming and other amendments. In: Soil acidity and plant growth. Ed. A Robson. Academic Press, Australia.
Hollier C. (1999) In ‘Acid Soil Action.’ Land and Water Resources Research & Development Corporation.
NSW Agriculture. (n.d.) ‘Limes and Lemons’ Unpublished.
Soil Acidity monitoring tools (2005) Department of Environment and Primary Industries 2005
Contact details
Lisa Miller
Southern Farming Systems
23 High St, Inverleigh, Victoria 3321
0488 600 226
lmiller@sfs.org.au
Was this page helpful?
YOUR FEEDBACK