Using remote data sources to improve agronomic management
Author: Ben Boughton, Satamap Pty Ltd, Gilroy Farms, 2014 Nuffield Scholar (UAVs) | Date: 23 Feb 2016
Take home message
- Remote sensing is a tool that is gaining in popularity with forward thinking agronomists to add value to their clients
- Remote sensing enables us to ‘see’ plant attributes that our eyes cannot with bands such as near infrared
- Data access is becoming easier and cheaper.
What is remote sensing?
Remote sensing is the acquisition of information about an object or phenomenon without making physical contact with the object, and thus is in contrast to on-site observation.
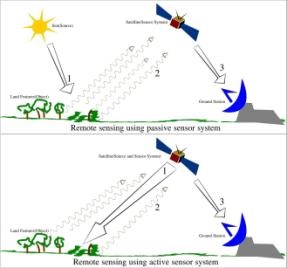
Figure 1. "Remote Sensing Illustration" by Arkarjun - Own work.
Licensed under CC BY-SA 3.0 via Commons - https://commons.wikimedia.org/wiki/File:Remote_Sensing_Illustration.jpg#/media/File:Remote_Sensing_Illustration.jpg
Why does it matter?
- It adds value to your business - clients will recognise the professionals that utilise all available tools to make decisions that affect their business
- It’s not going away - RS innovation is almost vertical
- The longer you wait to learn about it the harder it becomes.
Who collects the data?
- There are 40+ satellites collecting optical imagery
- Some Government run missions make all data open and free such as USGS Landsat program and the new ESA Sentinel mission
- Commercial satellites from companies such as Digital Globe and Blackbridge offer very detailed data, often scheduled.
How do we make sense of it?
- Imagery comes back to Earth as digital numbers provided by sensor (DN)
- Taking into account sun angle, atmosphere and sensor specs, DNs are converted to reflectance values
- The reflectance value is used to make images (true and false colour), and generate other information such as vegetation indices.
What can it see?
- The sensor ‘looks’ at different bandwidths
- Blue, Red and Green bands which our eyes can see
- Near infrared, short wave infrared, thermal bands which our eyes cannot see.
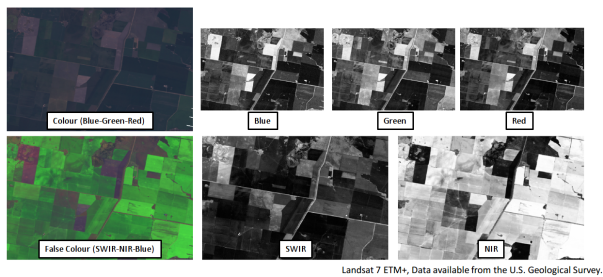
Figure 2. Bandwiths viewed by remote sensing
What do you mean by resolution?
- Spatial resolution – pixel size of an image representing the size of the surface area on the ground (i.e. m2)
- Spectral resolution – wavelength interval size (discreet segment of the Electromagnetic Spectrum) and number intervals that the sensor is measuring
- Temporal resolution – time that passes between imagery collection periods for a given surface location
- Radiometric resolution – ability of an sensor to record many levels of brightness (contrast for example)
and to the effective bit-depth of the sensor (number of grayscale levels) and is typically expressed as 8-bit (0-255), 11-bit (0-2047), 12-bit (0-4095) or 16-bit (0-65,535).
What can we do with it? Example – Chickpeas 2015
This example is of a chickpea paddock grown north of Moree in 2015. The aim here is to display data from different sources to get a better understanding of what happened throughout the growing season.
The crop was planted on a full profile of moisture in May into heavy barley stubble with a single disc no-till planter. Establishment was reasonable but there were a few gaps.
Two rainfall events, 51mm in June and 50 in July let to a water-logging event. The next significant rainfall event was 25 mm on 29 October.
The combination of stored moisture, high stubble cover, poor drainage from tramline direction, and a charged fallow catchment area upstream all contributed to this event.
The dry finish enabled the affected areas to recover reasonably well producing an average yield of about 1.9t/ha.
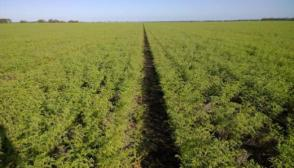
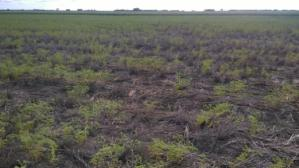
Figure 3. Photographs of chickpeas taken August 2015
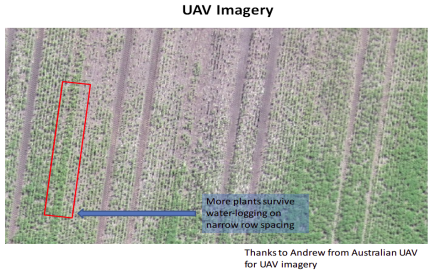
Figure 4. Imagery from UAV take 26-08-2015 enables us to see individual plants
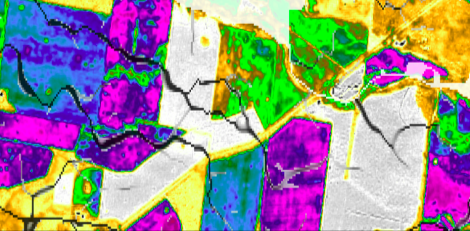
Figure 5. Satamap imagery with flow accumulation layer on top showing where water accumulates when it rains
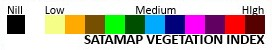
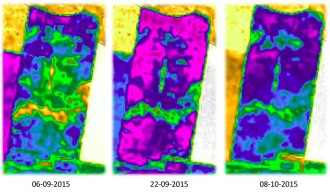
Figure 6. Satamap imagery showing how biomass changes of 16 day period
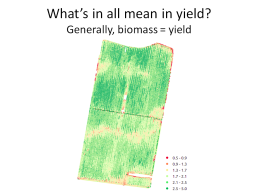
Figure 7. Yield map from harvester shows general trend of high biomass resulting in higher yield. Overall an excellent result.
What can we do with it? Look at it – Moree district view September 2015 vs 2015
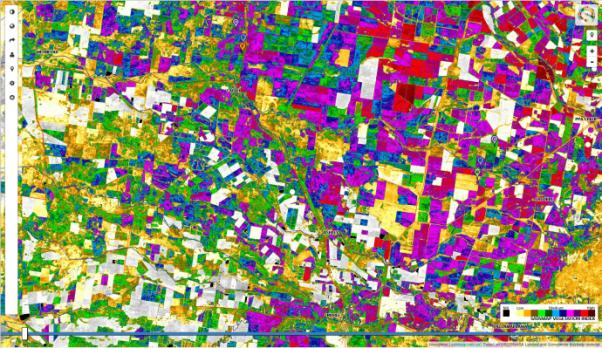
Figure 8. North of Moree, September 2015
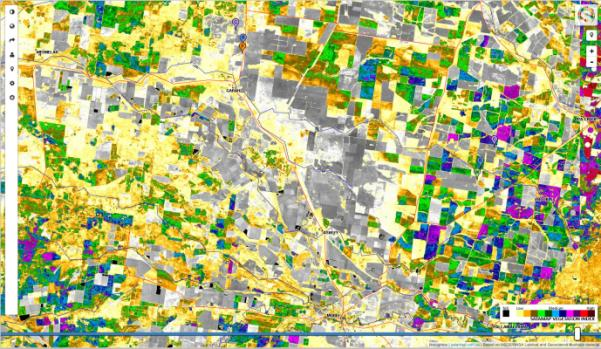
Figure 9. North of Moree, September 2014
What can we do with it? Look at it – Some satellite imagery closer up
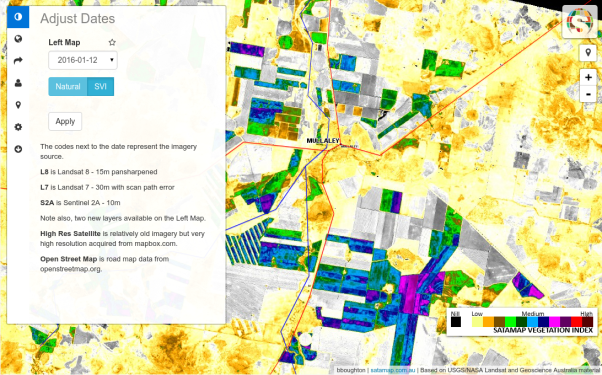
Figure 10. Mullaley area 12 Jan 2015
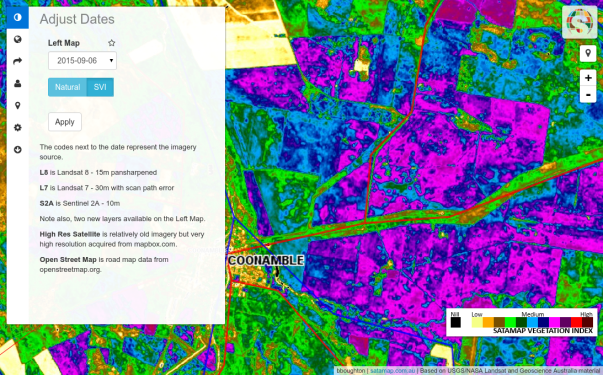
Figure 11. Coonamble 6 September 2015
What can we do with it? - analyse & build information
- Look at trends over time by ‘stacking’ imagery
- Create variable rate prescription maps (see "process"):
Process:
- Imagery detects patches of barnyard grass in fallow in 2013
- Water map generated to apply higher rate of flame to areas where barnyard grass seedbank is highest
- Spray operator imports shape file and controller automatically adjusts rates
- Practically limited to about 20% rate variation.
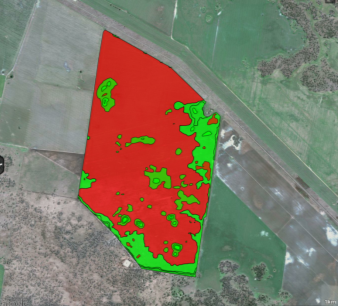
Figure 12. Prescription map for Flame herbicide. Red is low rate, green is high
Where can I get it?
Australian companies offering satellite imagery fully processed and ready to use on farm:
Contact details
Ben BoughtonMb: 0428 548 688
Email: ben@satamap.com.au
Was this page helpful?
YOUR FEEDBACK