An analysis of frost impact plus guidelines to reduce frost risk and assess frost damage
Author: Jack Christopher (1), Bangyou Zheng (2), Scott Chapman (2), Andrew Borrell (1), Troy Frederiks (3) and Karine Chenu (1) | Date: 20 Jul 2016
1University of Queensland, Queensland Alliance for Agriculture and Food Innovation (QAAFI)
2CSIRO Agriculture Flagship
3Queensland Department of Agriculture and Fisheries (DAF QLD)
Take home message
- Growers need to consider carefully whether earlier sowing is justified in seasons where warmer temperatures are predicted.
- Warmer temperatures may reduce the frequency of frost events but also increase the rate of crop development bringing crops to the susceptible, post heading stages earlier.
- Situation analysis of national frost impact indicates substantial losses in all regions averaging approximately 10% using current best practice.
- In the northern region, there are even greater losses in yield potential due to late sowing.
- These results indicate that continued research into reducing frost risk remains a high priority despite increasing temperatures.
- Variety guides and decision support software are useful for matching cultivars to sowing opportunities.
- Current variety ratings based on floret damage may not provide a useful guide to head and stem frost damage.
- Crops become most susceptible to frost once awns emerge.
- If crop temperature at canopy height drops below -3.5C after awn emergence, crops should be assessed for damage.
- Consider multiple sowing dates and or crops of different phenology to spread risk.
An analysis of frost impact
The first nationwide assessment of the comparative impact of frost in different Australian cropping regions provides important insights into how to manage frost risk in Australian cropping environments (Zheng et al. 2015).
Climate data from 1957-2013 was used to assess the frequency and severity of frost for each region of the Australian cropping belt. Night time minimum temperatures have been observed to increase over much of the Australian cropping region during that period. However, our analysis showed that frost risk and frost impact did not reduce over the whole cropping area during that time. Warmer temperatures accelerate plant development causing crops to develop to the frost-susceptible, heading stages more rapidly. So counter intuitively, planting earlier or even at the conventional date during warmer seasons may sometimes increase frost risk.
Historic climate data from a grid database and for 60 locations representing each of the four major cropping regions of Australia was used to determine the frequency and severity of frost (Figure 1 top). Crop simulation modelling using the Agricultural Production Systems sIMulator program (APSIM) was used to estimate crop yields. Expert knowledge combined with data from frost trials was used to estimate crop losses. Computer simulation allowed prediction of crop losses for all Australian cropping regions using damage information from a limited number of frost trial sites. It also allowed simulation of potential yields using sowing dates optimised for yield in the hypothetical absence of frost risk, something that has not been achieved experimentally.
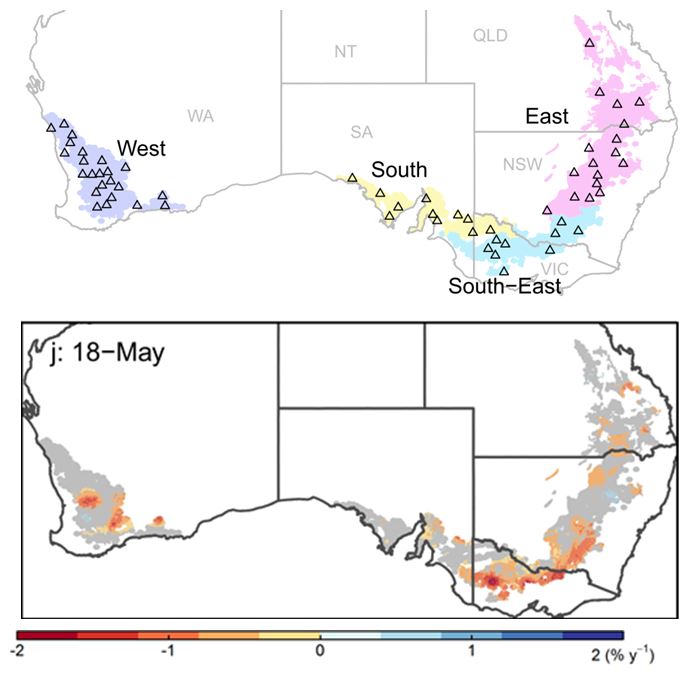
Figure 1. Maps showing sites and regions for which climate data were analysed for the frequency and severity of frosts (top panel) and annual % change in yield loss due to frost from 1957 to 2013; negative values (yellow to red) represent areas where yield loss became worse over recent decades (bottom panel). Estimations in the lower panel were for the cultivar Janz sown May 18th and are based on a ~5 x 5 km grid of climatic data. (Gridded climate data may not reflect local climatic conditions of particular paddocks within each grid as frost events are highly spatially variable.)
The study revealed that estimated yield losses due to direct frost damage averaged close to 10% nationally for all crop maturity types, following current sowing guidelines (Figure 2). To estimate the loss of yield potential due to late sowing, which is necessary in many areas to manage frost risk, a theoretical optimal sowing date (as early as the 1 May) was used. When lost yield potential from delayed sowing (indirect cost of frost) is added to direct damage, estimated yield losses approximately double from 10% to 20% nationally (‘direct + indirect’ impact in Figure 2). In the eastern grains region (QLD to central NSW), losses were even greater, with estimated yield losses due to direct damage and delayed sowing (indirect losses) of 34, 38 and 23% for early, mid and late flowering cultivars, respectively (Figure 2).
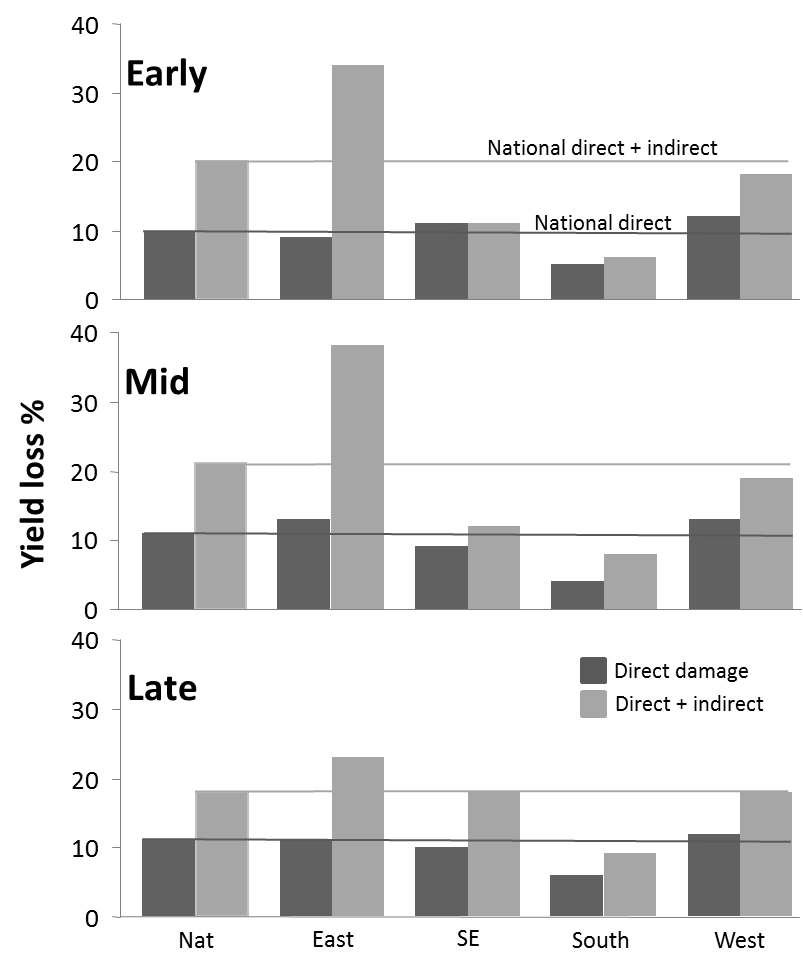
Figure 2. Estimated wheat yield losses (%) due to frost damage for crops sown at the current best sowing date (‘direct’ frost damage); and crop losses due to both direct damage and delayed sowing currently necessitated to manage frost risks (direct + indirect) for early, mid and late flowering crops.
In some areas in each region, simulated frost impact has significantly increased between 1957 and 2013 (yellow, orange and tan areas, Figure 1, bottom panel). Estimated date of last frost has come later in some areas but earlier in others. However even in areas where the date of the last frost has come significantly earlier, increased temperatures have also increased the rate of development to frost-susceptible heading stages. The modelling suggests that crop heading dates have been brought forward more rapidly than the date of last frost, leading to an overall modelled increase in frost impact in many areas.
These trends over time may have implications for growers making planting decisions. They indicate that sowing early to increase yield potential may not always be the best course of action in warmer seasons, even when a lower frequency of frost events is anticipated. By increasing the rate of crop development, warmer temperatures cause the crop to develop more rapidly to the frost susceptible, heading stages, which may actually increase frost risk.
These results indicate that continued research to reduce frost risk remains a high priority despite increasing temperatures due to climate change. Counterintuitively, percentage yield losses are greatest in the Northern Grain region with the greatest yield losses actually due to delayed sowing rather than frost per se.
Results from this Frost Situation Analysis will provide valuable insights allowing GRDC to better direct research resources. They also provide valuable insights for managing frost risk now.
Guidelines to reduce frost risk and assess frost damage.
Matching variety to planting opportunity
The current best strategy to maximise long term crop yields is to aim to time crop heading, flowering and grain filling in the short window of opportunity after the main frost risk period has past and before day time maximum temperatures become too high.
It is essential that varieties are sown within the correct window for the district as outlined in variety guides.
Planting in the optimum window does NOT guarantee that crop loss due to frost will be averted, nor does it always prevent drastic yield reduction due to late season heat and drought stress. However, planting a variety too early can lead to a very high probability of crop loss.
With seasonal temperature variation the days to flowering for each variety will change from season to season as discussed above.
Current variety ratings based on floret damage may not provide a useful guide. Floret damage ratings are yet to be correlated with more significant head and stem damaging frosts.
Measuring crop temperature
In-crop temperature measurements are useful to determine whether a crop may have been exposed to damaging temperatures. A historic comparison of on-farm and district minimum temperatures also allows growers to fine-tune district management recommendations to better suit their particular property and individual paddocks. District recommendations are based on one, or at best a few sites, for each district and may not correlate well with the experience of individual growers. Thus in many instances, the recommendations likely err on the side of caution.
Stevenson screen temperatures measured at Bureau of Meteorology stations do not fully explain frost risk. In crops, the temperature can vary several degrees from the temperature measured in the screen. On nights when still cold air, clear skies, and low humidity conditions combine, temperatures can drop rapidly, resulting in radiant frost (Figure 3). The crop temperatures experienced and recorded can vary widely due to differences in topography (Kelleher et al. 2001), micro-environment (Marcellos and Single 1975) and recording method (Hayman et al. 2007).
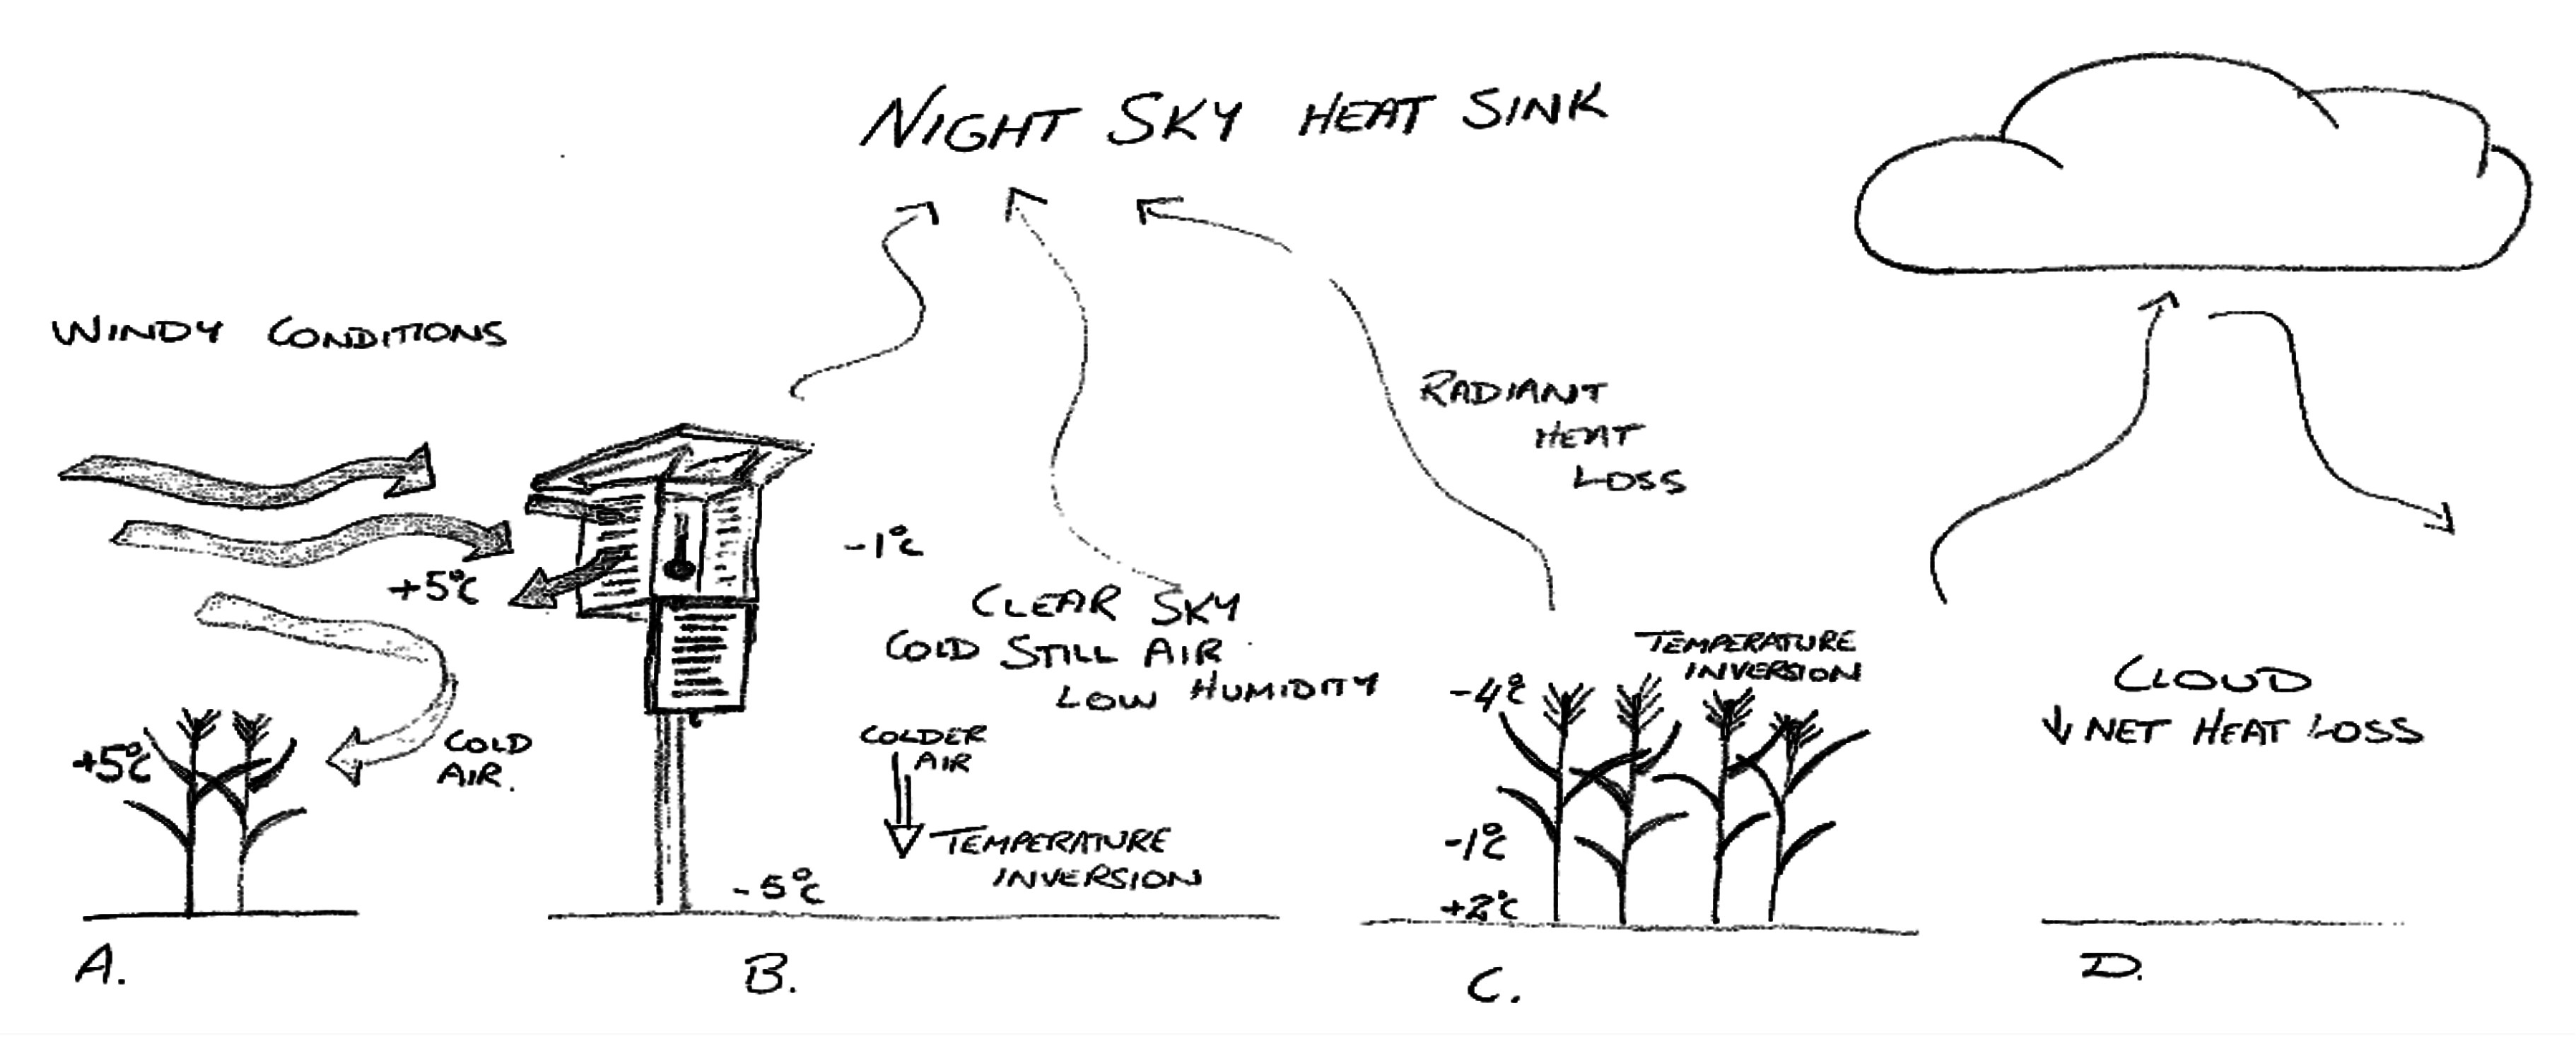
Figure 3. If clear skies and still, cold, low humidity air coincide, heat can be lost rapidly to the night sky resulting in a radiant frost. Minimum air temperatures measured at head height can be several degrees colder than reported “screen” temperatures. Some indicative temperatures are illustrated for (A) windy conditions, (B) clear still conditions in an open area, (C) clear still conditions in a cropping area, and (D) cloudy conditions.
Measurements taken using exposed thermometers at canopy height (Figure 4) give a much more accurate indication of the likelihood of crop damage.
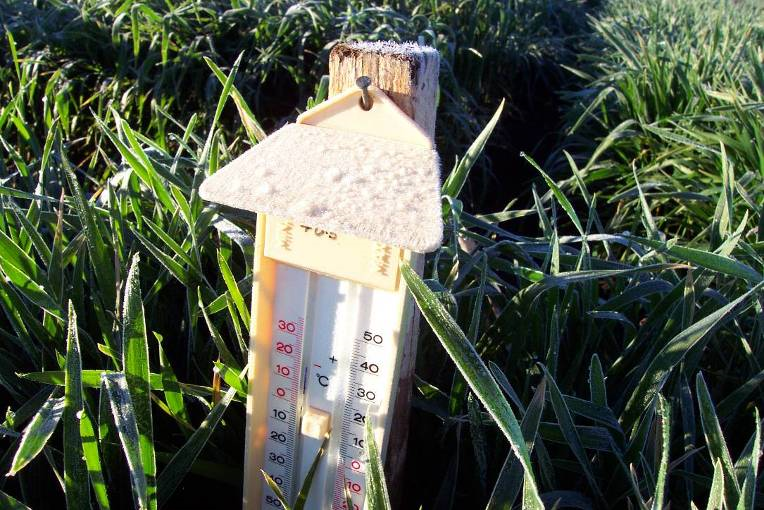
Figure 4. Canopy temperature measured using a calibrated minimum/maximum thermometer. For best results, a minimum of two or three field thermometers are require to give representative temperatures for a crop. In undulating country, more thermometers should be used to record temperatures at various heights in the landscape (Woodruff et al. 1997).
Assessing frost damage
Frost damage varies with crop growth stage. Frost susceptibility generally increases with plant maturity. In particular, wheat and barley become most susceptible after awn emergence (Frederiks et al. 2011ab; 2012).
Young crops
Major economic damage prior to stem elongation is uncommon (Single 1987; Woodruff et al. 1997). Young crops will usually regrow from damage, particularly if good follow-up rain is received (Afanasiev 1966). Rarely, very severe frosts (lower than −7°C canopy air temperature) may result in damage to the developing crown of the plant (Woodruff et al. 1997).
Advanced crops – not showing ears or awns
In addition to leaf and stem damage booting crops can experience damage to developing ears. This damage usually shows as bleached sections with incomplete ear structures (Figure 5).
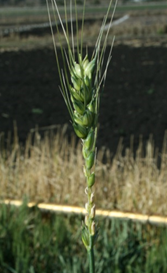
Figure 5. Frost damage prior to head emergence.
Advanced crops – ears or awns visible
During and after ear emergence, the plant becomes much more susceptible to frost injury. In wheat, the breaking of the boot is critical for heads to become fully susceptible to frost (Livingston and Swinbank 1950; Single 1964; Afanasev 1966; Paulsen and Heyne 1983). Frost damage after head-emergence often results in severe stem and head damage, and frequently occurs at milder temperatures than damage earlier in development (crop air temperatures ~ −4°C). In elongating stems damage is most easily identified in the 30 mm of stem above the top node. Damaged stem tissue develops a water-soaked dark green colour; later, shrivelling, drying out and bleaching. In severe cases, connection between the head and the rest of the plant may be severed, and the head dies (Afanasiev 1966; Figure 6).
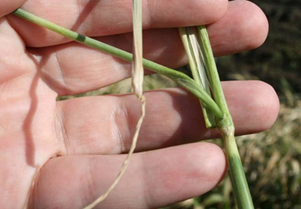
Figure 6. Wheat stem showing severe frost damage. Note the damage around the node, particularly the lower 30mm of peduncle and bleached collar approximately 90mm from the base of the peduncle.
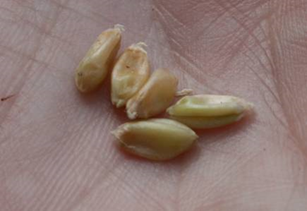
Figure 7. Frosted hollow grain dries back to the typical shrivelled frosted grain.
Frosting of developing grain, after flowering, is difficult to assess. Damaged grain may continue to swell and appear relatively “normal”. However, these damaged grains eventually dry back to shrivelled (potentially) harvestable grains which may cause down grading (Figure 7). To assess this damage, 7 to 14 days after a frost, look for discoloured, shrunken, water soaked or hollow grains that, when squeezed, exude a “straw coloured” transparent rather than “milky” opaque liquid.
References
Afanasev MM (1966), Frost injury in wheat. Plant Disease Reporter 50, 929–930.
Frederiks T, Christopher J, Harvey G, Sutherland, M and Borrell A (2012), Current and emerging screening methods to identify post-head-emergence frost adaptation in wheat and barley. Journal of Experimental Botany 63 (15), 5405-5416.
Frederiks TM, Christopher JT, Fletcher SEH, and Borrell AK (2011a), Post head-emergence frost resistance of barley genotypes in the northern grain region of Australia. Crop and Pasture Science 62, 736-745.
Frederiks TM, Christopher JT, Fletcher SEH, and Borrell AK (2011b), Variation in frost susceptibility of barley (Hordeum vulgare L.) during head-emergence and implications for phenotyping. In Hausman J. -F, Renaut J, Sergeant K and Hoffmann L. (Eds.) ‘9th International Plant Cold Hardiness Seminar’. Luxembourg, 17–22 July. Centre de Recherche Public Gabriel Lippmann.
Hayman P, Alexander B, Knell G and Rebbeck M (2007), The balancing act of managing frost risk. In: Managing frost risk a guide for southern Australian grains. Eds. Rebbeck, M. and Knell, G. pp. 12–19. South Australian Research and Development Institute and Grains Research and Development Corporation.
Kelleher FM, Rollings NM, Poulton DM and Cornish PS (2001), Temperature variation and frost risk in undulating cropland. Proceedings of the 10th Australian Agronomy Conference, Hobart, 29th January – 1st February.
Livingston JE and Swinbank JC (1950), Some factors influencing the injury to winter wheat heads by low temperatures, Agronomy Journal. 42, 153–157.
Marcellos H and Single WV (1975), Temperatures in wheat during radiation frost, Australian Journal of Experimental Agriculture and Animal Husbandry 15, 818–822.
Paulsen G and Heyne E (1983), Grain production of winter wheat after spring freeze injury. Agronomy Journal 75, 705–707.
Single W (1987), Resistance to frost injury during stem elongation and early heading. Proceedings of the ICARDA-INIA symposium, International symposium on improving winter cereals under temperature, drought and salinity stresses, October 26–29, 1987, Cordoba, Spain, 131–141.
Single W (1964), Studies on frost injury to wheat. II. Ice formation within the plant. Australian Journal of Agricultural Research, 15, 869–875.
Woodruff D, Douglas N and French V (1997), Frost damage in winter crops, The State of Queensland Department of Primary Industries, Brisbane.
Woodruff D and Tonks J (1983), Relationship between time of anthesis and grain yield of winter genotypes with differing developmental patterns. Australian Journal of Agricultural Research 34, 1–11.
Zheng B, Chapman S.C., Christopher J.T., Frederiks T., Chenu K (2015) Frost trends and their estimated impact on yield in the Australian wheatbelt. Journal of Experimental Botany 66:3611–3623
Acknowledgements
The research undertaken as part of UQ00071 is made possible by the support of the GRDC. The authors would like to thank them for their continued support.
Contact details
Troy Frederiks
Queensland Department of Agriculture, Fisheries and Forestry
Leslie Research Facility, 13 Holberton St Toowoomba, 4350
Email: troy.frederiks@qld.gov.au
Ph: 07 4639 8876
Jack Christopher
University of Queensland, QAAFI
Leslie Research Facility, 13 Holberton St Toowoomba, 4350
Email: j.christopher@uq.edu.au
Ph: 07 4639 8813
Andrew Borrell
University of Queensland, QAAFI
Hermitage Research Facility, Yangan Rd via. Warwick
Email: a.borrell@uq.edu.au
Ph: 07 4660 3640
GRDC Project Code: UQ00071,
Was this page helpful?
YOUR FEEDBACK