The irrigated cereal and canola project update
Author: Damian Jones (Irrigated Cropping Council). | Date: 28 Jul 2016
Background
This project is aiming to improve adviser and grower knowledge of high yielding irrigated cereal and canola varieties and specific agronomy management that will improve profitability under irrigation.
The project involves research trials conducted over six nodes (locations). These are Murrumbidgee, (Leeton Field Station, Yanco Agricultural Institute and Coleambally); Murray Valley (Rice Research Australia Pty Ltd, Jerilderie); North West Victoria (Kerang); Lachlan (Condobolin and Hillston); South East South Australia (Naracoorte); and Tasmania (Cressy).
The overall outcome of this project is to demonstrate the increase in the production of irrigated cereal and canola varieties through improved agronomic management, selection of better varieties for their situation and to provide a greater understanding of the irrigation layouts across the nodes and water impacts to attain maximum yields.
Methodology
The nodes have identified the research questions that growers and advisers are asking so that production agronomy details will be captured for system development. Each node has developed a trial program to address these questions and range from variety evaluation, sowing timing and rates, row spacings and nutrition, to the use of plant growth regulators (PGRs). The culmination of this data will provide specific irrigation practices encompassed with varietal information to provide to advisers in each zone. These will also be developed into extension materials to support growers and their advisers with decision making.
The project has a large component focusing on the best management strategies for canola and cereals. The data captured will guide growers with issues such as pre-watering, water efficiency and decision making later in the season.
Results and discussion
Variety trials at Kerang
Barley
Sown on 6 May into moist soil following pre-irrigation in April, the trial got away to a reasonable start. Sowing rates varied from 91 to 115kg/ha depending on seed size, targeting an establishment of 175 plants/m2. Emergence was consistent across the trial and plant counts indicated establishment was slightly below target at 163 plants/m2. Enough nitrogen (N) was applied for a 7t/ha crop.
The trial received a fungicide (propiconazole@ 250ml/ha) in mid-July as there was some spot form of net blotch present from recent rain. Little foliar disease was observed later in the season.
First spring irrigation was on 6 September, the second on 18 September and a third on 2 October for a total of 2.8Ml/ha. The trial did receive a fourth irrigation on 16 October, which was probably unnecessary, but as the trial was in the same bay as the fabas, this was unavoidable.
The trial was harvested on 20 November and averaged 8.22t/ha (Figure 1).
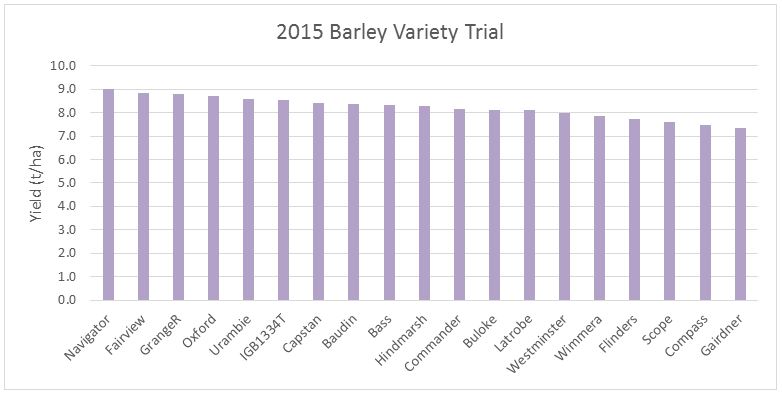
Figure 1: Barley variety yields at Kerang trial site.
The least significant difference (LSD) for the trial was 0.67t/ha.
Of note is the new IMI-tolerant barley IGB1334T, recently named Spartacus CL. Yield was good and it lodged less than Scope.
Table 1 summarises the performance of the varieties compared to Commander from the trials conducted at Kerang, as well as from the Irrigated Cereals Project (ICP) that was across a number of sites in the Murray and Murrumbidgee Valleys over four years.
Table 1: Summary of the yield performance of the varieties compared to Commander.
| Barley | 2010 | 2011 | 2012 | 2013 | 2014 | 2015 | Average | ICP |
|---|---|---|---|---|---|---|---|---|
| Oxford | 120% | 123% | 114% | 109% | 107% | 115% | 108% | |
| Urambie | 100% | 101% | 114% | 105% | 105% | |||
| Westminster | 123% | 114% | 104% | 103% | 98% | 108% | ||
| Fairview | 102% | 108% | 105% | 104% | ||||
| GrangeR | 98% | 107% | 108% | 104% | ||||
| Hindmarsh | 100% | 115% | 115% | 96% | 103% | 101% | 102% | 96% |
| Capstan | 95% | 98% | 103% | 100% | 104% | |||
| Commander | 100% | 100% | 100% | 100% | 100% | 100% | 100% | 100% |
| Bass | 100% | 105% | 102% | 99% | 96% | |||
| La Trobe | 99% | 99% | ||||||
| Gairdner | 78% | 117% | 111% | 90% | 90% | 97% | 87% | |
| Baudin | 95% | 106% | 99% | 100% | 103% | 96% | 94% | |
| Wimmera | 103% | 96% | 96% | 96% | ||||
| Navigator | 93% | 110% | 96% | 92% | ||||
| Buloke | 97% | 107% | 90% | 90% | 99% | 93% | 90% | |
| Compass | 94% | 91% | 93% | |||||
| Scope | 87% | 93% | 90% | |||||
| Commander t/ha | 7.34 | 6.38 | 7.92 | 8.23 | 6.35 | 8.16 | 6.94 | 7.17 |
Canola
The variety trial contains a mix of commercially available varieties, including Roundup Readies® (RRs), Triazine Tolerants (TTs) and Clearfields (CLs). The trial is managed as a ’conventional’ trial, i.e. the herbicide tolerant varieties do not have their respective herbicides applied. Due to the nature of the trial, the maturity range of the varieties sown cannot be too great. Therefore, the trial features mainly mid-season varieties and those with maturities either side, based on our experience that given our sowing date of late April, highest yielding varieties have been predominately the mid to mid-late maturity varieties
Sowing is at variable rates that range from 3.2 to 4.5kg/ha targeting 40 plants/m2 on 24 April, then watered up. Establishment was excellent and averaged 60 plants/m2. Enough N was applied for a 4t/ha crop.
First spring irrigation was on 6 September, the second on 18 September and the third on 2 October, for a total of 2.8Ml/ha.
The trial was windrowed on 2 November, with some varieties reaching the 100 per cent black seed stage (Diamond and 44Y89). The trial was windrowed early in the morning so as to minimise any shattering that might have occurred. No varieties suffered from excessive lodging, and the trial was harvested on 17 November.
Figure 2 shows the yield results, with the trial average being 3.8t/ha. As per the normal trend for our trial, the TTs, as a group, were the lowest yielding (3.58t/ha), with the CLs next (3.75t/ha), then the RRs (4.11t/ha) and the conventionals (although there are only two varieties) (4.33t/ha).
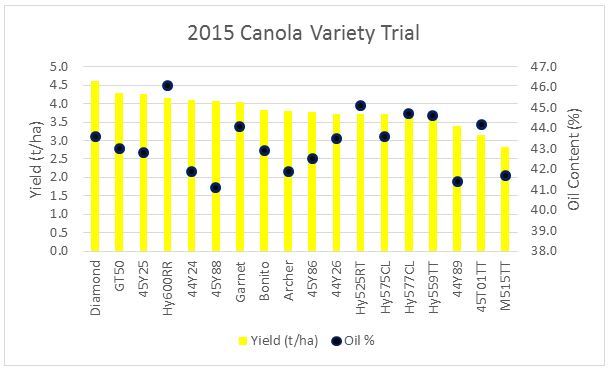
Figure 2: Barley variety yields at Kerang trial site. The LSD for yield was 0.47t/ha.
Table 2: Medium term performances of the canola varieties at Kerang.
| Canola | 2011 | 2012 | 2013 | 2014 | 2015 | Average |
|---|---|---|---|---|---|---|
| Diamond | 121% | 114% | 118% | |||
| 45Y25 | 118% | 105% | 112% | |||
| Hyola®600RR | 113% | 103% | 108% | |||
| GT50 | 97% | 117% | 106% | 107% | ||
| 45Y88 | 108% | 101% | 105% | |||
| AVGarnet | 100% | 100% | 100% | 100% | 100% | 100% |
| 44Y26 | 97% | 92% | 95% | |||
| Hyola®525RT | 95% | 92% | 94% | |||
| Hyola®577CL | 86% | 101% | 92% | 93% | ||
| Bonito | 85% | 94% | 90% | |||
| 44Y89 | 95% | 84% | 90% | |||
| Hyola®575CL | 79% | 84% | 99% | 92% | 89% | |
| 45Y86 | 81% | 90% | 86% | 93% | 88% | |
| Hyola®559 TT | 69% | 87% | 89% | 101% | 87% | |
| Hyola®505RR | 84% | 76% | 83% | 80% | ||
| ATR Gem | 72% | 85% | 79% | |||
| ATR Stingray | 91% | 73% | 60% | 75% | ||
| AVGarnet t/ha | 3.29 | 4.84 | 4.68 | 4.09 | 4.05 | 4.38 |
Milling oats
Oats made a comeback into the 2015 trials. An interest from buyers for milling oats plus several new varieties saw a two part trial sown in early and late May to evaluate the grain and hay potential of a small selection of oat varieties. The early sowing was intended to show both the grain and hay potential and the cutting dates that may make some of the varieties suitable for double cropping. The second trial was intended to show the grain yield potential under a dry start/no pre-irrigation (hence later sowing) conditions.
The first trial was sown, following pre-irrigation, on 7 May with variable sowing rates ranging from 67-86kg/ha aiming at an establishment of 180 plants/m2.
The trial was supplied with a total of 200kg N/ha from all sources (soil, mineralisation and fertiliser). Presumably this was enough for a 6t/ha grain crop or 12t/ha hay crop (although the exact N requirement is unclear and based on a general cereal rate that probably errs on the low side to avoid high nitrate content in the hay).
Only the first sowing was assessed for dry matter production (Figure 3). The quadrat cuts were taken at milky stage. The data was highly variable and so should be viewed with caution. Feed quality was not assessed and Williams produced thick tough stems that may have produced poor quality hay.
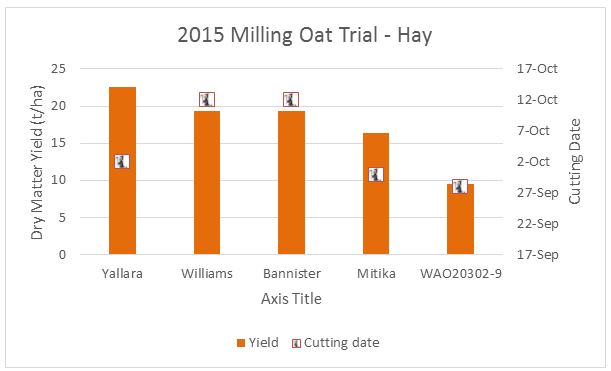
Figure 3: Milling oat variety yields at Kerang trial site.
The 7 May sowing was harvested for grain on 20 November, as well as WAO2030 from the second sowing. The second sowing harvest was completed on 30 November.
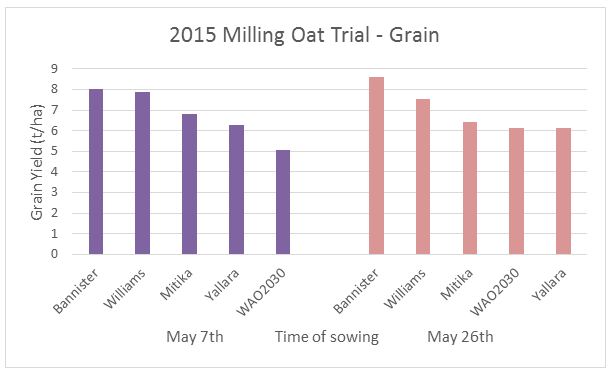
Figure 4: Milling oat variety yields at Kerang trial site for two times of sowings. LSD between varieties is 0.51t/ha and time of sowing (TOS) is 0.32t/ha.
Figure 4 shows that Bannister and WAO performed better in the second TOS, while Williams and Mitika preferred the earlier sowing. Yallara performed equally from both TOS.
From the first sowing, Bannister and Williams performed equally, while the rest were all significantly different to one another. In the second TOS, Bannister was the best performer, with Williams next and then the rest performed similarly.
From the above data, Bannister would be the milling oat of choice. Although the line WAO2030 did not yield as well, its early maturity would make it suitable for a double cropping situation.
Main season trial
Wheat
This trial was sown, following pre-irrigation, on 4 May with variable sowing rates ranging from 69 - 113kg/ha aiming at an establishment of 175 plants/m2. Conditions at sowing were moist but drying. Establishment was below expectation at 56 per cent instead of the normal 70 per cent, for an average plant population of 135 plants/m2. Enough N was applied for a 7t/ha crop. The trial received a fungicide application as a prophylactic treatment as no stripe rust or other foliar disease was detected through the season.
First spring irrigation was on 7 September, the second on 18 September, the third on 3 October and the fourth irrigation on 16 October, for a total of 3.8Ml/ha.
Table 3 summarises the performance of the varieties from the trials conducted at Kerang, as well as from the Irrigated Cereals Project (ICP) that was across a number of sites in the Murray and Murrumbidgee Valleys over four years.
Table 3: Performance of the wheat varieties relative to Scout from the trials conducted at a number of different locations.
| Wheat | 2009 | 2010 | 2011 | 2012 | 2013 | 2014 | 2015 | Average | ICP |
|---|---|---|---|---|---|---|---|---|---|
| Beaufort | 104% | 106% | 94% | 112% | 103% | 104% | 95% | ||
| Trojan | 98% | 105% | 106% | 98% | 102% | ||||
| Cobra | 99% | 108% | 102% | 98% | 101% | ||||
| Scout | 100% | 100% | 100% | 100% | 100% | 100% | 100% | 100% | 100% |
| Mace | 95% | 98% | 97% | 97% | |||||
| Sentinel | 87% | 108% | 107% | 87% | 93% | 96% | 99% | ||
| Gazelle | 95% | 100% | 103% | 91% | 92% | 96% | |||
| Kiora | 93% | 96% | 98% | 96% | |||||
| Lancer | 95% | 97% | 94% | 95% | 95% | ||||
| Chara | 100% | 97% | 94% | 88% | 89% | 88% | 93% | 100% | |
| Derrimut | 108% | 88% | 94% | 83% | 95% | 84% | 89% | 92% | 99% |
| Phantom | 87% | 97% | 87% | 91% | |||||
| Axe | 84% | 109% | 78% | 90% | 91% | ||||
| Yenda | 103% | 80% | 87% | 88% | 89% | 100% | |||
| Suntop | 92% | 92% | 95% | 78% | 89% | 100% | |||
| DS Darwin | 92% | 86% | 89% | ||||||
| Merlin | 80% | 97% | 87% | 88% | |||||
| Wallup | 90% | 84% | 88% | 87% | |||||
| Impala | 89% | 90% | 85% | 85% | 86% | 87% | |||
| Spitfire | 82% | 95% | 90% | 90% | 77% | 87% | |||
| Shield | 89% | 87% | 84% | 87% | |||||
| Elmore | 91% | 85% | 84% | 97% | 87% | ||||
| SF Adagio | 74% | 97% | 85% | ||||||
| Mitch | 90% | 81% | 85% | ||||||
| Wedgetail | 87% | 97% | 73% | 76% | 90% | 85% | 96% | ||
| Ventura | 97% | 86% | 73% | 79% | 84% | 91% | |||
| Viking | 83% | 88% | 78% | 83% | |||||
| Scout t/ha | 7.4 | 7.7 | 7.21 | 8.9 | 9.0 | 7.6 | 8.7 | 8.1 | 8.0 |
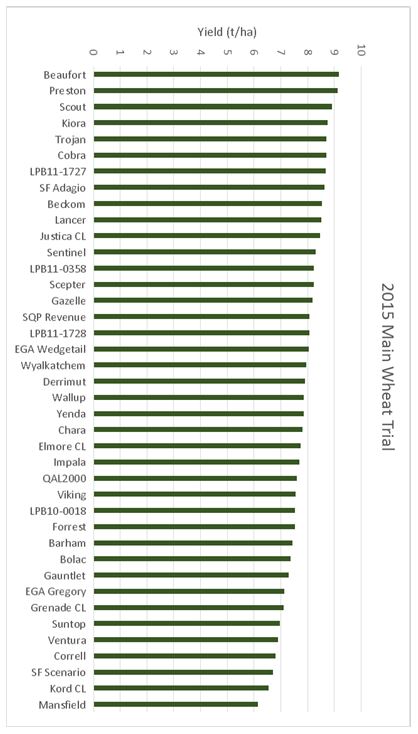
Figure 5: Performance of the wheat varieties from the trials conducted at various locations. LSD was 0.84t/ha.
Soil moisture monitoring is essential
A consistent message for the past 20 years has been soil moisture monitoring is essential. The original tensiometers had their problems but new soil moisture monitoring equipment is leaps and bounds ahead with ease of installation, maintenance and access to the information.
Thanks to the Department of Economic Development, Jobs, Transport and Resources (DEDJTR) soil moisture monitoring project, we had access to the soil moisture data as required, from anywhere. It was invaluable to managing the faba crop as we could watch the moisture levels decline (rapidly) after irrigation and then predict when they would hit the trigger points again. It was interesting comparing the objective monitoring data with being in the paddock with a shovel and subjectively thinking that we still had moisture. In the end, the harvest data (fabas at 4t/ha) confirmed that we had made the right decision (at least from a yield perspective) to utilise the monitoring data.
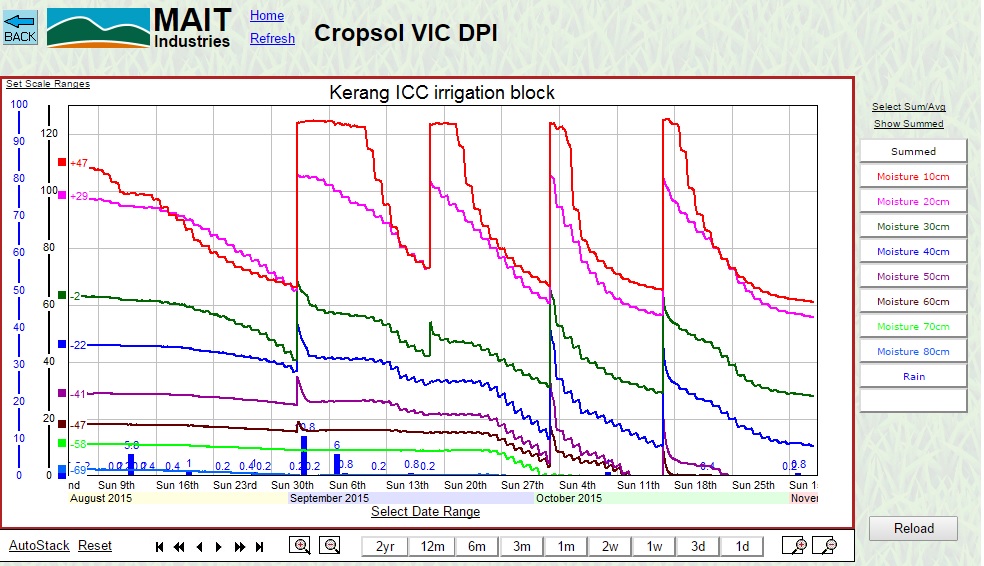
Figure 6: Soil moisture monitoring data.
Figure 6 provides an example of the soil moisture monitoring information that was used. The scale on the left hand side of the graph is not important. It is knowing that when the line drops to ’35’, we have no available moisture left. If you dug into the bay, it would still appear to have moisture but the plant cannot draw it from the soil. The lines of the 10cm and 20cm probes show waterlogging (where they flat-line after irrigation and rain) and how quickly the soil moisture disappeared (steepness of the line) during those hot days in early October. Another interesting observation is the depth at which the plants were obtaining moisture. I would not have expected fabas to draw moisture from the 70cm (and probably 80cm) depth. However, while they may have been able to access this moisture, they can only do so slowly and will not keep the plant supplied with moisture on a hot day if there is no moisture higher up the profile.
Barley fungicide and plant growth regulator trial
We have trialled the use of the PGRs on barley over the past few years with promising but not necessarily consistent results. 2012 and 2013 saw yield increases, but not 2014, and the yield increases could not be simply explained by reduced lodging. Similarly, we have seen increased yields with the use of a fungicide early in the season with no apparent leaf disease.
The barley trial was sown with Commander barley (susceptible (S ) to scald; moderately susceptible- susceptible (MS-S) to spot form of net blotch) to examine the effect of the PGR trinexapac-ethyl (Moddus or Marvelɸ) as well as a range of fungicides (Table 4).
ɸModdus and Marvel are not registered in barley but Modduss Evo is registered in barley and Marvel is registered in turf.
Table 4: Products tested in barley trial.
| Fungicide | Active Ingredient | Rate |
|---|---|---|
| Orius® | 400g/l Tebuconazole | 290ml/ha |
| Prosaro® | 210g/l Prothioconazole 210g/L Tebuconazole |
200ml/ha |
| Radial® | 75g/l Epoxiconazole + 75g/l Azoxystrobin |
420ml/ha |
| TILT®XTRA | 250g/L Propiconazole 80g/l Cyproconazole |
250ml/ha |
n.b. The use of these products (rates) were for experimental purposes. Please check label recommendations and follow as directed.
All fungicides were applied at second node stage (Z32), with the TILT® XTRA treatment receiving a second application at flag leaf emergence (Z39), done so to continue protecting the whole canopy rather than targeting the flag leaf.
No obvious disease was noted on the plants throughout the season.
The PGR treatments were a one and two spray strategy. The one spray strategy consisted of one application of trinexapac-ethyl (Marvelɸ @ 570ml/ha) at 2nd node (Z32) stage. The two spray strategy saw an application at 2nd node Marvelɸ @ 570ml/ha) and again at flag leaf emergence (Z39) (Marvelɸ @ 285ml/ha). The second spray is applied to stop ’bounce back’ or where the crop can compensate under good growing conditions for the earlier PGR application and recover to the original height of the unsprayed crop.
ɸThese rates are within the range on the label but the product is not registered for use on barley.
Table 5: Products tested in barley trial.
| Treatment | Yield (t/ha) | Protein % | Retention % | Screenings % | Test Wt kg/hl | Height cm |
|---|---|---|---|---|---|---|
| Marvel™@32 | 6.49a | 8.5 | 95.7 | 1.2 | 71.4bc | 68.3c |
| Prosaro®@32 | 6.18ab | 9.0 | 96.9 | 1 | 72.6ab | 85.0a |
| Marvel™@32,39 | 6.17ab | 9.1 | 95.9 | 1.1 | 72.1abc | 70.0bc |
| Radial®@32 | 5.96bc | 8.7 | 96.9 | 1 | 72.6ab | 73.3bc |
| Orius®@32 | 5.80bc | 8.2 | 97.3 | 1 | 71.1bc | 76.7abc |
| TILT®XTRA@32,39 | 5.69c | 8.9 | 97.5 | 0.9 | 73.4a | 78.3ab |
| Control | 5.58c | 8.8 | 97.1 | 1 | 73.1a | 75.0bc |
| p | 0.007 | 0.17 | 0.06 | 0.67 | 0.023 | 0.021 |
| lsd | 0.42 | NS | NS | NS | 1.3 | 8.68 |
| cv% | 4.0 | 1.0 | 6.5 |
Numbers with a similar suffix are statistically equivalent. NS = Not Significant - all treatment results are not statistically different.
n.b. The use of these products (rates) were for experimental purposes. Please check label recommendations and follow as directed.
Marvel™ and Prosaro® did improve yields above that of the control. The Marvel™ treatments did have the shortest crop height but not statistically different to that of the control. On the other hand, Prosaro® did promote extra crop height.
None of the treatments had any effect on protein, screenings or retention.
Once again, the PGR trinexapac-ethyl has shown to produce a yield benefit, and again for no obvious reason.
The other interesting result was from the Prosaro® i.e. increased crop height and yield. The diseases controlled are similar to those controlled by TILT® XTRA so it is unlikely that disease control was the reason. Even if Prosaro® had a longer protective period, disease pressure was minimal. The increased height is also a mystery as Prosaro® can be used as a PGR at higher rates.
Conclusion
The trial results indicated that the variety ’best bets’ were:
Wheat: Scout (all-rounder^), Cobra, Trojan
Barley: Westminster (m), Oxford (f), Hindmarsh/La Trobe (all-rounder^)
Canola: Diamond, GT50, Hy559TT
Fabas: Samira
Oats: Bannister
^ performs well both in dryland and irrigated situations
However no matter what variety you choose, getting the package (sowing date, sowing rate, pre-irrigation, nutrition, disease management, irrigation scheduling, PGR, etc.) right is essential for success.
Useful resources
Irrigated Cropping Council Trial Results Summaries from the ICC website
Acknowledgements
The research undertaken as part of this project is made possible by the significant contributions of growers through both trial cooperation and the support of the GRDC, the author would like to thank them for their continued support.
Contact details
Damian JonesPO Box 238 Kerang, 3579
0409 181 099
damian.jones@irrigatedcroppingcouncil.com.au
GRDC Project Code: DAN000198,
Was this page helpful?
YOUR FEEDBACK