Australian farmland values 2015 report
Author: Andrew Smith (Rural Finance) | Date: 17 Aug 2016
Introduction
The value of land underpins farming businesses and rural communities. Understanding farmland values is important to everyone in agribusiness, especially Australia’s farmers.
The Ag Answers Australian Farmland Values 2015 report is based on actual farm sales since 1995 using data collected by the official government agency in each state and territory, which is then compiled by APM PriceFinder.
The analysis draws on more than 220,000 transactions over 20 years, accounting for 264 million hectares of land with a combined value of $124 billion.
The national median* farmland price increased by 5.3 per cent in 2015. This follows a 6.8 per cent increase in 2014 and a 2.2 per cent decrease in 2013.
The performance of farmland prices in different states was mixed in 2015. The median farmland price increased in Tasmania (+12.8%), Queensland (+3.3%), New South Wales (+10.2%) and Western Australia (+10.6%), but fell in Victoria (-2.3%), South Australia (-1.9%) and the Northern Territory (-6.4%) compared to the previous year.
In all states, the median price has trended higher over the past decade with average annual growth exceeding three per cent in most states. As inflation has run at 2.8% over the same period, this indicates real growth in farmland values. Although the median price has remained high over the past decade, the number of transactions** has trended lower.
Extend the investment horizon to 20 years and the farmland value growth picture becomes better still, with the median price in most states recording average annual growth above 5.5 per cent (Figure 1).
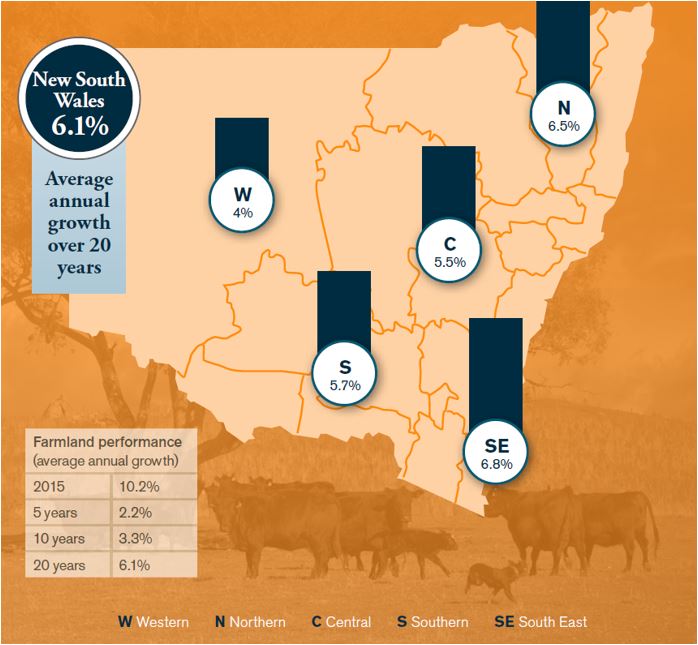
Figure 1: Farmland performance measured as growth in farmland prices for the different regions in New South Wales.
About the research
Farmland prices are a function of many variables including, but not limited to rainfall, location, agricultural industry, productivity, land quality, sentiment, interest rates, commodity prices and the performance of the wider economy. To isolate the reason for a particular movement in the median price for a region is complex. Therefore, the focus of the report is to describe regional and state trends more so than the drivers behind the observed trends.
The report is a guide to the market value trends of commercial farming property and is not intended for use as a valuation tool. A qualified professional is required to assess the value of a property.
This analysis tracks the median price of commercial farmland in dollars per hectare by eliminating, where possible, metropolitan and small block sales, as well as sales where one party has compulsory powers. Further, small farms are excluded to limit the impact of ‘lifestyle farming’ on the results.
As property settlement periods vary, some 2015 sales will not be captured in this report at the time of publication. The median price for the most recent year is a preliminary one and will be revised at least annually.
The prices used in the report are based on the total sale price and therefore include the value of capital improvements. Growth in values may reflect an element of capital improvement on properties. Similarly, if water entitlements are attached to a land title and sold with the property the value of the water will be included in the sale price. If water entitlements are sold separately from the land, this value will not be captured in the sale price.
*The report uses medians to provide a measure of the mid-point of farmland prices as a guide to market activity. Compared with an average, the median is not as readily distorted by unusually high or low prices. Even so, in areas where there have been very few sales, the results should be viewed with caution as the year-on-year change in median price may not be indicative of an actual change in farmland value. A higher proportion of lower-priced sales can result in a lower median and vice-versa.
**Farmland sales volume is reported as the estimated number of transactions. Farms are sold as single or multiple lots, which obscures the view of the number of farms sold, particularly in cases where one farm is sold as multiple lots to multiple buyers. Accordingly, the ‘number of transactions’ should not be interpreted as the number of farms sold and should only be used as a guide to market activity.
State performance
The median value of New South Wales farmland increased by 10.2 per cent in 2015 following a 7.2 per cent increase in 2014.
There has been three distinct periods of growth over the past 20 years (Figure 2):
- • The median price grew at an average of 8.9 per cent per year between 1995 and 2005.
- • A period of steady growth followed between 2006 and 2013, averaging two per cent per year.
- • The past two years have seen average annual growth increase to 8.7 per cent.
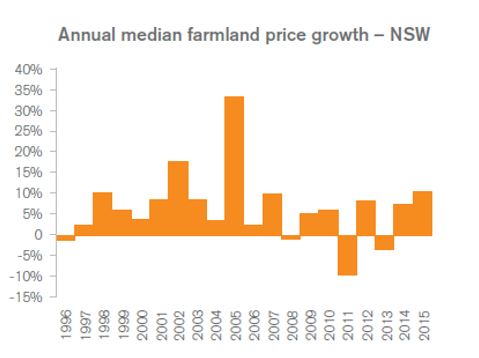
Figure 2: Annual median farmland price growth for NSW farmland from 1995 to 2015.
The number of farmland transactions per year has been trending lower since a peak of 5.687 in 2003, although it has increased in the past few years. In 2015, there were an estimated 3,825 transactions (Figure 3).
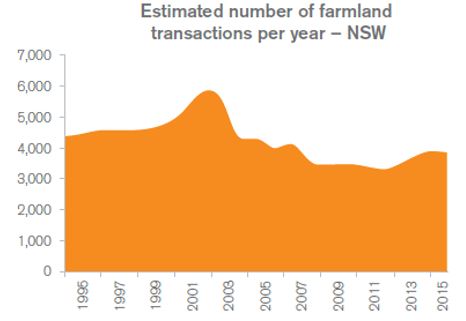
Figure 3: Estimated number of farmland transactions for NSW farmland from 1995 to 2015.
The area of farmland traded in 2015 was approximately 1.8 million hectares, which is equivalent to 3.7 per cent of farmland in New South Wales. The total value of farmland traded in 2015 was approximately $2.92 billion.
The South East region of the state performed best in 2015 with a 14% increase in the median price compared to 2014. This area covers the Southern Highlands down to the South East Coast of New South Wales. Other top performing regions in 2015 were the Central region (+5%) and Southern region (+11%), which covers the Riverina and Murray sub-regions. The Western and Northern regions recorded negative growth in 2015 of -7 per cent and -2 per cent, respectively (Figure 4, Table 1).
Farmland values are based on all farmland (including governments), not just arable land.
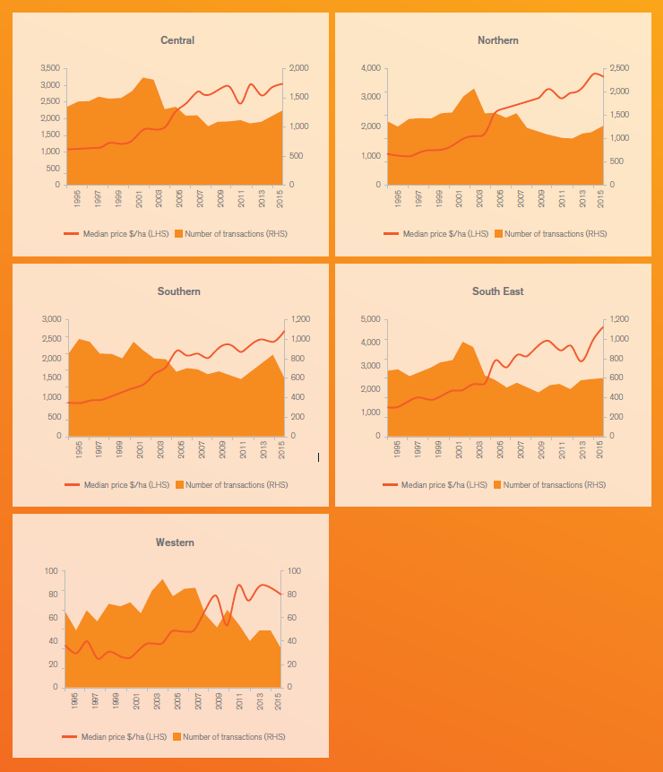
Figure 4: Farmland performance values for regions within New South Wales.
Table 1: Farmland sales by municipality – New South Wales.
| Municipality | Region | Median $/ha | Est. # of transactions 2015b | |
|---|---|---|---|---|
| 2015a | 3 year average | |||
| Albury | Southern | 4,515 | 2 | |
| Armidale Dumaresq | Northern | 4,942 | 4,024 | 29 |
| Ballina | Northern | 6,695 | 12,414 | 9 |
| Balranald | Western | 112 | 2 | |
| Bathurst | Central | 2,930 | 3,779 | 51 |
| Bega Valley | South East | 6,150 | 5,449 | 51 |
| Bellingen | Northern | 6,178 | 6,699 | 17 |
| Berrigan | Southern | 3,075 | 2,640 | 25 |
| Bland | Southern | 1,463 | 1,307 | 42 |
| Blayney | Central | 4,539 | 4,738 | 23 |
| Bogan | Central | 401 | 372 | 21 |
| Bombala | South East | 2,416 | 1,865 | 28 |
| Boorowa | South East | 3,212 | 2,695 | 29 |
| Bourke | Western | 60 | 73 | 6 |
| Brewarrina | Western | 157 | 127 | 11 |
| Broken Hill | Western | 0 | ||
| Byron | Northern | 15,041 | 14,934 | 7 |
| Cabonne | Central | 4,578 | 4,094 | 66 |
| Carrathool | Southern | 978 | 890 | 31 |
| Central Darling | Western | 81 | 1 | |
| Cessnock | Central | 15,095 | 11,972 | 30 |
| Clarence Valley | Northern | 4,377 | 4,383 | 134 |
| Cobar | Western | 78 | 74 | 11 |
| Coffs Harbor | Northern | 6,783 | 8,023 | 14 |
| Conargo | Southern | 2,493 | 2,055 | 32 |
| Coolamon | Southern | 2,545 | 2,563 | 15 |
| Cooma-Monaro | South East | 1,799 | 1,745 | 64 |
| Coonamble | Central | 1,282 | 1,200 | 30 |
| Cootamundra | Southern | 3,770 | 4,152 | 6 |
| Corowa | Southern | 3,583 | 3,181 | 20 |
| Deniliquin | Southern | 2,379 | 2 | |
| Dubbo | Central | 1,322 | 1,716 | 15 |
| Dungog | Central | 7,945 | 6,527 | 46 |
| Eurobodalla | South East | 6,723 | 8,849 | 16 |
| Forbes | Central | 2,310 | 2,282 | 57 |
| Gilgandra | Central | 1,756 | 1,498 | 40 |
| Glen Innes Severn | Northern | 2,534 | 2,747 | 45 |
| Gloucester Shire Council | Central | 4,346 | 3,513 | 25 |
| Goulburn Mulwaree | South East | 7,710 | 6,602 | 114 |
| Great Lakes | Central | 8,176 | 7,389 | 74 |
| Greater Hume | Southern | 4,216 | 4,282 | 54 |
| Greater Taree | Central | 7,371 | 6,445 | 92 |
| Griffith | Southern | 4,216 | 4,282 | 54 |
| Gundagai | Southern | 3,038 | 2,869 | 22 |
| Gunnedah | Northern | 4,215 | 3,692 | 40 |
| Guyra | Northern | 3,334 | 3,501 | 28 |
| Gwydir | Northern | 1,882 | 1,794 | 68 |
| Harden | Southern | 4,545 | 4,228 | 21 |
| Hay | Southern | 501 | 605 | 15 |
| Inverell | Northern | 2,213 | 1,671 | 66 |
| Jerilderie | Southern | 1,983 | 1,868 | 15 |
| Junee | Southern | 3,759 | 3,570 | 24 |
| Kempsey | Northern | 4,540 | 4,537 | 68 |
| Kyogle | Northern | 4,213 | 4,764 | 98 |
| Lachlan | Central | 877 | 864 | 48 |
| Leeton | Southern | 3,066 | 2,425 | 15 |
| Lismore | Northern | 7,961 | 9,707 | 49 |
| Lithgow | Central | 6,429 | 5,617 | 57 |
| Liverpool Plains | Northern | 3,752 | 4,158 | 32 |
| Lockhart | Southern | 3,325 | 3,043 | 27 |
| Maitland | Central | 14,841 | 14,115 | 10 |
| Mid-Western | Central | 2,663 | 2,694 | 121 |
| Moree Plains | Northern | 3,171 | 2,814 | 35 |
| Murray | Southern | 1,901 | 1,850 | 25 |
| Murrumbidgee | Southern | 2,227 | 1,915 | 9 |
| Muswellbrook | Central | 7,305 | 8,821 | 21 |
| Nambucca | Northern | 8,423 | 6,232 | 24 |
| Narrabri | Northern | 1,967 | 2,182 | 56 |
| Narrandera | Southern | 1,779 | 1,579 | 29 |
| Narromine | Central | 1,855 | 1,707 | 24 |
| Oberon | Central | 6,053 | 5,081 | 49 |
| Orange | Central | 13,886 | 11,726 | 7 |
| Palerang | South East | 4,940 | 4,927 | 86 |
| Parkes | Central | 1,345 | 1,400 | 41 |
| Port Macquarie-Hastings | Northern | 7,634 | 6,307 | 62 |
| Richmond Valley | Northern | 3,940 | 4,029 | 85 |
| Shoalhaven | South East | 2,270 | 2,143 | 34 |
| Snowy River | South East | 2,270 | 2,143 | 34 |
| Tamworth | Northern | 4,561 | 3,199 | 105 |
| Temora | Southern | 2,964 | 2,690 | 24 |
| Tenterfield | Northern | 1,814 | 2,001 | 79 |
| Tumbarumba | Southern | 2,593 | 3,680 | 23 |
| Tumut | Southern | 2,977 | 2,886 | 18 |
| Tweed | Northern | 12,169 | 11,788 | 25 |
| Upper Hunter | Central | 2,572 | 2,681 | 60 |
| Upper Lachlan | South East | 3,381 | 3,161 | 126 |
| Uralla | Northern | 2,331 | 2,037 | 25 |
| Urana | Southern | 2,984 | 2,579 | 9 |
| Wagga Wagga | Southern | 4,067 | 3,617 | 61 |
| Wakool | Southern | 1,625 | 1,349 | 23 |
| Walcha | Northern | 3,028 | 3,274 | 46 |
| Walgett | Northern | 1,159 | 1,069 | 19 |
| Warren | Central | 1,266 | 1,210 | 26 |
| Warrumbungle | Central | 1,593 | 1,517 | 81 |
| Weddin | Central | 2,580 | 2,342 | 23 |
| Wellington | Central | 2,833 | 2,565 | 37 |
| Wentworth | Western | 124 | 0 | |
| Yass Valley | South East | 5,055 | 5,512 | 33 |
| Young | Southern | 4,070 | 3,711 | 16 |
| Central | 3,082 | 2,913 | 1293 | |
| Northern | 3,705 | 3,582 | 1265 | |
| Western | 79 | 84 | 34 | |
| Southern | 2,681 | 2,519 | 623 | |
| South East | 4,660 | 3,977 | 610 | |
aUse price information with a small volume of transactions with caution.The median price for municipalities with less than fiver sales in 2015 is not reported.
bRefer ‘About the research’ section.
Conclusion
Of all the states, the median farmland price in New South Wales has demonstrated the most consistent growth over the past 20 years. Land values are influenced by the level of multi-industry opportunity which adds competition to the market place, therefore aiding positive growth in the median price. Climate and commodity prices are also factors in determining whether a property is placed on the market and how much it sells for. Land values in New South Wales were resilient even during the challenging seasons experienced in the mid-2000s.
Contact details
Andrew Smith
andrew.smith@ruralbank.com.au
Was this page helpful?
YOUR FEEDBACK