A preliminary exploration of non coeliac gluten avoidance behaviours in Australia
Author: Kyah Hester, Anthony Saliba and Erica McIntyre (GRDC Functional Grains Centre, Wagga Wagga, Charles Sturt University, School of Psychology, Wagga Wagga). | Date: 14 Feb 2017
Take home messages
- The prevalence of non-coeliac gluten avoidance appears to have plateaued at a rate of approximately 20%, which emulates prevalence rates in other developed countries.
- Gluten avoiders have been found to avoid more of everything food related, experience negative symptoms more frequently (both after food consumption and in general) and perceive food-related risks as more serious.
- Inherent psychological differences appear to be involved in gluten avoidance, and therefore, it is unlikely that there will be significant increases in future prevalence rates.
- Further analyses are being undertaken to identify which psychological factors best predict non-coeliac gluten avoidance.
Background
The popularity of gluten free diets has gained traction over the last decade, to a point where up to 20% of the population is now estimated to be engaged in gluten avoidance behaviours (Miller, 2016). Reported rates of gluten avoidance far exceed the estimated prevalance of gluten-related disorders, suggesting that people are choosing to go gluten free for a range of reasons which may not be medical in nature.
The increased awareness about gluten has been paired with an exponential growth in the amount of people reporting coeliac-like symptoms without the presence of autoimmune disease (Cabrera-Chavez et al., 2016). This population has been characterised as ‘gluten-sensitive’ and often reports the abatement of symptoms following the elimination of gluten from their diet. Due to the lack of biological markers identified for these sensitivity issues, a clear mechanism for the response is yet to be defined (Peters, Muir and Gibson, 2014). However, some studies have suggested that gluten itself may not be responsible for the symptoms detailed above, as there are a variety of other nutritional compounds that are also reduced when following a gluten-free diet (Biesiekierski et al., 2013). The lag in diagnostic clarity has led to an increase in self-prescribed gluten avoidance and an exacerbation of fears regarding its consumption. One study suggests that in up to 85% of cases, people who experience gluten sensitivity may be suffering from a ‘nocebo’ effect (Capannolo et al., 2015), where false risk perceptions cause symptoms rather than the consumption of gluten itself. As a consequence of this phenomenon, a large proportion of people are making the decision to adopt a gluten-free diet in the pursuit of improved health.
Perceptions about gluten evolved following the release of several books implicating it in a range of health issues (see Davis, 2011), including suggestions that a gluten-free diet would facilitate weight loss. Despite a significant lack of evidence supporting the recommendation of a gluten-free diet for non-coeliacs, or the reported links to health problems, negative beliefs about gluten developed rapidly. These beliefs fuelled a movement where people were making a conscious reduction in the amount of total gluten consumed in order to achieve better health. These ‘fad’ diets present a simple and achievable set of goals that allow people to feel effective in the management of their own health (Rousseau, 2015). They also reduce a dependency on external health providers and allow for independence to be achieved through online education and trial and error methods.
Unfortunately, the risks associated with dietary changes of this magnitude are less understood by the general population. The consequences of making unnecessary changes to gluten intake could lead to an increased body mass index (BMI) (Kabbani et al., 2012) and several major vitamin deficiencies (Shepherd and Gibson, 2013).
Considering the likely impact that perception plays in the maintenance of ongoing sensitivity issues, one must consider the psychological variables that contribute to this effect. Consumer psychology has provided extensive reviews on the cognitive errors that occur as a consequence of heuristics dependence (see Schulte-Mecklenbeck, Sohn, de Bellis, Martin and Hertwig, 2013). In situations that are highly ambiguous, such as the confusion around gluten consumption, people are even more likely to rely on pre-developed strategies to help them make decisions about how to act (Cohen and Babey, 2012; see Figure 1.). These decisions can have real and lasting effects on nutritional health if consumers lack the knowledge required to structure an alternative diet plan. Studies have shown that the majority of non-coeliac gluten avoiders (NCGA) do not engage health professionals for the ongoing management of their diets (Metchikoff, 2014). This suggests that NCGA’s are making these dietary changes on the basis of their pre-existing knowledge about gluten, which is ultimately impacted by the messages that they are exposed to.
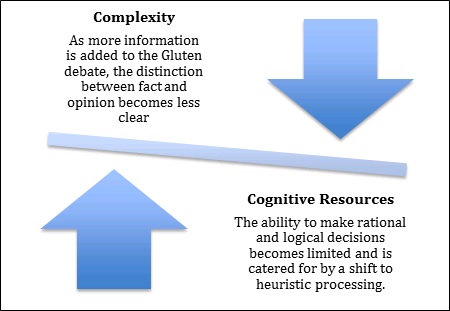
Figure 1. Adaptation from the cognitive model discussed by Cohen & Babey, 2012.
While there have been a growing number of people avoiding gluten, the majority of the population still regularly include gluten in their diets (Cabrera-Chavez et al., 2016). Despite receiving the same messages, and having access to the same information, they make the conscious decision to maintain consumption rates. This majority do not appear to be adversely impacted by the ambiguity that has manifested itself around gluten; therefore, individual differences must be at play in the formulation of the aforementioned perceptions, differentiating gluten avoiders from the consumers. Certain psychological variables may predispose gluten avoiders to react more strongly to the ambiguity surrounding gluten, driving avoidance behaviours at an internal level. If a pattern of vulnerability traits can be identified, these problematic behaviours can be better managed and the true prevalence of gluten avoidance may be estimated.
There is limited information currently available that helps us to establish a better understanding of gluten avoidance in Australia. The findings that do exist are primarily concerned with wheat-avoidance, and are offered as part of a wider food and health survey only (Golley, Corsini, Topping, Morell, & Mohr, 2015). Considering the potential risks associated specifically with unnecessary gluten avoidance, this research aimed to answer the following questions:- What proportion of the population is consciously avoiding gluten without a medical diagnosis that requires them to do so?
- How are gluten avoiders characterised? What else do we need to know to accurately understand the population?
- What does this mean about the future of wheat? Is it likely that the rate of gluten avoidance will continue to rise?
Method
Online sampling was used as the primary collection method so that a wider representative population could be sampled. This population was weighted against the latest available demographic data held by the Australian Bureau of Statistics to ensure that findings could be considered highly representative of the Australian population at large. Participants who had previously registered as research volunteers were sent an invitation to participate in the current study. All participants were offered a small monetary incentive to compensate them for their time, were at least 18 years of age and resided in Australia.Demographic data was collected through an initial demographic survey to assess prevalence rates of NCGA in Australia. This data was contrasted against the limited pre-existing literature reporting worldwide prevalence rates. The identification of demographic patterns that deviated from general population trends was used to form a characterisation of non-coeliac gluten avoidance. The development of a comprehensive online survey followed, aiming to collect more meaningful data from the newly identified population of non-coeliac gluten avoiders. Items in the study measured the frequency of avoidance behaviours, participants’ perceptions, determinants of food choice, interpersonal experiences relating to their diets and a wide range of psychological variables (including personality traits). A preliminary analysis of this data was completed to observe and measure differences between gluten avoiders and gluten consumers.
Results and discussion
Prevalence rates of gluten avoidance
The majority of participants (77.69%) reported making no attempts to avoid gluten (Figure 1). Alternatively, a total of 2.37% of people reported having received a diagnosis by their doctor which required them to avoid gluten (either a wheat allergy or coeliac disease). The remaining 20% of the population exhibited gluten avoidance behaviours to varying degrees without a medical diagnosis that required them to do so. When compared to previous data, these findings suggest that Australia’s non-coeliac uptake of the ‘gluten-free’ diet has plateaued around the 20% mark, emulating patterns and prevalence rates observed in the United States and other developed countries over the previous few years.
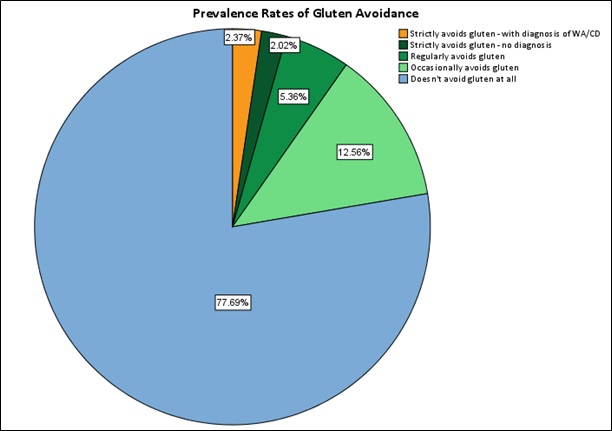
Figure 2. Prevalence rates of different gluten consumption and avoidance behaviours in the Australian population. Participants were asked only to nominate diagnoses specifically given to them by their doctor. WA = Wheat Allergy, CD = Coeliac Disease.
Demographic Profile
A chi-square test for independence indicated there was a significant association between gender and gluten avoidance [χ2(2, n = 1021) = 6.27, p < .05] where non-coeliac gluten avoiders were more likely to be female. The association between age and gluten avoidance was also found to be significant [χ2 (4, n = 1021) = 16.23, p = < .05]. When age groups were averaged into young (18-29 years), mid adult (30-49 years) and older adult (50-65+ years) groups, the prevalence of non-coeliac gluten avoidance was found to be predominantly higher in younger age groups. There were no significant relationships found between location, income or education levels of participants and their gluten consumption behaviours. However, higher trends of avoidance were observed for participants who resided in capital cities, earned a total household income of more than $1000 per week, and held a bachelor qualification or higher.
Differences in behaviours and perception
Chi-square statistics were used to explore relationships between categorical variables, by observing the differences between expected and actual frequencies. The higher the chi-square statistic, the greater the association was likely to be. The results suggest that gluten avoiders are not simply characterised by avoidance of gluten, but also by the avoidance of other food types (including dairy, eggs, carbohydrates, fats and preservatives). In all cases gluten-avoiders chose to avoid these food types at a significantly higher frequency that the gluten-consumer group, suggesting their avoidance behaviours are not unique to gluten alone. Due to the limited information available about elevated food avoidance levels for gluten avoiders, ongoing investigations are required to determine factors that drive these behaviours.
Table 1. Chi-square statistics — food avoidance.
| Food Avoided | Chi Square | P values |
|---|---|---|
| Gluten | 1521.00 | 0.000 |
| Dairy | 412.34 | 0.000 |
| Eggs | 148.20 | 0.000 |
| Carbohydrates | 296.32 | 0.000 |
| Fats | 147.01 | 0.000 |
| Preservatives | 244.79 | 0.000 |
Note: There were significant differences found between groups for the avoidance of all food types tested, suggesting that gluten avoiders restrict their consumption of a variety of food types.
Although the experience of negative symptoms following gluten was reported most frequently amongst the avoider group, this alone did not typify the population’s experience of adverse symptoms. Chi square tests revealed that there was a significantly higher amount of negative symptoms experienced by gluten avoiders following the consumption of dairy, eggs, carbohydrates, fats and preservatives, as well as gluten. There was also a strong positive correlation found [r (1) = .61, p < .01] for the amount of gluten avoided and the amount of negative symptoms experienced following its consumption across all participants.
Table 2. Chi-square statistics — experience of negative symptoms following food consumption.
| Related Food Type | Chi Square | P values |
|---|---|---|
| Gluten | 582.92 | 0.000 |
| Dairy | 266.22 | 0.000 |
| Eggs | 137.72 | 0.000 |
| Carbohydrates | 281.19 | 0.000 |
| Fats | 170.59 | 0.000 |
| Preservatives | 261.98 | 0.000 |
Note: There were significant differences found between groups for the experience of negative symptoms following all food types. This suggests that gluten avoiders experience adverse effects following the consumption of many different products, including those without gluten.
When the experience of everyday symptoms (unrelated to food consumption) was measured for both groups, gluten avoiders were found to experience a significantly higher frequency of stomach pain, back pain, other joint pain, headaches, chest pain, dizziness, fainting spells, heart palpitations, shortness of breath, pain during sex, bowel issues, gastrointestinal issues, energy levels and poor sleep.
Table 3. Chi-square statistics — experience of everyday symptoms.
| Symptom | Chi Square | P values |
|---|---|---|
| Stomach pain | 87.46 | 0.000 |
| Back pain | 17.18 | 0.000 |
| Other joint pain | 19.26 | 0.000 |
| Headaches | 20.59 | 0.000 |
| Chest pain | 9.68 | 0.008 |
| Dizziness | 22.91 | 0.000 |
| Fainting spells | 22.74 | 0.000 |
| Heart palpitations | 34.63 | 0.000 |
| Shortness of breath | 24.55 | 0.000 |
| Pain during sex | 27.92 | 0.000 |
| Constipation/diarrhoea | 57.37 | 0.000 |
| Nausea, gas or indigestion | 92.22 | 0.000 |
| Feeling tired/low energy | 30.67 | 0.000 |
| Poor sleep | 30.45 | 0.000 |
Note: There were significant differences found between groups for the experience of everyday symptoms of all types. This suggests that gluten avoiders are ailed more regularly in every aspect, not just those symptoms related to gastrointestinal issues.
Past work has considered the role that health worries play in the development of somatic symptoms, particularly in those that are experienced without medical explanation. This phenomenon continues to be contested by many, as both biological and psychological determinants are equally difficult to test for (Creed & Barsky, 2004). In the case of gluten-avoidance, those who suffer from adverse symptoms following gluten consumption may be doing so due to an overall predisposition to experience symptoms (arousability). Preliminary analyses comparing arousability levels between gluten avoiders and consumers suggest that this may in fact be the case.
There was also a strong positive correlation found [r(1) = .54 p = < .001] between the level of gluten avoidance, and the perceived risk that participants believed was associated with its consumption. Gluten avoiders perceived more overall risk associated with consuming each food type compared to consumers, supporting the suggestion that gluten avoiders are more concerned about the risks associated with food consumption. In previous studies, high avoidance types have been shown to perceive food risks as a more serious consideration of food choice than non-avoiders (Leikas, Lindeman, Roininen and Lähteenmäki, 2007). It is highly likely that such an interaction also exists for non-coeliac gluten avoidance.
Table 4. Chi-square statistics — level of perceived risk following the consumption of foods.
| Related Food Type | Chi Square | P values |
|---|---|---|
| Gluten | 383.62 | 0.000 |
| Dairy | 185.93 | 0.000 |
| Eggs | 69.65 | 0.000 |
| Carbohydrates | 137.12 | 0.000 |
| Fats | 39.03 | 0.000 |
| Preservatives | 106.29 | 0.000 |
Note: There were significant differences found between groups for the perceived level of risk associates with the consumption of all types of foods. This suggests that gluten avoiders tend to have higher overall risk perceptions when making food choices.
Conclusion
Uncertainty exists regarding the future of gluten-containing products due to the growing popularity of non-coeliac gluten avoidance in Australia. Despite the rate of uptake, research has failed to accurately characterise prevalence rates or identify predictors of these behaviours. The current study aimed to provide a preliminary exploration of these factors, as part of an ongoing study. Results suggest that current prevalence rates of non-coeliac gluten avoidance in Australia emulates past figures in other developed countries, indicating a possible plateau in the number of people adopting a gluten free diet for non-medically diagnosed reasons.
An examination of avoidance behaviours suggests that non-coeliac gluten avoiders are typified by general food avoidance not exclusive to gluten alone. They were also significantly more likely to experience frequent adverse physiological symptoms, both after the consumption of foods and on a general daily basis. Preliminary analysis suggests that gluten avoiders could be more generally arousable than consumers, leading to a complex interaction between somatisation and gluten avoidance. This relationship was further confounded by the tendency for avoiders to perceive food-related risks higher than those who consume gluten. Again these effects were generalised across all food groups, and not specific to gluten.
Further analyses are currently being performed regarding the identification of additional psychological predictors that may impact one’s willingness to avoid gluten without a medical requirement to do so. The results discussed in the current study indicate that there is a significant difference between gluten avoiders and gluten consumers, both at the physiological and psychological levels. As such, it is unlikely that the previously observed exponential rate of gluten avoidance will be ongoing. While rates of gluten avoidance may continue to show minor fluctuations, the underlying drivers of avoidance remain reasonably stable over time. Although increased misperceptions about gluten have initially fuelled a misattribution of symptoms for avoiders, upcoming research is likely to begin clarifying diagnostic information about gluten sensitivity issues so that a more accurate understanding of gluten sensitivity can be developed. This will be paired with improved education for consumers, leading to a reduction in those actively choosing to follow gluten-free diets in the pursuit of improved health without proper investigation of their symptoms.
Implications to industry
This paper contends that gluten avoidance rates have plateaued. This is in contrast to anecdotal claims in some forums — that gluten avoidance may become the norm and that nobody would consume gluten-containing products in the future. The implication of our findings is that, while gluten-free products remain a vital niche market for suffers of coeliac disease, that gluten-containing products will continue to be used well into the future by healthy consumers. There may be low to moderate interest in low-gluten products, though this category has inherent risk. It is likely that any benefit from gluten reduction relates to other compounds and if this was to be established and promulgated, consumer interest in low-gluten products would decrease rapidly. As for any other complex interaction, there is always some consumer interest across various types of gluten containing products. However, based on our data we suggest that factors other than gluten will more substantially predict uptake of newly developed or processed grains.
References
Biesiekierski, J. R., Peters, S. L., Newnham, E. D., Rosella, O., Muir, J. G., and Gibson, P. R. (2013). No effects of gluten in patients with self-reported non-celiac gluten sensitivity after dietary reduction of fermentable, poorly absorbed, short-chain carbohydrates. Gastroenterology, 145(2), 320-328. doi:10.1053/j.gastro.2013.04.051
Cabrera-Chavez, F., Granda-Restrepo, D. M., Aramburo-Galvez, J. G., Franco-Aguilar, A., Magana-Ordorica, D., Vergara-Jimenez Mde, J., and Ontiveros, N. (2016). Self-reported prevalence of gluten-related disorders and adherence to gluten-free diet in colombian adult population. Gastroenterol Res Pract, 2016, 4704309. doi:10.1155/2016/4704309
Capannolo, A., Viscido, A., Barkad, M. A., Valerii, G., Ciccone, F., Melideo, D., Latella, G. (2015). Non-celiac gluten sensitivity among patients perceiving gluten-related symptoms. Digestion, 92(1), 8-13. doi:10.1159/000430090
Cohen, D. A., and Babey, S. H. (2012). Contextual influences on eating behaviours: heuristic processing and dietary choices. Obesity Reviews, 13(9), 766-779. doi:10.1111/j.1467-789X.2012.01001.x
Creed, F., and Barsky, A. (2004). A systematic review of the epidemiology of somatisation disorder and hypochondriasis. Journal of Psychosomatic Research, 56(4), 391-408.
Davis, W. (2011). Wheat Belly. Lose the Wheat, Lose the Weight, and Find Your Path Back to Health. Toronto, Canada: Harper Collins Publishers Ltd.
Golley, S., Corsini, N., Topping, D., Morell, M., & Mohr, P. (2015). Motivations for avoiding wheat consumption in Australia: Results from a population survey. Public Health Nutrition, 18(3), 490-499. doi:10.1017/S1368980014000652
Kabbani, T. A., Goldberg, A., Kelly, C. P., Pallav, K., Tariq, S., Peer, A., Leffler, D. A. (2012). Body mass index and the risk of obesity in coeliac disease treated with the gluten-free diet. Alimentary Pharmacology & Therapeutics, 35(6), 723-729. doi:10.1111/j.1365-2036.2012.05001.x
Leikas, S., Lindeman, M., Roininen, K., & Lähteenmäki, L. (2007). Food risk perceptions, gender, and individual differences in avoidance and approach motivation, intuitive and analytic thinking styles, and anxiety. Appetite, 48(2), 232-240.
Metchikoff, E. D. (2014). Examining knowledge of the gluten-free diet among non-celiacs following the diet. California State University, Long Beach.
Miller, D. (2016). Maybe it’s not the gluten. JAMA Internal Medicine. doi:10.1001/jamainternmed.2016.5271
Peters, S. L., Muir, J. G., and Gibson, P. R. (2014). Gluten sensitivity without coeliac disease–a new twist. Agro Food Industry Hi-Tech, 25(2), 38-42.
Rousseau, S. (2015). The celebrity quick-fix: When good food meets bad science. Food, Culture and Society: An International Journal of Multidisciplinary Research, 18(2), 265-287. doi:10.2752/175174415x14180391604404
Schulte-Mecklenbeck, M., Sohn, M., de Bellis, E., Martin, N., and Hertwig, R. (2013). A lack of appetite for information and computation. Simple heuristics in food choice. Appetite, 71, 242-251.
Shepherd, S. J., and Gibson, P. R. (2013). Nutritional inadequacies of the gluten-free diet in both recently-diagnosed and long-term patients with coeliac disease. Journal of Human Nutrition and Dietetics, 26(4), 349-358. doi:10.1111/jhn.12018
Acknowledgements
This PhD project has been funded by the Australian Research Council, as part of their ITTC Scholarship program, in collaboration with the GRDC and the Functional Grains Centre, Charles Sturt University, Wagga Wagga. Support was also received through an Australian Government Research Training Program Scholarship.
Contact details
Kyah Hester
Charles Sturt University, Wagga Wagga
khester@csu.edu.au
@FGC_Kyah
Was this page helpful?
YOUR FEEDBACK