Disease risk prediction for Phytophthora root rot of chickpeas
Author: Sean Bithell (1), Kristy Hobson (1), Steve Harden (1), Willy Martin (2), Alan McKay (3) and Kevin Moore (1) | Date: 28 Feb 2017
1NSW DPI, Tamworth, NSW, 2DAFQ Warwick, 3SARDI, Adelaide, SA
Take home message
- Phytophthora medicaginis (Pm) inoculum concentrations decline to low levels (within 6-12 months) of a diseased crop and the distribution becomes more uneven
- Resting populations (oospores) can be below detectable levels based on both soil DNA and isolate baiting methods
- These factors limit the ability of PreDicta B® to identify paddocks which have a significant disease risk
- The Pm test is useful for disease diagnosis when the pathogen is active and inoculum decline has not taken place
Note: the SARDI PreDicta B test for Phytophthora medicaginis is under development and is not yet available commercially.
Phytophthora medicaginis detection in soil
Phytophthora medicaginis, the cause of chickpea Phytophthora root rot (PRR) is endemic and widespread in the northern grains region. Under conducive conditions, PRR can cause 100% loss. The pathogen survives from season to season on chickpea volunteers, lucerne, native medics, sulla and as resting structures (oospores) in roots and soil. It is known that Pm inoculum concentrations is difficult to detect and quantify in paddocks when a susceptible host such as chickpeas is not present (Dale and Irwin, 1990).
A PreDicta B soil DNA test has been developed by the South Australian Research and Development Institute (SARDI) to quantify the amount of Pm DNA in soil samples and so provide a measure of the amount of Pm inoculum (infected root tissue and oospores) in paddocks. We report on three seasons of studies to assess the capability of this test to:
- Detect Pm in soil from commercial paddocks
- Predict the risk of PRR disease and potential yield losses in chickpea
Methods
Ability to detect Pm in paddock samples: Soil samples were collected during winter-spring period from fields in northern NSW and southern QLD in 2013, and from central (16) and south-western Queensland (10), and Victoria (7) in 2014. All paddocks included chickpeas in the rotation but not all had chickpeas in the previous year.
Eight sites were sampled per paddock using with 10 soil cores (15 long 1 cm wide cm AccuCore soil corer). At each site 10 cores were collected every 20 – 25 paces along a ‘W’ collection pattern (total distance 200 – 250 m per sample site). If soil conditions were too dry, a 15 cm long by 6 cm wide trowel tapering to 2 cm was used to sample. Soil samples were stored in sealed plastic bags at 5°C.
After sieving (4 mm aperture), a 400 g sub sample was sent to SARDI for DNA analysis the remainder of each sample was used for baiting of the pathogen using a glasshouse based technique. Seedlings (cv. Sonali) were assessed for disease (chlorosis, stem cankers, death) three times a week. Stem tissues were plated to isolate Pm. Cultures with Phytophthora like growth on cornmeal agar were plated on low strength V8 agar and colony morphology, oospore production and oospore size used to identify Pm like cultures. Isolation of Pm was attempted from all treatments that produced chlorosis followed by the appearance of Pm like stem cankers or seedlings with poor growth. After six weeks the experiment was terminated. To fulfil Koch’s postulates on putative Pm isolates, seedlings of the susceptible chickpea cv. Sonali were inoculated in controlled environment experiments.
Detection capability across a range of concentrations: A Pm concentration:DNA yield series was prepared using a Pm isolate (943c-1) grown on plates of low strength V8 agar then prepared as a oospore-mycelium solution with distilled water at 1752 oospores/mL (average of five separate sample counts). The required volume of solution containing 0, 100, 500, 1000, 2000, 4000, and 8000 oospores was then pipetted into 400 g of dry sand and distilled water added to bring the total volume of each solution to 5 mL, with three replicates prepared. The samples were sent to SARDI for Pm DNA analysis.
Disease and yield loss prediction trials: In 2014, 2015 and 2016 disease and yield loss prediction trials were carried out. A range of Pm levels were established by applying, different rates of oospores (a mixture of 10 isolates) in-furrow at seedling to four row plots. At sowing or early in the season soil cores (150 mm depth cores, in row coring) were collected from the two middle rows of each plot and pooled and analysed for soil Pm concentration by SARDI. During the each season PRR disease assessments (% infected plants, or row length of severely infected plants) and grain yields were measured from the two middle rows of each plot. The trials were also soil sampled at the end of season as described previously. The 2015 and 2016 trials had four row buffer plots around each plot to limit spread between plots. Irrigation treatments were watered with dripper tape delivering between 0.6 to 0.7 mm/hr.
Ability to monitor Pm concentrations in paddocks: To develop sampling recommendations, Pm concentrations were assessed on three farms (Coonamble NSW, Moree NSW, Goondiwindi QLD) where PRR had been an ongoing problem, “Hotspots” were marked and GPS recorded.
Four samples were collected from each hotspot area following a W collection pattern (32 points along the pattern, each point 6 m apart, using a 150 mm AccuCorer). At each point cores were sampled from a single stubble row, with each core for each separate sample taken 2-3 cm apart. Low lying areas of paddocks where pooling following rainfall occurred (below contour banks, low areas of paddocks, dips) were also sampled and raised or uniform areas were also collected, these areas provided three 32 core ‘low area’ samples and three 32 core ‘high area’ samples from each field, their GPS positions were also marked. Using this method 12 paddocks were sampled in April 2016, another four paddocks were also sampled with either hotspot or low-high samples collected. In Nov and Dec 2016 all hotspot sites were resampled, all low-high sample sites were revisited and samples collected from paddocks in chickpeas in 2016 showing any disease problems.
For the April samples three soil samples from each hotspot and all low-high samples were sent for analysis to SARDI. The fourth hotspot sample was assessed for Pm in a glasshouse baiting experiment (5 reps, cv. Sonali grown in a soil:sand mix) as described previously. At the end of the baiting experiment the soil-sand media in each cup was sent to SARDI for analysis.
Hotspot sites in Coonamble and Goondiwindi were resampled in Nov to compare with April results and for paddocks in chickpeas, the low and high areas were also inspected and soil samples collected if any disease symptoms were observed.
Results and discussion
Ability to detect Pm in paddock samples: The 2013 and 2014 collected soils showed a similar pattern with most samples (which had positive DNA results also yielding Pm cultures 2014: 9/11, 82%; 2015: 8/9, 89%) and with most samples which had negative DNA results not yielding Pm cultures (2014: 36/37, 97%; 2015: 33/34, 97%). There were two false negatives, whereby the DNA method did not detect Pm, but the soil sample yielded Pm isolates. If within sample variability is high, the lack of DNA detection may be due to low concentrations in the sub-sample submitted for DNA analysis. Both sets of samples also had some cases of false positives, possible explanations for this is that more time may be required for symptoms to develop during baiting, or that the pathogen had died but some DNA had been detected.
Detection capability across a range of concentrations: The experiment showed increasing DNA yields from an increasing pathogen concentration, although the spread among replicates was quite large for the three highest concentrations (Figure 1). It was also notable that for the lowest concentration 0.25 oospores/g (100 oospore solution in 400 g sand) that yields were variable, values for the three replicates were 0, 261 and 858 copies/g sand. It is possible that the small amounts of DNA present in low concentration samples, such as these, may have degraded during transportation to SARDI for analyses and lead to the nil detection in one replicate. Further work is required in this area but this single set of results suggests that the detection of Pm DNA at low concentrations (≤ 0.25 oospores/g sample) may be variable and could deliver nil detection values.
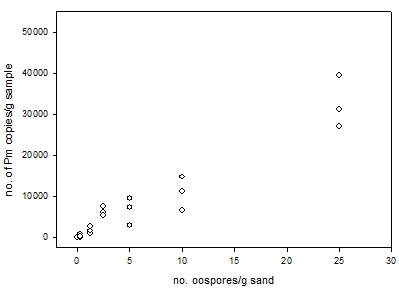
Figure 1. Plot of three replicate sample of Pm oospore-mycelium in sand at a range of concentrations against the yield of Pm copies/g of sample.
Disease and yield loss prediction trials: ability to predict average disease and average yield loss: The relationships between Pm DNA values and disease or yield correlations for the three trials are summarised in Table 1. For 2014 with cv. Sonali there were relatively weak correlations between the early season soil Pm DNA concentrations and PRR disease (r = 0.46) and chickpea yields (r = - 0.37), but for the 2015 with var. Yorker trial Pm DNA values provided a common central relationship across data from both irrigation treatments for both disease and yield. The 2016 trial with cv. Yorker provided a poor relationship between Pm DNA values and both disease and yield. The high r values for PRR disease measurements and yield in each trial supported the assumption that the yield losses were principally due to PRR disease.
Table 1. Correlations r values for early season or sowing Pm DNA values, PRR disease and yield of three experiments (DNA14 (2014), HMDNA15 (2015) and HMDNA16 (2016).
|
Trial date |
Post sowing or early season Pm DNA values |
PRR disease |
|
|
|
PRR disease |
Yield |
Yield |
|
2014 |
0.46 |
-0.37 |
-0.86 |
|
2015 |
0.82 |
-0.77 |
-0.83 |
|
2016 |
0.17 |
-0.22 |
-0.70 |
Ability to consistently detect Pm DNA in yield loss trials on a plot by plot basis: In each of the three seasons there were a number of plots where no Pm DNA was detected by the qPCR method either at sowing or early in the season or at the post-harvest sample (Table 2). The nil DNA plots included both inoculated and non-inoculated treatments each season. Of the nil Pm DNA early season or at sowing samples, across each of the three trials a proportion (2014 0.79, 2015 0.43 and 2016 0.94) of these then had PRR symptoms, in the majority of cases yield losses were high in these plots (data not presented). The 2016 trial results were unusual with the very large number of nil DNA plots, Pm control samples included for analyses with these samples gave expected DNA values. It is not known why so many 2016 samples gave negative Pm DNA results yet PRR symptoms occurred in the plots. The 2015 trial was the most successful with only 3 of 7 nil DNA plots having PRR symptoms. However, for the postharvest DNA results from 2015 trial 7 plots with PRR had nil DNA values.
Table 2. No of plots in each of three experiments (DNA14 32 plots (2014), HMDNA15 40 plots (2015) and HMDNA16 40 plots (2016)) that had nil Pm DNA results early in the season or at the post-harvest sample and the number of these plots that had PRR symptoms or not.
|
Time |
post sowing or early season Pm DNA values |
post harvest Pm DNA values |
||||
|
Trial date |
Total nil DNA values |
nil DNA values & nil PRR symptoms |
nil DNA values & PRR symptoms |
Total nil DNA values |
nil DNA values & nil PRR symptoms |
nil DNA values & PRR symptoms |
|
2014 |
14 |
3 |
11 |
2 |
2 |
0 |
|
2015 |
7 |
4 |
3 |
11 |
4 |
7 |
|
2016 |
33 |
2 |
31 |
- |
- |
- |
Time of sampling effects on Pm DNA concentrations: The post harvest Pm DNA concentrations did not differ between treatments in 2014 and 2015 trials (not presented), 2016 post harvest results were not available. For DNA14 which include a mid-season sample, for analysis of oospore treatment (P = 0.150), time and oospore trt.*time interaction (P = 0.116), only time was a significant factor (Table 3). The concentrations of DNA at 15 Sep were very high compared to both the early August and Dec post harvest samples. Between 12 and 23 Sep there were large increases in the number of infected plants (not presented). These results show that when the disease is active, very high soil concentrations of the pathogen are present, but relative to this active period the populations decline rapidly over a three month period.
Table 3. Time effects for Pm DNA concentrations (no. Pm sequences/g soil) for three sample dates in the 2014 Pm inoculum level trial (DNA14) (Time, P < 0.001; lsd 118,466.4)
|
Time |
4 Aug |
15 Sep |
19 Dec. |
|
Pm DNA |
1,561 |
476,183 |
8,014 |
April 2016 paddock inoculum results, detection variability: Six of the 13 paddocks with hotspot soil samples had positive Pm DNA results, all but one of these paddocks were in chickpeas in the 2015 season (Table 4). Of the six paddocks with positive DNA results only two paddocks had all three samples test positive, for another two paddocks (10 and 11) only two samples tested positive and for the other two paddocks (3 and 13) only one of the samples tested positive.
Table 4. April 2016 hotspot sample location, paddock code, prior crop (wh, wheat, cp, chickpea), average hotspot sample Pm DNA, number of positive hotspot samples, April 2016 hotspot sample isolate baiting results (no. cankers, no. of putative Pm cultures) and post-experiment DNA results of baiting media
|
location |
code |
2015 crop |
Av. Hotspot P. med DNA sequences/ g soil |
Hotspot no. + samples |
Av. No. Cankers/ cup |
total no. putative cultures |
Av. P. med DNA sequences/g media |
|
Coonamble |
1 |
wh |
0 |
0/3 |
0 |
0 |
0 |
|
Coonamble |
2 |
wh |
0 |
0/3 |
0 |
0 |
0 |
|
Coonamble |
3 |
cp |
209 |
1/3 |
0 |
0 |
205 |
|
Coonamble |
4 |
cp |
0 |
0/3 |
0 |
0 |
0 |
|
Coonamble |
5 |
cp |
0 |
0/3 |
0 |
0 |
0 |
|
Coonamble |
6 |
cp |
0 |
0/3 |
0 |
0 |
0 |
|
Coonamble |
7 |
cp |
0 |
0/3 |
0 |
0 |
544 |
|
Coonamble |
8 |
cp |
0 |
0/3 |
0 |
0 |
0 |
|
Goondiwindi |
9 |
cp |
1389 |
3/3 |
3 |
6 |
334767 |
|
Goondiwindi |
10 |
cp |
1205 |
2/3 |
2.8 |
9 |
348014 |
|
Goondiwindi |
11 |
cp |
690 |
2/3 |
0.75 |
2 |
618706 |
|
Goondiwindi |
12 |
cp |
2881 |
3/3 |
3 |
7 |
186981 |
|
Moree |
13 |
wh |
339 |
1/3 |
0 |
0 |
0 |
Given the close proximity (2-3 cm apart) of the cores sampled at each of the 32 points in a hotspot area it was notable the extent of variability in positive DNA results among the three samples. The results for paddocks 10 and 11, and in particular, for paddocks 3 and 13 indicate an uneven distribution of inoculum giving differing results even for closely collected soil samples. The baiting experiment yielded characteristic PRR symptoms and putative Pm cultures for soil samples from the four paddocks with two or three positive samples (Table 4). The post-baiting media DNA results showed large increases in DNA values relative to average hotspot soil results for these four paddock, however, paddocks 3 and 7 also had positive but low value media DNA results although disease symptoms were not observed during baiting. Conversely, paddock 13 which had one positive hotspot soil sample, had both no disease symptoms or positive post-baiting media DNA result.
The baiting experiment results supported the soil DNA results, including that Pm inoculum was unevenly distributed in these samples. The large increases in baiting media DNA values relative to soil only results, and in particular the positive media DNA results for paddocks 3 and 7 which only had negative soil results, suggest that the baiting process may be useful in raising the DNA values for soil samples which initially have very low inoculum concentrations. Various priming methods have been developed to improve the detection of oomycetes at low concentrations or where the pathogen may be dormant (Wakeham and Pettitt, 2016). However, later season survey results (see Table 6) for paddocks 1, 2, 4 and 6 which had nil disease when baited and nil Pm DNA in the baiting media had PRR symptoms and positive DNA results in Nov of 2016, showed that such a priming method does not show promise for PRR prediction.
April 2016 paddock inoculum results, sample site effects: PRR is often first seen to occur in low lying areas of paddocks where pooling of water occurs after heavy rainfall. However 2016 results showed that using local knowledge to target sampling to areas to where PRR had been observed gave a slightly better success (4/11 cases) than just targeting low areas of paddocks (3/11 cases) (Table 5). It was notable that in two of the four positive hotspot locations were not in low lying areas of paddocks, rather their location was possibly related to prior the historic presence of alternative hosts in the area of the hotspot. However if prior knowledge of a paddock is not available then it was clear that targeting low lying areas for sampling is an appropriate strategy to maximise the chances of detection. For example, another three paddocks (coded 14, 15 and 16) in wheat in 2015 were low and high area sampled in Goondiwindi in 2016 for which there was no hotspot information, for the single paddock (no. 15) with positive Pm DNA results all three low area samples were positive and no high area samples had positive results.
April vs. Nov. 2016 inoculum results, unexpected increases: Results for four Coonamble paddocks (rainfall June to Oct 2015 of 112 mm, June to Oct 2016 of 388 mm) are presented which included: increases from nil inoculum in a break crop to substantial inoculum in chickpeas including areas with PRR like symptoms (paddocks 1 & 2); increases from nil inoculum in a prior chickpea crop to substantial inoculum in chickpeas including areas with PRR like symptoms in one paddock (paddocks 3 & 5) (Table 6).
All of the Goondiwindi paddocks (rainfall June to Oct 2015 209mm, June to Oct 2016 321mm) with hotspots were in wheat the winter of 2016, but two paddocks (coded 14 and 16) with no hotspots but had low and high area sampled were sown in chickpeas. All April samples for both paddocks had nil Pm DNA values, but in Nov the low sites were positive, for paddock 14 (average Pm DNA 694 copies/g soil) and 16 (average Pm DNA 6174 copies/g soil), and for 16 the high site average value was 8587 copies/g soil. That high sites provided positive values suggests that the inoculum was resident at the samples sites, rather than due to inoculum arriving after April via the flow of storm water containing inoculum. This paddock 16 planted to a PRR susceptible kabuli variety had large areas of PRR in 2016, despite the April presowing nil Pm DNA results from four low and four high sites.
Table 5. April 2016 sample location effects, average Pm DNA (sequences/ g soil) results, number of positive samples, for samples from a single hotspot area, low areas and high areas of paddocks
|
Paddock code |
Av. hotspot P. med DNA |
Av. low P. med DNA |
Av. high P. med DNA |
|
1 |
0 |
0 |
0 |
|
2 |
0 |
0 |
0 |
|
3 |
20911* |
4181 |
0 |
|
4 |
0 |
0 |
0 |
|
5 |
0 |
0 |
0 |
|
6 |
0 |
0 |
0 |
|
7 |
0 |
0 |
0 |
|
8 |
0 |
0 |
0 |
|
9 |
13893 |
16982 |
2851 |
|
11 |
6902 |
0 |
0 |
|
12 |
28813 |
23553 |
0 |
* no. of positivesamples, out of three
Table 6. April and November 2016 comparison for four Coonamble paddocks (see paddock codes) April no. of positive Pm DNA samples, Nov average Pm DNA values, Nov no. of positive Pm DNA samples and number collected (in superscript) for soil samples from a single hotspot area, low areas and high areas of paddocks
|
April |
April |
April |
||
|
code |
2015 crop |
Hot no. + |
Low no. + |
High no. + |
|
1 |
wh |
0/3 |
0/3 |
0/3 |
|
2 |
wh |
0/3 |
0/3 |
0/3 |
|
4 |
cp |
0/3 |
0/3 |
0/3 |
|
6 |
cp |
0/3 |
0/3 |
0/3 |
|
Nov. |
Nov. |
Nov. |
||
|
code |
2016 crop |
Hot av. |
Low Av. |
High Av. |
|
1 |
cp |
0* |
13,1103/3 |
4,1071/1 |
|
2 |
cp |
1,2421/3 |
6,4472/2 |
2,9361/1 |
|
4 |
cp |
0 |
6,6623/3 |
13,2482/2 |
|
6 |
cp |
3,4172/3 |
- # |
- # |
*only dead seedlings present in hotspot area, possible death from waterlogging, two samples taken from an adjoining area were both Pm positive (av. 19,054 sequences/g soil)
#no disease symptoms observed, no soil samples collected
These results although from a small number of paddocks in a single season (albeit a high rainfall season) were unexpected, as they indicate that results taken prior to the sowing of a crop may not be indicative of future disease and associated inoculum concentrations.
Implications for growers
This work has not been able to develop disease risk categories for Phytophthora root rot of chickpeas using pre-sowing soil inoculum concentrations. There are three main reasons, Pm declines to low levels during break crops within 6-12 months, resting spore concentrations are very low and distribution across paddocks is uneven.
In wet seasons low concentrations of Pm can multiply rapidly to cause PRR. Pm can also spread to neighbouring crops in run-off water.
However the Pm DNA test may be useful as a diagnostic tool for growers and agronomists to confirm PRR diagnosis. For example, in the 2016 some chickpea paddocks in NW NSW were saturated causing some areas of the paddocks die. Pm DNA analysis of soil samples from some of these areas has allowed agronomists and growers to identify if waterlogging or PRR were the cause of the losses.
Where suspected PRR occurs in chickpea crops, confirmation through isolation of the pathogen from diseased tissue can be unsuccessful if the symptoms are advanced or the plants have died. Analysis of soil samples for Pm DNA provided confirmation of a suspected case of PRR in QLD in 2015. The key point to the use of this diagnostic tool will be the need for in-crop soil samples when the pathogen is active and inoculum concentrations are high.
In addition, the Pm DNA test is a valuable research tool as has been used to compare the resistance of breeding lines and varieties to Pm.
For detailed information on control of PRR in chickpea visit the management page on the Pulse Australia website
Acknowledgements
This research was co-funded by NSW DPI and GRDC under projects DAS00137, the ‘ability to detect Pm in paddock samples’ work was partly funded by DAN00172. We thank growers for the significant contributions through both trial cooperation, paddocks access and the support of the GRDC. Assistance provided by Gail Chiplin, Paul Nash, Amy Alston, Amy Trebilco, Belinda Rowe (NSW DPI) Peter Keys, Kris King, Taylor Mentha (DAFQ), Frank Henry (Vic. DEPI) is greatly appreciated.
References
Dale, M. L. and J. A. G. Irwin (1990). Australian Journal of Experimental Agriculture 30(1): 109-114.
Wakeham, A. J. and T. R. Pettitt (2017). Annals of Applied Biology 170(1): 45-67.
Contact details
Sean Bithell
NSW Department Primary Industries
Ph: 0429 201 863
Fx: 02 6763 1100
Email: sean.bithell@dpi.nsw.gov.au
Kevin Moore
NSW Department Primary Industries
Ph: 0488 251 866
Fx: 02 6763 1100
Email: kevin.moore@dpi.nsw.gov.au
Varieties displaying this symbol beside them are protected under the Plant Breeders Rights Act 1994.
® Registered trademark
Was this page helpful?
YOUR FEEDBACK