High nitrogen fertiliser strategies on canola
Author: Ben O’Brien & Maurie Street, Grain Orana Alliance | Date: 28 Feb 2017
Take home messages
- Optimising canola performance will often require additional nitrogen (N) fertiliser
- Optimal rates of N are often proving to be much higher than traditionally thought
- There is little to no evidence of ‘haying off’ in canola due to excessive N
- High N application rates in canola are not only increasing yields in the year of application but also in subsequent wheat crops
- Growers employing more aggressive (high rate) N strategies in canola to attempt to capture higher yield opportunities in good springs can be confident that any unrealised potential of applied N will likely benefit the subsequent wheat crop.
Introduction
Since 2010, GOA has been conducting trials investigating yield and oil responses in canola to increased nitrogen (N) rates and application timing. The majority of trials have demonstrated strong positive yield responses to increasing N rates, although, often negative responses in oil percentage to the same. In a few trials, yield tended to plateau at higher N rates rather than increasing, however, in no case has there been any evidence of ‘haying off’, where yield has declined or the crop failed through excessive rates of N.
In many trials, yield increases have often continued well beyond N rates previously considered reasonable. For example, in a GOA trial at Geurie in 2014, a yield gain of 1.34 t/ha was achieved in response to the application of 200 kg/ha of N.
Evidence from these trials would suggest growers not applying any, or using more traditionally accepted N rates, e.g. 50 to 100 kg/ha of area, are likely to be missing out on significant yield potential.
There are likely many reasons for growers not to employ strategies of higher rates of N in their canola crops. The risk of not capitalising (and paying for) the extra level of investment in high rates of N would be a common concern. Namely - what if the season turns dry and the crop cannot utilise the higher rates of N applied? GOA has taken an opportunity to research this scenario.
Using existing canola nutrition trial sites, GOA returned in the following year and planted the same sites to wheat. In doing so, GOA was able to assess yield and grain quality impacts of any unutilised nitrogen left from the previous canola trials.
This report details three separate trial sites that demonstrate possible scenarios growers might experience. It will detail the yield performance of both the canola and the wheat crops and the economic impacts of the N strategies employed in the canola crops.
Methods
In GOA’s 2014 canola nutrition trials four factors were assessed-
- Two varieties - one with a low biomass potential (43C80) and the other with a high biomass (44Y84)
- Sulfur (with and without sulfur at 20 kg/ha)
- Nitrogen application timings (sowing, budding, split)
- Five nitrogen rates (0, 50, 100, 150 and 200 kg/ha)
In the year following these canola nutrition trials, EGA Gregory wheat was planted with only starter phosphorus applied as Triple Super. The wheat and trial site did not receive any additional N.
The analysis of the performance of the wheat crop in the second year of the trials are based solely on canola treatments that:
- received the full rate of sulfur
- received any nitrogen at sowing only
- based on either one or both canola varieties depending on if there was a varietal response in the canola trials.
Results
Detailed below are the yields attained at three trial sites, as well as the impact that increasing N rates have had on net profit.
Net profit: is the change in gross income through additional yield and/or changes to grain quality such as oil percentage in canola or protein/screenings in wheat, less the additional cost of the applied N. Figure 2, Figure 6 and Figure 4 detail the change in net profit from increasing N rates compared to applying zero or nil N.
Tables detailing grain yields and quality are listed at the end of this document.
Tullamore: 2014 canola, 2015 wheat
The canola grown in 2014 achieved solid yield responses for the prevailing climatic conditions with the 200 kg N/ha treatment out yielding the 0 N treatment by 0.9 t/ha. Canola oil percentage decreased as the rate of N increased. Wheat yields also responded to the N applied in the previous canola crop, with the 200 kg N/ha treatment out yielding the 0 N treatment by 0.75 t/ha. In this case the biggest yield increases was in the higher N treatment. Wheat protein increased as N rate increased however, the highest rate of N resulted in grain proteins still less than 10%.
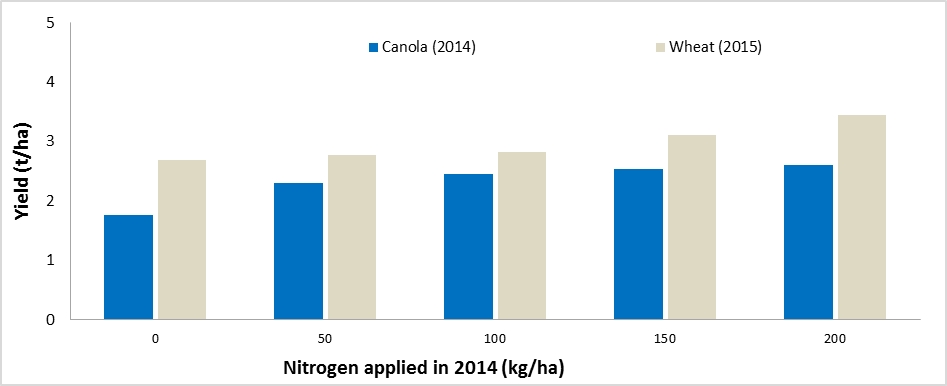
Figure 1. Canola (2014) and wheat (2015) yields in response to varied rates of N applied only in 2014, Tullamore, NSW.
At this site the net change in canola profit was the greatest where 50 kg N/ha was applied. At rates higher than this, the change in profit was less as the increases in yield were not enough to cover the additional fertiliser cost as illustrated in Figure 2. However, for the wheat the net change in profit increased with increasing N rates. The increases in wheat were greater than the decline in the canola, so the combined net profit increased as the 2014 N rate increased. The highest rate of N applied achieved an additional $300/ha net profit over the two years compared to the 0 N.
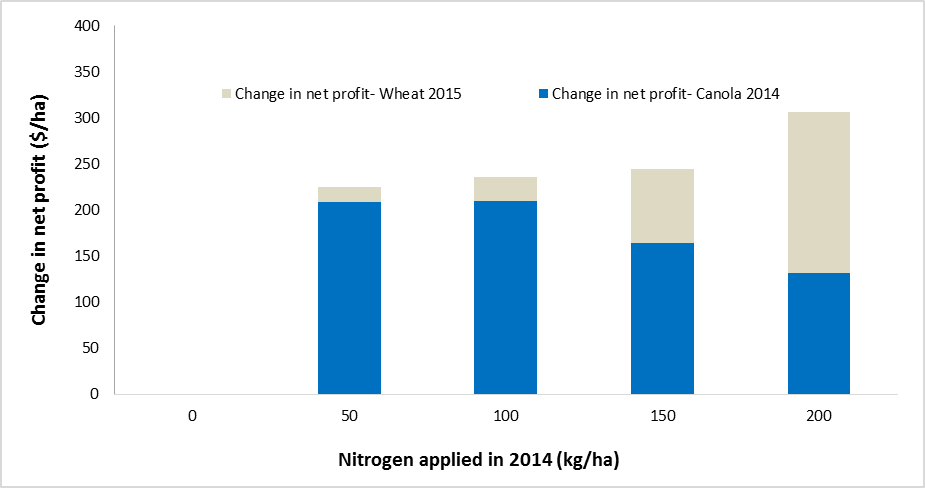
Figure 2. Change in net profit compared to the nil nitrogen treatment for wheat and canola in response to varying N rates applied in 2014, Tullamore, NSW.
Coolah: 2015 canola, 2016 wheat
The canola crop at Coolah in 2015 had a very dry spring finish, which limited yield potential, with the canola yield plateauing in treatments beyond the 150 kg/ha N at 2.2 t/ha, a significant increase over the control treatment of about 1.3 t/ha. Oil content declined with increasing N rates. Wheat yields also increased from 7.8 t/ha up to 9.1 t/ha in response to increasing N rate from nil to 200 kg/ha N. Protein levels also increased with increasing N rates, but with no significant changes in screenings.
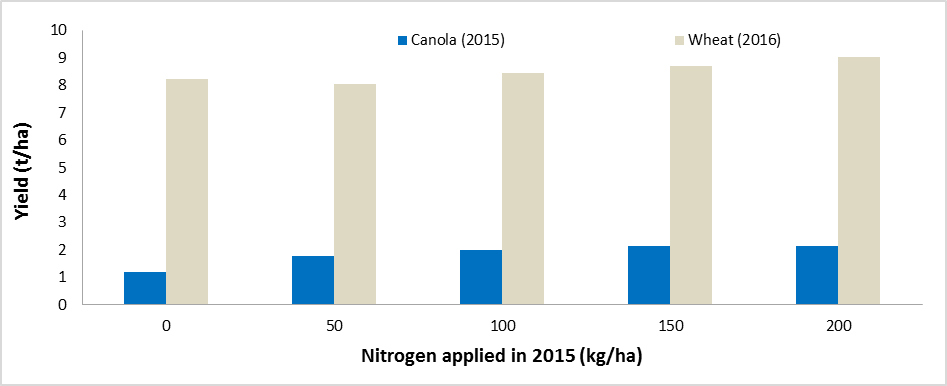
Figure 3. Canola (2015) and wheat (2016) yields in response to varied rates of N applied only in 2015, Coolah, NSW.
Net profit in the canola crop was similar at 50, 100 and 150 kg/ha of N at ~$200/ha increase over the nil N treatment. Increases in yield above the 50 kg/ha N rate were only enough to cover the increasing N costs. Increasing the N rate to 200 kg/ha of N saw net profit decline. Net profit in 2016 wheat increased with increasing N rates of 2015, with sharp rises at 150 & 200 kg/ha of N. The cumulative net profit over the two-year rotation was maximised at 150 kg/ha of N earning an additional $460/ha in net profit compared to the nil N strategy. The increase was partially accounted for by yield increase, but mostly from improved grain quality. The protein levels achieved at the higher rates were enough to move the sample into higher value wheat grades. This coupled with high yields resulted in substantial increase in gross income.
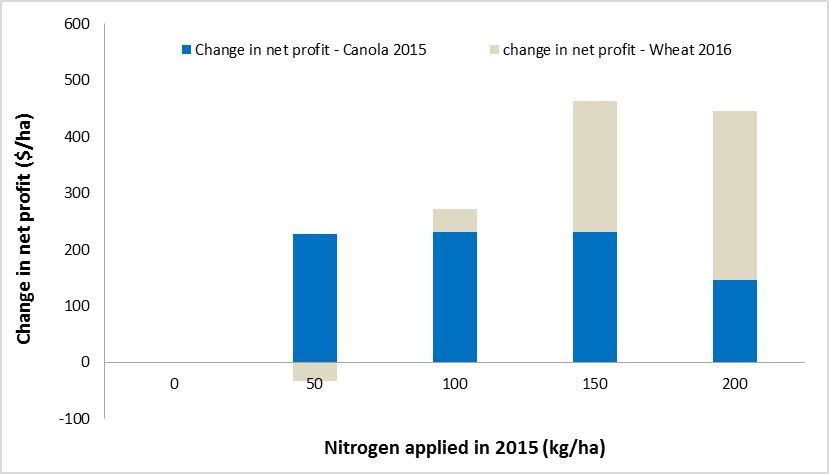
Figure 4. Change in net profit compared to the nil nitrogen treatment for wheat and canola in response to varying N rates in 2015, Coolah, NSW.
Geurie: 2014 canola, 2015 wheat
The trial site at Geurie achieved very high canola yields in 2014, with the 200 kg/ha N treatment yielding 3.5 t/ha, approximately 1.3 t/ha more than the nil treatment. In addition, there was no evidence of yields plateauing let alone ‘haying off’, indicating that there may have been even greater unrealised yield potential (Figure 5). Oil content as a percentage declined, however, overall oil yield increased. In the following year, the wheat in the 200 kg/ha N treatments yielded 5.7 t/ha, which was 1.0 t/ha more than the nil treatment.
Application of 200 kg/ha of N in 2014 only marginally increased wheat protein from 6.7% to 8.4%, not enough to improve the wheat grade. The higher N rates had a much more notable effect on the oil percentage in the 2014 canola crop, reducing it by approximately 3.8% in the 200 kg/ha N treatment.
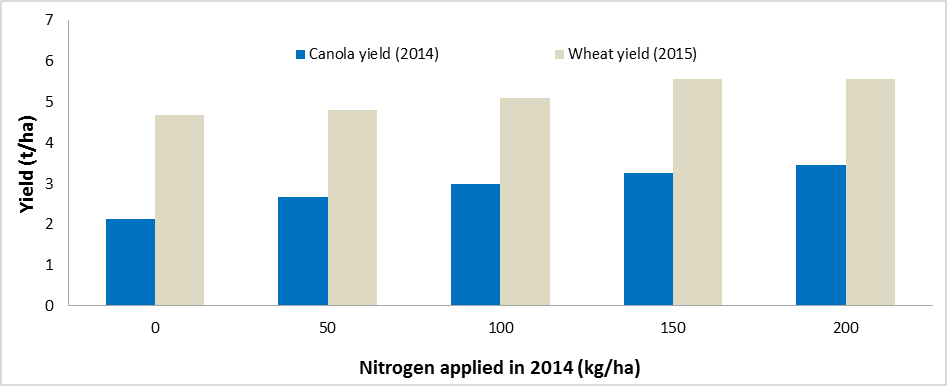
Figure 5. Canola (2014) and wheat (2015) yields in response to varied rates of N applied only in 2014, Geurie
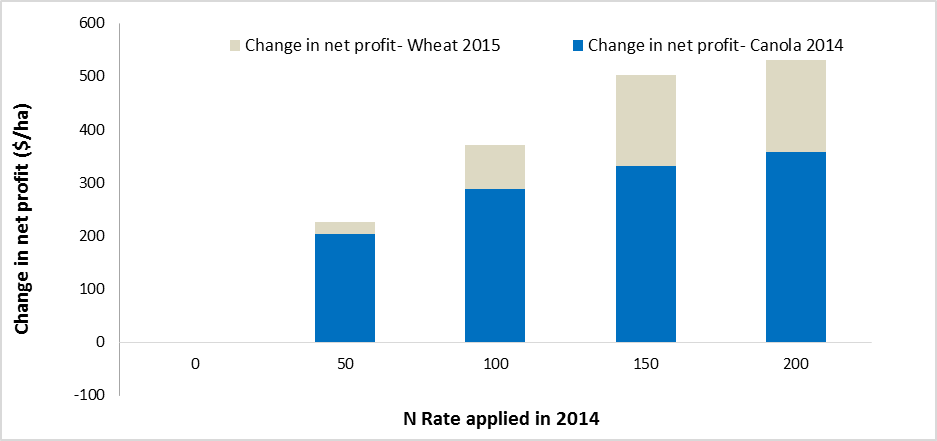
At this site, net profit for both crops increased as the N rate increased, up to the highest rate of N. The highest rate of N resulted in an increase in net profit of $359/ha higher than applying nil N in the canola crop. Wheat in the following year achieved and increase of $173/ha improvement in net profit following the application of 200 kg/ha of N in the previous crop. The combined change in net profit for the two-year rotation was highest at 200 kg/ha of N at $532/ha more than the nil N application.
Discussion
It is suggested that the three trials detailed above represent two possible scenarios that growers may experience in commercial situations.
- Tullamore and Coolah - yield in canola was most likely limited by moisture availability with yields tending to plateau at N rates lower than the maximum.
- Geurie - canola yields in 2014 were likely to have been limited by N levels as yields followed a near linear response to increasing N levels
At both Tullamore and Coolah canola yield gains reduced as N rates increased above 50 kg/ha of N. This would suggest that rates higher than this, were not able to be fully utilised by the canola crop or economically justified in that situation. Yields were likely limited by available moisture.
In both trials, wheat yields in the year following the canola have increased where unutilised N was applied in the canola. Any decreases in profit in the canola crop from applying higher rates of N have been more than adequately compensated in the subsequent wheat crops. In both trials, the highest net increase to gross profit over the two-year rotation was following the higher rates of applied N.
Arguably, the scenario where crop yields are limited more by water than N would be common to many growers. These trials have shown that if crops prove to be over fertilised in such circumstances any unrealised value from applied N is likely to be recovered by improved yields in the subsequent wheat crops.
In contrast, at the Geurie trial, yield response to applied N is positive in both years. This is despite strong yield gains and subsequent N removal in canola grain. The highest N approach in the canola phase of the rotation was economically viable in its own right. However, additional benefit was also received through further yield improvement in the following wheat crop. The most aggressive N rate of 200 kg/ha, equivalent to over 400 kg/ha of urea, resulted in an increase net profit of $532/ha, that is after additional fertiliser costs.
Although, in all three trials the two year net profit improves by moving to higher rates of N in the canola crop this may not be the most N efficient approach. Applying the optimal rate of N in the canola crop and delaying the additional N for application in the following wheat may have resulted in even higher wheat yields and profitability.
The challenge with this approach is identifying the optimal N rate for canola for any given paddock and season. Other work undertaken by GOA has shown soil testing to be useful to identify the general N status of the soil but limited in its value to accurately predict N fertiliser requirements.
Conclusion
Canola yield response to increasing N rates is now well documented. Optimal rates of N has been shown in many cases to be exceeding what has been traditionally considered acceptable or affordable.
However, if growers do not meet the N requirement of canola crops, significant yield and profitability may be foregone. Nonetheless, there are reasonable concerns about applying higher rates of N, the most common being that the benefit of increased fertiliser rates is not realised in the year of application.
These trials should give growers confidence to adopt a more aggressive/higher N strategy in canola to capture higher yield potential in good seasons with some degree of assurance that if the season is yield limiting, any unrealised benefit will most likely be captured in subsequent wheat crop.
Acknowledgements
The research undertaken as part of this project is made possible by the significant contributions of growers through both trial cooperation and the support of the GRDC, the author would like to thank them for their continued support.
Contact details
Ben OBrien
Grain Orana Alliance
Ph: 0409 697 860
Email: Ben.obrien@grainorana.com.au
Maurie Street
Grain Orana Alliance
Ph: 0400 066 201
Email: Maurie.street@grainorana.com.au
Appendix
Table 1. Yield and grain quality in canola (2014) and wheat (2015) in response to various N rates applied at Tullamore in 2014
|
N Rate 2014 |
2014 |
2015 |
||||||||
|
Oil % |
Wheat yield |
Protein % |
Screenings % |
|||||||
|
0 |
1.77 |
B |
48.10 |
A |
2.70 |
B |
7.07 |
C |
2.51 |
B |
|
50 |
2.30 |
A |
47.13 |
AB |
2.78 |
AB |
7.40 |
C |
2.69 |
B |
|
100 |
2.45 |
A |
46.13 |
BC |
2.83 |
AB |
8.23 |
B |
3.38 |
AB |
|
150 |
2.53 |
A |
44.70 |
CD |
3.10 |
AB |
8.23 |
B |
2.21 |
B |
|
200 |
2.61 |
A |
44.17 |
D |
3.45 |
A |
9.57 |
A |
4.07 |
A |
|
L.S.D |
0.43 |
1.66 |
0.7 |
0.76 |
1.2 |
|||||
Values followed by letter in the same letter in adjacent columns indicate that there is no significant difference between the values.
Table 2. Yield and grain quality in canola (2015) and wheat (2016) in response to various N rates applied at Coolah in 2015
|
N rate applied 2014 |
2015 |
2016 |
||||||||
|
Canola yield |
Oil% |
Wheat yield |
Protein % |
Screenings % |
||||||
|
0 |
1.2 |
A |
45.0 |
A |
8.2 |
AB |
9.5 |
A |
2.8 |
AB |
|
50 |
1.8 |
B |
43.6 |
B |
8.1 |
A |
9.6 |
A |
3.2 |
A |
|
100 |
2.0 |
C |
41.2 |
C |
8.4 |
BC |
10.2 |
B |
2.9 |
AB |
|
150 |
2.2 |
C |
39.7 |
D |
8.7 |
C |
10.9 |
C |
2.5 |
B |
|
200 |
2.1 |
C |
39.0 |
D |
9.0 |
D |
11.4 |
D |
2.5 |
B |
|
L.S.D |
0.26 |
1.06 |
0.45 |
0.52 |
0.64 |
|||||
Values followed by letter in the same letter in adjacent columns indicate that there is no significant difference between the values.
Table 3. Yield and grain quality in canola (2014) and wheat (2015) in response to various N rates applied at Geurie in 2014
|
N rate applied 2014 |
2014 |
2015 |
||||||||
|
Canola yield |
Oil% |
Wheat yield |
Protein % |
Screenings % |
||||||
|
0 |
2.12 |
D |
45.4 |
A |
4.688 |
B |
6.9 |
B |
1.945 |
A |
|
50 |
2.66 |
C |
44.5 |
A |
4.803 |
B |
6.65 |
B |
1.648 |
A |
|
100 |
2.99 |
BC |
43.4 |
B |
5.108 |
AB |
6.85 |
B |
1.763 |
A |
|
150 |
3.26 |
AB |
42.1 |
C |
5.558 |
A |
8.05 |
A |
1.875 |
A |
|
200 |
3.46 |
A |
41.6 |
C |
5.567 |
A |
8.1 |
A |
2.215 |
A |
|
L.S.D |
0.43 |
1.0 |
0.5 |
0.56 |
0.62 |
|||||
Values followed by letter in the same letter in adjacent columns indicate that there is no significant difference between the values.
GRDC Project Code: GOA00002,
Was this page helpful?
YOUR FEEDBACK