Impacts of a wet season on crop nutrition
Author: Rob Norton (International Plant Nutrition Institute) | Date: 07 Feb 2017
Take home messages
- Supply of nitrogen (N) from the soil to the crop is a consequence of several competing processes driven largely by temperature, aeration and soil carbon (C) supply. In 2016, across much of the area that ’survived’ flooding, recovery was good and spring mineralisation rates likely contributed to the high efficiencies of N use seen.
- As with applied N, the timing of supply affects the balance of N to yield and N to protein. Late N was a risk/reward strategy, largely balancing lodging risk and haying off against the protein boost.
- The wet 2016 may have leached the more mobile nutrients, such as N, sulphur (S) and maybe potassium (K) deeper into the profile which suggests fertiliser rates applied at sowing may need to be raised for these nutrients to ensure they remain at adequate levels in the developing root zone.
- Soil testing, although far from perfect, is still the best method to assess nutrient supply to guide the right fertiliser rate. Assessing subsoil nutrient supply, particularly of N and S, will be important to get a picture of the potential subsoil nutrient supply in a wet profile and to ensure nutrients are supplied at the right time.
- Getting the RIGHT nutrient source at the RIGHT rate, RIGHT time and RIGHT place is the basis of good nutrient management. Find out more about the 4Rs approach.
- ‘The important thing is not to stop questioning.’ A. Einstein.
What is a good nutrition program?
A good nutrition program is part of a whole agronomy package and cannot — or should not — be considered in isolation from soil type, region, the way paddocks are prepared, the crop type and cultivar, crop protection, equipment available, the yield potential and other agro-climatic issues. A good program will look to at least maintain fertility and this goes closely with soil physical and biological health. A nutrition program will aim to supply what is required to meet the productivity expected and balance risk and return.Over the past decade, we seem to have had it all — sustained below average rainfall with above average temperature, wet summers like in 2011 charging fallows for the 2012 crop, dry springs like 2014 and 2015 giving a tough finish to the season, floods in winter and mild springs in 2016. We are just not sure what is normal anymore. Accounting for this variability is part of the design criteria for a good fertiliser program, though deal with what you know and plan for what you do not know. Nobody really knows what the season or the prices will be, so building flexibility onto a sound start is the first consideration. As the crop gets further into the season, then adjustments to some nutrient supplies (especially N) can made as crop expectations wax or wane.
What did we learn from 2016?
2016 was as different to 2015 as it was to any other year — and spring was a big part of the difference to other years giving a good finish in many areas, although frost was lurking and prices took away some of the gloss. The good yields reported by many growers — often twice ’normal’ did help. And guess what? 2017 will be different again.
There are forces at work for N
We all are familiar with the N cycle (Figure 1), but one of the difficulties about estimating N supply is that there are several competing and sometimes complementary processes, and in a wet year like that in 2016, leaching and denitrification are two transfer processes widely discussed. The discussion should — in my opinion — focus on the ammonium pool rather than the nitrate pool. Even though the ammonium pool is often small relative to the nitrate pool, it is important to consider the ammonium pools because, other than for nitrate fertiliser or atmospheric deposition, virtually all plant available N moves through the ammonium pool into the nitrate pool through nitrification, so this process largely controls the availability of N to plants. Nitrification is a two-step biological chemoautotrophic oxidation process and in most soils is fairly rapid, generally occurring within weeks.
- Ammonium/ammonia is supplied to the nitrification process from the mineralisation of organic materials and from ammonium fertilisers (including urea, mono-ammonium phosphate (MAP), di-ammonium phosphate (DAP)). This is also a microbial process, and the opposite process (immobilisation) refers to the uptake of ammonium or nitrate by plants or microbes.
- Like many biological processes, nitrification is strongly influenced by temperature. When the soil temperature is less than 5oC or more than 35oC, nitrification is very slow, and is at its maximum a little above 25oC. A carbon source is also required. Top soils are more prone to fluctuating temperatures than deeper soil.
- Nitrifying bacteria (and archaea) require oxygen so anything that restricts the presence of oxygen reduces the conversion of ammonium to nitrate where water filled pore-space is more than 60%. In 2016, waterlogging deeper in the profile is likely to have restricted nitrification, and on soils that have been waterlogged for long periods, ammonium levels can be quite high (>10 mg/kg).
- Soil pH<6.5 and >8 also restricts nitrification, and as salinity due to the higher energy cost to bacteria (and plant roots) of maintaining cell turgor.
- Denitrification (loss of nitrate) occurs when the soil is anaerobic, as the microbes strip oxygen from any nitrate present for their own purposes and produce nitrous oxides (bad) and/or dinitrogen (not quite so bad). Like nitrification, the rate of denitrification is affected by temperature, increasing exponentially between 15oC and 30oC with a peak at about 25oC. Understand that deeper soils can be warmer than topsoils — and still denitrifying if waterlogged — even during winter even when there are low ambient temperatures.
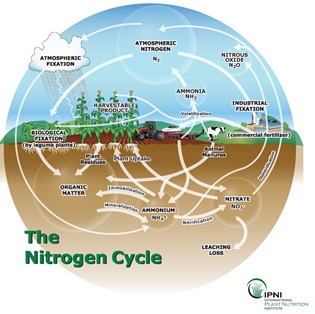
Figure 1. ’Soils 101’ N cycle – but do we really know the complexities and interactions? The rates of fluxes are important in years like 2016.
Should N be spread on waterlogged crops?
Research has shown that the main effect of transient waterlogging is through transient N deficiency (Robertson et al. 2000) and there are differences among and even within species. This was demonstrated in the field by Maaz et al. (2016) on N recovery of wheat on waterlogged soils in Washington State (USA). Crops responded to added N when the free water surface moved down after a period of 6-10 days waterlogging. Aeration of the soil initiated nitrification and the roots revived so that N uptake could continue. Even though yields were reduced under waterlogging, the yield response to added N was similar on both waterlogged and non-waterlogged sites (Table 1).
Table 1. Summary table for Maaz et al. (2016) for differential response of wheat to N where waterlogged and aerated.
| Treatment | Waterlogged | Aerated | |
|---|---|---|---|
| N status (kg/ha) | 0 - 30 / 30 - 120 | 40 / 76 | 47 / 89 |
| Spring biomass | No N | 115 | 230 |
| (g/m2) | + 55kg N | 160 | 310 |
| Grain yield | No N | 490 | 540 |
| (g/m2) | + 55kg N | 590 | 640 |
There are two points to make about this work. Firstly, resupplying N as soon as possible is important — timing to when the soil drains and again becomes aerobic. This may be before the field is trafficable, but the practicalities of delaying a few days mean a ’hurry-up and wait’ strategy may be appropriate. The second point is that there is no reason to spread urea onto standing water as it may be lost if the water runs off the paddock, and it will not have an impact until the soil re-aerates.
In 2016, N efficiency was good
The high yields that came — often along with reasonable proteins — indicate a high efficiency of N use. Matt Nihill (Landmark) gave an example of a 7.25t/ha La Trobe barley crop at 12.5% protein, meaning 160kg N removed in grain, and maybe another 70kg N in the stubble, while 120kg N was applied. Much of the N supply was available in the rooting zone, and was not be stranded in dry topsoil. This example implies a grain nitrogen use efficiency (NUE) of 135%. Magic? — of course not. The extra N came from N unused by prior crops, pre-crop and in-crop mineralisation. The autumn and spring conditions were close to ideal for mineralisation with warm moist soils that could have pumped out 1kg N/ha/d for each 1% of organic C (Angus 2015), so the extended spring alone could have seen an extra 60 to 100kg N provided and at high efficiency as its supply is in synchrony with the developing crop. The crop did lodge and that could have been a contributor to the high protein, as grain size was a little smaller than would be expected in such a good season.
Timing and balancing of yield and protein
The example discussed above emphasises that the right time is just as important as the right rate. In looking to push protein, timing is critical. It is important to appreciate that grain N uptake and grain starch deposition are largely independent (Jenner et al. 1991) so that just adding N does not necessarily affect grain size — and it is the combination of these that results in a grain N concentration. Nitrogen deposition may reach a peak prior to that of starch, and it may decline earlier. A good finish will extend the period of the starch deposition period so N concentration declines as the seed grows i.e. a dilution effect. If there is a larger than normal amount of N available for remobilisation, protein can continue but most often the rate of starch deposition is faster than the rate of protein deposition. So a seed’s protein concentration is a balancing act between the rate and duration of these processes. However, there are still pre-conditions to get protein responses:- The crop really needs more N (leaf symptoms may be evident, a N-rich strip can help diagnosis).
- That N can be supplied to the crop — later applications are less efficient than earlier applications.
- Can enough N be supplied to increase protein — to raise the protein content of 5t/ha wheat crop 1% with a 50% efficiency of N use (high) — is 20kg N.
- Is the current protein estimate near enough to achieve benefit from a 1% protein increase or will it just go from 8.5% to 9.5% without achieving a grade change?
- The N supplied is late enough (GS60+) that the N goes to grain not yield. N uptake and remobilisation finish earlier than carbohydrate deposition.
- With a long and cool finish, carbohydrate synthesis will continue providing larger grain size, so the benefit may end as higher yields rather than higher protein.
Yes – you can put on too much N even in a wet year
There were a few examples of haying off, especially on soils where the water holding capacity was not high, and even though it was a good finish, the crop ran out of water. Poor fertiliser spreading patterns, the enthusiasm of chasing yields and the big burst of spring mineralisation were all implicated in this. Another aspect that is emerging is the improved N supply of wheat on canola, compared to wheat on wheat. O’Sullivan et al. (2016) reported this from field work in WA, and it is something we do see — sometimes ascribed to a disease break. But it is more than that, and those authors proposed that during the canola phase, N nitrification is inhibited and conserved as ammonium, elevating the organic N pools. In the following season, this organic N pool can be remobilised providing an alternative N source for the following crop. So, haying off was more likely on canola stubbles than wheat stubbles — again something observed.
It is more than just N though
2016 did show up some other things, such as manganese (Mn) toxicity, especially with canola. The symptoms are somewhat like sulfur deficiency, but waterlogged and acid soils are indicators, along with a tissue test. The appearance of this, as well as aluminium toxicity are signs that there is a need for liming.
At the other end of the pH scale, we saw Mn deficiency on soils overlying or with high levels of limestone. At the Keith field day, there were symptoms of Mn deficiency in oats (in particular) on a light soil over limestone. This is not surprising as that area reported the first micronutrient deficiency in Australia in the 1920s — which was of Mn in oats — called ’roadside take-all’ — lime blowing off roads and reducing Mn availability.
As well as the nutritional issues, there were things seen in 2016 that are not easily explained. Physiological issues such as leaf yellows, alternating cold and warm conditions meaning awns can become trapped in the boot, leaf bronzing maybe due to frost, tearing of leaves due to wind, veinal chlorosis of leaves maybe due to the good conditions. Not everything is nutritional in origin, so accurate diagnosis including a tissue test is critical to identify the next steps in the plan.
What do we take forward to 2017?
High yields mean high nutrient removal
The first thought about the big yields is that nutrient off-takes are also likely to be big (Table 2), using approximate values. However, care should be taken with these figures as there are large site differences. For example, an IPNI survey of NVT grain nutrient densities showed that wheat grain phosphorus (P) content can vary from 2.5 to 4 kg P/t.
Table 2. Approximate nutrient removals with major grain crops. Nutrient densities are taken from Reuter, D.J., Robinson, B.J. (ed.) (1997): Plant Analysis: An Interpretation Manual. CSIRO.
| N (kg/ha) | P (kg/ha) | K (kg/ha) | S (kg/ha) | |
|---|---|---|---|---|
| Wheat (6t/ha, 12% ptn) | 125 | 18 | 21 | 7 |
| Canola (3t/ha, 23% ptn) | 90 | 15 | 20 | 15 |
| Barley (5t/ha, 10% ptn) | 90 | 15 | 23 | 6 |
You may already know the N concentration from the protein concentration. It is an option to have grain tested for nutrient concentrations but it may be of value having grain analysed for the offtake of other nutrients (P and S especially) and to check on the grain micronutrient concentrations. If stubbles have been cut and removed, then that offtake also should be considered in the nutrient removal estimate.
Big stubbles take up nutrients as well
Of course, stubble also contains nutrients, and there are two aspects to consider. First is specific to N and relates to immobilisation of N, where material with a high C:N ratio is added to the soil. To get to ’humus’, organic materials need to get down to somewhere between 10:1 and 20:1 C:N ratio. Typical wheat stubbles are around 80:1 C:N (44% C, 0.6% N); and canola stubbles can have even higher C:N ratios (that is, less N). The amount of N can vary depending on late N supply to the growing crop and any rainfall leaching N from the standing stubble. For each tonne of stubble, an extra 15kg N/t will be needed to break down the residue. Therefore, for a 6t/ha wheat crop, there could be 8t/ha of stubble, so demanding 100kg N/ha for residue breakdown (or maybe twice as much as ’normal’). This immobilised N will be remineralised sometime in the future but can represent a short-term drain on any soil N supply.
Burning heavy stubbles can have logistical benefits with better trafficability, but again, N will be lost. The GRDC Managing Stubbles booklet suggests that 80% of N, along with 40% of both P and K, are lost in a hot burn. With many lodged crops, the stubble is not likely to be tall, so achieving a hot burn might be difficult, and any windrowed stubbles may be difficult if there is a wet summer.
Where is N going in 2017?
It may very well be that the ’cupboard is bare’ for the coming season. But the only way to find out is to take a deep soil test. There may be high ammonium levels, which do require careful interpretation when estimating mineral N supply (Dowling 2016). Using an N-rich strip will help monitor what is happening during the season with the balance of losses and gains in soil N. Even though legumes flourished and fixed large amounts of N in 2016, their high yields, high harvest indicies and N removal may mean that little of the fixed N is left for 2017. There may be a need to reconsider N at seeding, especially if there is little N in the soil profile. Take care with fertiliser placement relative to seed to avoid toxicity.
Get the nutrients in the RIGHT place
Following a wet year, mobile nutrients such as N, S and boron (B) are likely to have moved down the profile. Deep soil tests split for upper and lower will be useful in seeing any bulges. Boron deficiency (looks like Mn toxicity) occurs most frequently on low organic matter, dry, granitic soils, and can be induced by liming, although the latter is a short term effect. Tissue tests are useful in diagnosing low B, but if the soil has deeper B, then the symptoms and test values may just be transient.
Get the basics RIGHT
Lime, gypsum and weed control are the big ticket items between now and sowing. There is some moisture carryover from the summer storms and it is vital to ensure that this is conserved for the crop. Early sowing, good disease control and all the other basics of agronomy set up the crop to make full use of any nutrient inputs. At the start, nutrient inputs should be geared towards supporting average yields from the start and the follow the season. RIGHT application at the start is especially important with P because Post-em and foliar P applications are ineffective (McLaughlin et al.) The basics are more than just rates, so remember that there are 4Rs for nutrient stewardship – the RIGHT source, supplied at the RIGHT rate, at the RIGHT time and put in the RIGHT place. There are no silver bullets.
Useful resources and references
Angus J 2015. Understand the factors that affect mineralisation.
Dowling C, 2016. High ammonium in soil test – artefact or reality.
GRDC 2012. Managing Stubble.
Heard J, et al. 2006. Up in smoke – nutrient loss with straw burning. Better Crops 90(3), 10.
Australia & New Zealand IPNI website
Extension Hub - crop nutrition
Jenner et al. 1991. The physiology of starch and protein deposition in the endosperm of wheat. Australian Journal of Plant Physiology, 18, 211-226.
Maaz, T McC et al. 2016. Managing Chlorosis in Waterlogged, Dryland Winter Wheat. Managing Chlorosis in Waterlogged, Dryland Winter Wheat.
Norton R. 2014. Nutrient removal in hay crops.
O’Sullivan et al. 2016. Changes in N cycling in the rhizosphere of canola lead to decreased N requirements in a following wheat crop.
Robertson D, et al. 2009. Waterlogging affects the growth, development of tillers and yield of wheat through a severe but transient N deficiency. Crop and Pasture Science, 60, 578-586.
Acknowledgements
Thanks to those advisers and growers who have taught me these lessons from 2016 so that I can pass them on. I am also grateful to the experts in the Nutrition Community of Practice supported through the GRDC Extension Hub that gives growers and advisers timely access to the best crop nutrition information.
Contact details
Robert Norton
54 Florence St, Horsham, Victoria 3400.
03 5381 2673
rnorton@ipni.net
@ANZIPNI
Was this page helpful?
YOUR FEEDBACK