Plant tissue testing for micro nutrients and likelihood of responses
Author: Chris Dowling, Back Paddock Company | Date: 27 Feb 2017
Take home message
An investment of a couple of dollars in trace element application can result in hundreds of dollar per hectare in extra grain, so getting trace elements right when they are truly crop limiting can be very profitable.
Factors such as newer farming systems, crop genetics, fertiliser 4 R’s, crop management and soil fertility provide potential for change in crop responsiveness to major nutrients and also trace elements. The challenge is to correctly identify the combination of situations that give a high probability of response to addition of trace elements and develop situation appropriate fertiliser strategies and tactics.
Despite over half a century of trace element research in Australia, a recent GRDC funded More Profit from Crop Nutrition (MPCN) project (DAS00146) lead by Dr Nigel Wilhelm of SARDI has again highlighted the inability of soil tests alone to reliably identify trace element responsive soils.
To ensure trace elements don’t limit production or become an unnecessary cost, a four step process consisting of identifying potential for response, confirming responsiveness, defining extent of responsiveness and developing appropriate 4Rs strategies and tactics is suggested.
Background
Managing the balance of crop nutrients to maximise yields requires a combination of measuring and monitoring both macronutrients and trace elements. Getting the right balance each season can be a challenge, requiring use of a range of monitoring techniques and paddock records to make an informed decision for fertiliser requirements and range of crops grown.
Trace element application is on the increase in many areas and there are questions being asked as to the basis for this increase in usage.
Are factors such as newer farming systems, crop genetics, fertiliser 4 R’s, crop management and soil fertility providing potential for change in crop responsiveness to major nutrients and also trace elements ? The challenge is to correctly identify the combination of situations that give a high probability of response to addition of trace elements and develop situation appropriate fertiliser strategies and tactics.
More than a soil test
Measuring soil concentration of boron, copper, zinc, iron and manganese to predict responsiveness in broadacre crops with current analytical methods as a single index of responsiveness has been shown to be unreliable. Despite over half a century of trace element research in Australia, a recent funded More Profit from Crop Nutrition (MPCN) project (DAS00146) lead by Dr Nigel Wilhelm of SARDI has again highlighted the inability of soil tests alone to reliably identify trace element responsive soils.
Soil tests as a single parameter have little broad ability to predict crop response due to the poor calibration of current soil analysis methods used across the range of Australian soil types. This is compounded where a critical level is not applied to the correct extraction method. Trace element soil test results when combined with other known local risk factors are useful to coarsely define areas of higher chance of a trace element response, but the decision whether to apply trace elements should also include at least one other confirmation measure.
Some of the other risk co-factors for consideration include
- Soil pH/ soil amendment
- Fallow length/previous crop/ VAM status
- Crop species/ varieties
- Crop N status
- Early season weather conditions
- Soil P status and P rate
- Other potential trace element interactions
- Soil calcium carbonate %
- Organic carbon %
- Management factors that negatively affect root density ( root pruning) such as soil-active herbicides
- Management factors that affect soil bulk density
Plant symptoms
Visual symptoms are useful in identifying if a trace element deficiency is present, although plant symptoms may be similar to other disorders such as plant disease or other nutrient deficiencies. Seeking second opinion is often a good strategy before taking action.
Waiting until a crop shows signs of a trace element deficiency can be a costly strategy as previous crops may have already suffered yield penalties greater than 10 % for a number of seasons (hidden hunger syndrome) before identifiable deficiency symptoms occur and it can be difficult to turn the crop around from a severe deficiency.
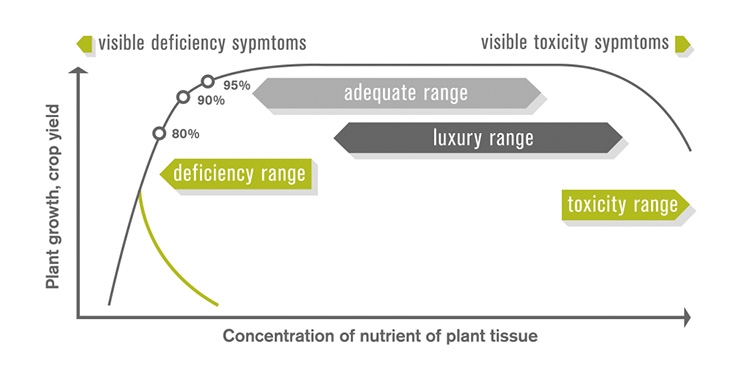
Figure 1. Relationship between nutrient concentration in plant tissue and yield or growth (Adapted from Marschner, 1995) (Image from Mosaic, http://www.cropnutrition.com/efu-plant-analysis)
Visual symptoms are more useful for management of deficiency or toxicity of trace element for the following crop in the rotation unless identified and treated early in the current crop. Confirmation of visual symptoms with plant tests is a more reliable approach, ensuring a satisfactory outcome from a remedial in-crop nutrient application.
Tissue analysis
Plant tissue analysis is currently the most valid laboratory based method for measuring the potential responsiveness to trace elements in many crops. Plant tissue analysis is calibrated across a range of crops, but wheat is probably the best crop to test due to the large amount of calibration data available. Wheat plant biochemistry is similar across the globe so we are able to use calibration data from other countries with a reasonable degree of confidence. This is particularly important for newly emerging nutrient issue for which there is little or no Australian calibration data.
For suspected trace element issues the best sampling protocol to achieve accuracy and consistency of the sampling, and for interpretation, is to collect the youngest expanded blade from the primary tiller prior to the end of tillering across a representative area (at least 200 g of wet material) of the paddock. Even better, where there are areas of good and poor growth, separate samples are taken from both areas.
As micronutrients are mostly immobile in the plant, sampling the youngest expanded blade gives the best chance of identifying if there is a yield limiting nutrient in a plant part that is reflective of current soil supply. It is the part of the plant where symptoms will first occur.
Plant tissue sampling can be undertaken across a range of crop growth stages, however earlier growth stages is better as it provides opportunity to apply a yield limiting trace element before visual symptoms appear, and minimise crop yield penalties.
Test strips
Applying a test strip is the most reliable monitoring tool for trace element response. It integrates the myriad of soil, seasonal and management variables that contribute to trace element responsiveness.
Test strips can be spatially referenced so growers can continue to go back to the strip over a number of years to identify if there is a visual or crop yield difference between where the trace elements have been applied and the remainder of the paddock, zinc/copper applied at 5 -10 kg/ha in strip will last for 5 – 10 years on most soils.
Running a harvester over the test strip to compare grain yield is also useful to determine if a sub clinical deficiency is impacting crop yield, as it is difficult to detect up to a 20% yield difference by eye.
An integrated approach
A combination of all four detection methods in the right situation can be useful to identify if trace elements are required to maximise crop yields. A confirmation and management process most likely to produce enduring benefits would include
Step 1. Identify potential for trace element limitation – low soil test, marginal or low plant tissue, confirmed visual symptom, test strip in highest risk area/ situation
Step 2. Confirm potential plant responsiveness – plant tissue tests (including grain), test strip in areas with high risk (low soil test, symptoms) particularly in the most sensitive crop species grown. Test strip may be foliar application yearly or soil applied at a rate that will provide significant residual.
Step 3. Define extent of the problem – identify crop, soils, rotations (e.g. durum wheat following canola on high pH soil is high risk for Zn deficiency), management operations (soil residual herbicides) that increase high risk.
Step 4. Develop appropriate nutrient management strategies and seasonal tactics for crop species, seasonal types and soils with high risk or confirmed responsiveness.
An investment of a couple of dollars in trace element application can result in hundreds of dollar per hectare in extra grain, so getting trace elements right when they are truly crop limiting can be very profitable. On the other hand, if the situation is not deficient, those couple of dollars will return no benefits.
Acknowledgement
The information presented is made possible through the support of the GRDC, the author would like to thank them for their continued support.
Reference
Marschner, H 1995. Mineral Nutrition of Higher Plants, Second Edition, Academic Press, London.
Contact details
Chris DowlingBack Paddock Company
PO Box 823
Cleveland, Q, 4163
Ph: 0407 692 251
Email: cdowling@backpaddock.com.au
Was this page helpful?
YOUR FEEDBACK