The key drivers of high end irrigated canola yields
Take home messages
- Correct varietal selection and optimal agronomic management can result in irrigated canola yields of over 4t/ha. Pioneer®45Y88 (CL) was the highest yielding variety in 2016 with a yield of 4.30t/ha when averaged across three experiments at Leeton Field Station (LFS). Nuseed Diamond, Pioneer®45Y25 (RR) and AV-Garnet also yielded well in the same experiments.
- The triazine tolerant (TT) varieties of ATR-Bonito, ATR-Gem and Hyola®559TT were consistently the lowest yielding varieties across the three experiments.
- Increasing the nitrogen (N) application rate above 150kg N/ha increased grain yield, decreased grain oil content and increased crop lodging.
- The earlier sowing date of 5 April resulted in a higher grain yield and oil content, and decreased crop lodging compared to the later sowing date of 26 April.
- Crop lodging increased as the plant population increased. A plant population between 25 and 55 plants/m2 resulted in higher grain yields than a plant population below 25 plants/m2 or above 55 plants/m2.
Background
There is widespread evidence of the impact varietal selection and agronomic management has on dryland canola grain yield. However, less research has been conducted in irrigated cropping systems in south-eastern Australia, where irrigated canola is becoming increasingly common in crop rotations due to improved varieties and improved financial returns.High-yielding irrigated canola crops are also dependent on correct varietal selection for the region and optimum agronomic management for the chosen variety. There is significant potential to increase irrigated crop yields and the ‘Southern irrigated cereal and canola varieties achieving target yields’ project has demonstrated how this can be achieved over three years of trials.
Trial results from the first two years demonstrated that the optimum combination of variety selection and agronomic management can result in canola grain yields greater than 4t/ha in the Murrumbidgee Valley. Nitrogen management, plant population and sowing date also affected grain yield. Choosing the correct variety with known phenology development to match the target sowing time optimises the probability of achieving high target grain yields.
The third year of trials was conducted in the winter growing season of 2016 and is reported here.
Method
Three irrigated canola experiments were conducted at Leeton Field Station in the Murrumbidgee Valley in 2016 (Table 1). The experiments were located on self-mulching medium clay following a 2015 barley crop. Spring irrigations were scheduled according to soil moisture readings but due to higher than average rainfall (Table1), no spring irrigations were required. The three canola experiments were sown in April 2016 and harvested in late November 2016. The experimental plots were planted in bays that were bordered by contour banks for surface flood irrigation. Machine harvest was conducted using a Kingaroy plot harvester with the entire plot being harvested for machine yield assessment. Prior to the machine harvest, a hand harvest was obtained from the three experiments by collecting 2m2 biomass cuts from every plot. The 2m2 biomass cuts will be used to calculate a hand harvest yield. At the time of writing this paper, the 2m2 biomass cut had not yet been processed for a hand harvested yield. Only the machine harvested yields, which are generally 25% lower than hand harvested yields due to grain losses during machine harvesting, are reported in this paper. Sub samples of the machine harvest grain were used to measure and calculate oil content. The lodging assessments were conducted using a scale of 0 to nine, with 0 indicating no lodging and nine indicating the plot was flat on the ground. Each treatment was replicated three times in a randomised block design. Individual trials were analysed within Genstat 17th edition (VSN International 2014).
Table 1. Canola experiment site details.
| LFS Canola - trial 1 | LFS Canola - trial 2 | LFS Canola - trial 3 | |
|---|---|---|---|
| Trial design | Variety (12) x Plant population (2) x Sowing date (2) x 3 replicates | Variety (12) x Nitrogen management (4) x 3 replicates | Variety (6) x Plant population (5) x 3 replicates |
| Varieties | Hyola®600RR Pioneer®45Y88 (CL) ATR-Bonito AV-Garnet ATR-Gem Nuseed Diamond Nuseed GT-50 Hyola®559TT Victory®V3002 Hyola®575CL Pioneer®44Y89 (CL) Pioneer®45Y25 (RR) |
Hyola®600RR Pioneer®45Y88 (CL) ATR-Bonito AV-Garnet ATR-Gem Nuseed Diamond Nuseed GT-50 Hyola®559TT Victory®V3002 Hyola®575CL Pioneer®44Y89 (CL) Pioneer®45Y25 (RR) |
Hyola®600RR Pioneer®45Y88 (CL) ATR-Bonito AV-Garnet ATR-Gem Nuseed Diamond - - - - - - - |
| Sowing date | SD 1: 5 April 2016 SD 2: 26 April 2016 |
18 April 2016 | 18 April 2016 |
| Target plant population | Low: 20 plants/m2 Medium: 40 plants/m2 |
40 plants/m2 | Very low: 10 plants/m2 Low: 25 plants/m2 Medium: 40 plants/m2 High: 55 plants/m2 Very high: 70 plants/m2 |
| Irrigation schedule | SD 1 - Irrigate-up 5 April SD 2 - Pre-irrigated 5 April No Spring irrigation Total 1.2ML/ha |
Irrigate-up - 19 April No Spring irrigation Total 1.2ML/ha |
Irrigate-up - 19 April No Spring irrigation Total 1.2ML/ha |
| Rainfall | Autumn - 147mm Winter - 236mm Spring (not including Nov rainfall) - 184mm Total 567mm (5.7ML/ha) |
Autumn - 147mm Winter - 236mm Spring (not including Nov rainfall) - 184mm Total 567mm (5.7ML/ha) |
Autumn - 147mm Winter - 236mm Spring (not including Nov rainfall) - 184mm Total 567mm (5.7ML/ha) |
| Base fertiliser | S-Perfect 400kg/ha MAP 150kg/ha Gran-am 150kg/ha Urea 220kg/ha |
S-Perfect 400kg/ha MAP 150kg/ha Gran-am 150kg/ha Urea 220kg/ha |
S-Perfect 400kg/ha MAP 150kg/ha Gran-am 150kg/ha Urea 220kg/ha |
| Topdressed fertiliser (at visible bud) | Urea 220kg/ha | Very low - No topdressing Low - Urea 110kg/ha Medium - Urea 220kg/ha High - Urea 330kg/ha |
Urea 220kg/ha |
| Fungicides | Prosaro® at 400mL/ha x 2 | Prosaro® 400mL/ha x 2 | Prosaro® 400mL/ha x 2 |
Results and discussion
Grain yield
Variety had a significant effect on canola grain yield in all three experiments. Pioneer®45Y88 (CL) had the highest average machine harvested yield across the three experiments (4.30t/ha) and was the highest individually yielding variety in all experiments. Nuseed Diamond had the second highest average yield (4.05t/ha) and was the second highest yield in two experiments, followed by Pioneer®45Y25 (RR) (3.99t/ha). AV-Garnet, Hyola®575CL, Nuseed GT-50, Hyola®600RR and Pioneer®44Y89 (CL) all had an average yield over 3.6t/ha (Table 2). ATR-Bonito was the lowest yielding variety in two of the three experiments and had the lowest average yield (3.18t/ha). ATR-Gem, Victory®V3002 and Hyola®559TT also yielded consistently below 3.5t/ha (Table 2).
Table 2. Grain yield (t/ha) of 12 canola varieties evaluated in the irrigated canola experiments at Leeton, 2016.
| Variety | Trial 1 (V.POP.SD) (t/ha) | Trial 2 (V.N) (t/ha) | Trial 3 (V.POP) (t/ha) | Average (t/ha) |
|---|---|---|---|---|
| Pioneer®45Y88 (CL | 4.25 | 4.47 | 4.19 | 4.30 |
| Nuseed Diamond | 3.88 | 4.09 | 4.18 | 4.05 |
| Pioneer®45Y25 (RR) | 3.99 | 4.0 | - | 3.99 |
| AV-Garnet | 3.96 | 3.59 | 3.62 | 3.72 |
| Hyola®575CL | 3.46 | 3.91 | - | 3.69 |
| Nuseed GT-50 | 3.59 | 3.76 | - | 3.67 |
| Hyola®600RR | 3.77 | 3.56 | 3.51 | 3.61 |
| Pioneer®44Y89 (CL) | 3.54 | 3.66 | - | 3.60 |
| Hyola®559TT | 3.44 | 3.24 | - | 3.34 |
| Victory®V3002 | 3.19 | 3.48 | - | 3.33 |
| ATR-Gem | 3.26 | 3.42 | 3.28 | 3.32 |
| ATR-Bonito | 3.11 | 3.24 | 3.20 | 3.18 |
| l.s.d (P<0.05) | 0.30 | 0.27 | 0.24 |
The first sowing date (5 April) had an average grain yield of 3.84t/ha and second sowing date (26 April) had a grain yield of 3.40t/ha. A significant interaction between varieties and sowing date was observed with AV-GarnetA, Hyola®600RR, Nuseed GT-50, Pioneer®44Y89 (CL), Hyola®559TT and Victory®V3002 all having a significantly higher yield in the first sowing date (Figure 1).
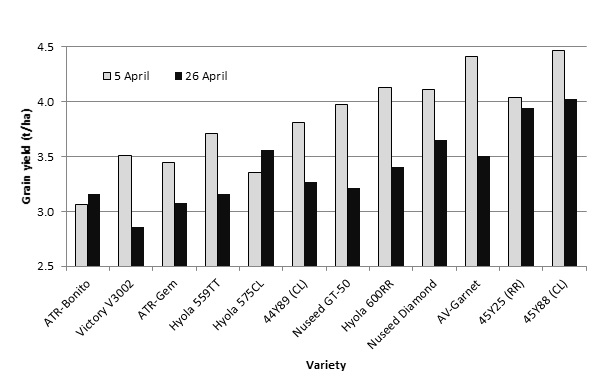
Figure 1. Grain yield of 12 canola varieties at two sowing dates in the irrigated canola-1 experiment at Leeton, 2016 (l.s.d. (P <0.05) = 0.48t/ha).
Nitrogen rate affected grain yield with the very low rate of 150kg N/ha base and no topdressed N resulting in a significantly lower grain yield (3.46t/ha) than the three other rates. The low, medium and high N application rates yielded 3.72t/ha, 3.85t/ha and 3.79t/ha, respectively and did not differ significantly (Figure 2).
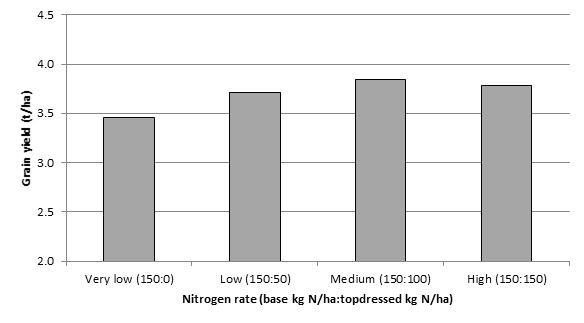
Figure 2. Canola grain yield of four nitrogen rates in the irrigated canola-2 experiment at Leeton, 2016 (l.s.d. (P <0.05) = 0.16t/ha).
Plant population affected canola grain yield in the canola-3 experiment where five different plant populations were evaluated. There was no statistical variation in the middle three plant populations (25, 40 and 55 plants/m2). The highest population (70 plants/m2) yielded significantly lower than 40 plants/m2 and the lowest population (10 plants/m2) yielded significantly lower than all other populations (Figure 3).
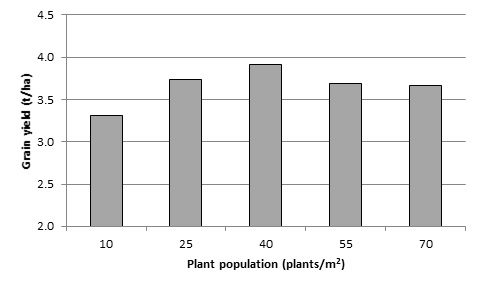
Figure 3. Canola grain yield of five plant populations in the irrigated canola-3 experiment at Leeton, 2016 (l.s.d. (P <0.05) = 0.23t/ha).
Grain quality
Variety impacted on canola oil content in two of the three experiments. AV-Garnet (45.9%), Pioneer®45Y88 (CL) (45.7%), Hyola®559TT (45.7%) and Nuseed Diamond (45.5%) were in the top five highest oil yielding varieties in both experiments (Table 3).
Table 3. Grain oil content of 12 canola varieties evaluated in two irrigated canola experiments at Leeton, 2016.
| Variety | Trial 1 (V.POP.SD) (%) | Trial 2 (V.N) (%) | Average (%) |
|---|---|---|---|
| AV-Garnet | 45.46 | 46.35 | 45.90 |
| Pioneer®45Y88 (CL) | 44.77 | 46.69 | 45.73 |
| Hyola®559TT | 45.02 | 46.39 | 45.70 |
| Nuseed Diamond | 44.87 | 46.19 | 45.53 |
| Pioneer®45Y25 (RR) | 43.93 | 46.59 | 45.26 |
| ATR-Bonito | 44.70 | 45.69 | 45.19 |
| Hyola®600RR | 44.56 | 45.51 | 45.03 |
| Nuseed GT-50 | 44.73 | 45.26 | 44.99 |
| ATR-Gem | 43.46 | 45.53 | 44.49 |
| Pioneer®44Y89 (CL) | 43.30 | 45.64 | 44.47 |
| Hyola®575CL | 42.62 | 46.00 | 44.31 |
| Victory®V3002 | 43.52 | 44.51 | 44.01 |
| l.s.d. (P<0.05) | 1.07 | 1.04 |
In the canola-1 experiment, the later sowing date (26 April) resulted in a significantly higher grain oil content of 46.05% compared with 42.44% for the earlier sowing date (5 April). All varieties had a higher oil content at the later sowing date but the level of response to sowing date varied between varieties. Hyola®575CL showed the greatest response to delayed sowing with an increase of 5.57%, followed by Pioneer®45Y88 (CL) (5.24%) and Nuseed Diamond (4.63%). ATR-Gem showed the least difference between sowing times with an increase of 2.03% from delayed sowing followed by Hyola®600RR and ATR-Bonito, both with an increase of 2.80%.
In the canola-2 experiment (four different N rates), a significant trend was observed with decreasing oil content as N rate increased. The ‘very low’ N treatment had the highest average oil content with 46.91% and was statistically similar to the ‘low’ N treatment with 46.74%. The ‘high’ N treatment had the lowest average oil content with 44.39% and was significantly lower than all other N treatments (Figure 4).
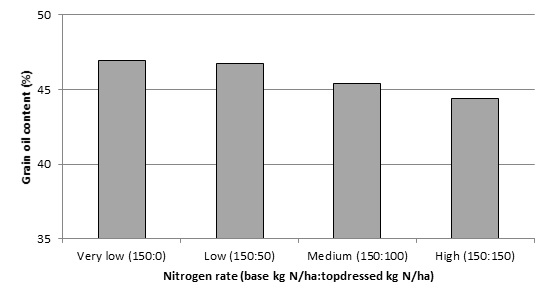
Figure 4. Grain oil content of four nitrogen rates in the irrigated canola-2 experiment at Leeton, 2016 (l.s.d. (P <0.05) = 0.60%).
Lodging
Variety selection significantly affected lodging in all three experiments. Hyola®559TT had the highest average lodging score followed by Hyola®600RR and AV-Garnet which were in the top three most lodged varieties in every experiment (Table 4). Pioneer®45Y88 (CL) had the lowest lodging in two of the three experiments and the lowest average lodging (0.56), followed by Hyola®575CL (0.97) and Pioneer®45Y25 (RR) (1.22). A correlation between yield and the incidence of lodging was observed. In the canola-2 experiment, the top four yielding varieties had an average lodging score of 1.63 which was lower than the lowest four yielding varieties with an average lodging score 3.16.
Table 4. Lodging score (0=no lodging; 9=flat on ground) of 12 canola varieties in the three irrigated canola experiments at Leeton, 2016.
| Trial 1 (V.POP.SD) | Trial 2 (V.N) | Trial 3 (V.POP) | Average | |
|---|---|---|---|---|
| Pioneer®45Y88 (CL) | 0.32 | 0.33 | 0.32 | |
| Hyola®575CL | 0.38 | 1.55 | 0.97 | |
| Pioneer®45Y25 (RR) | 0.59 | 1.86 | 1.22 | |
| Pioneer®44Y89 (CL) | 1.21 | 2.07 | 1.03 | 1.43 |
| Victory®V3002 | 1.49 | 2.13 | 1.81 | |
| Nuseed Diamond | 2.39 | 2.79 | 3.10 | 2.76 |
| Nuseed GT-50 | 2.33 | 3.95 | 3.14 | |
| ATR-Gem | 3.12 | 3.07 | 3.89 | 3.36 |
| ATR-Bonito | 3.32 | 3.56 | 3.86 | 3.58 |
| AV-Garnet | 2.67 | 4.15 | 4.71 | 3.84 |
| Hyola®600RR | 3.59 | 4.39 | 5.20 | 4.39 |
| Hyola®559TT | 5.26 | 3.88 | 4.57 | |
| l.s.d. (P<0.05) | 0.59 | 0.66 | 0.60 |
A significant trend was observed in the canola-3 experiment between lodging and plant population with lodging scores increasing as plant population increased (Table 5). The ‘very high’ plant population had the highest average lodging score of 4.77 which was statistically similar to the ‘high’ plant population with a lodging score of 4.49. The ‘very low’ plant population had the lowest average lodging score of 2.65 which was significantly similar to the ‘low’ plant population with an average lodging score of 2.98.
Table 5. Lodging score response to plant population in the irrigated canola-3 experiment at Leeton, 2016.
| Plant population | Lodging score (0=no lodging; 9=flat on ground) |
|---|---|
| Very low - 10 plants/m2 | 2.65 |
| Low - 25 plants/m2 | 2.98 |
| Medium - 40 plants/m2 | 3.26 |
| High - 55 plants/m2 | 4.49 |
| Very high - 70 plants/m2 | 4.77 |
| l.s.d (P<0.05) | 0.55 |
A significant trend was observed in the canola-2 experiment between lodging and N rate with lodging scores increasing as N rate increased (Table 6). The ‘high’ N rate had the most lodging with an average lodging score of 4.31 and had significantly more lodging than all other N treatments. The ‘very low’ N treatment had the least lodging with an average lodging score of 1.34 and had significantly less lodging than all other N treatments.
Table 6. Lodging score response to nitrogen rate in the irrigated canola-2 experiment at Leeton, 2016.
| Nitrogen rate | Lodging score (0=no lodging; 9=flat on ground) |
|---|---|
| Very low - 150kg N/ha | 1.34 |
| Low - 200kg N/ha | 2.00 |
| Medium - 250kg N/ha | 3.59 |
| High - 300 N/ha | 4.31 |
| l.s.d (P<0.05) | 0.37 |
Lodging scores were significantly higher in the later sowing date of 26 April (2.62) compared with the earlier sowing date of 5 April (1.82). Nuseed Diamond, ATR-Bonito, AV-Garnet and ATR-Gem had the highest lodging response to sowing date with significantly higher lodging at the second time of sowing (Figure 5).
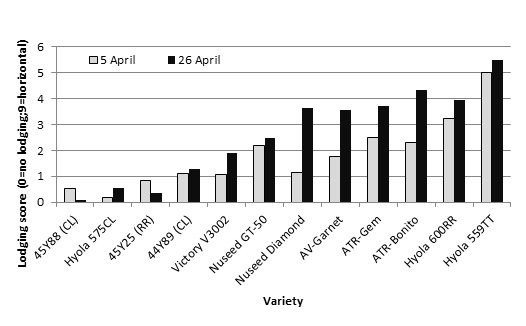
Figure 5. Lodging score of 12 canola varieties at two sowing dates in the irrigated canola-1 experiment at Leeton, 2016 (l.s.d. (P <0.05) = 0.87).
Hyola®600RR was the tallest variety at 168.7cm when averaged across the three trials while ATR-Bonito was the shortest variety with an average height of 138.5cm. No correlation between plant height and lodging was observed in these experiments. The canola-3 experiment demonstrated that plant population did not affect plant height (Table 7).
Table 7. Plant height (cm) of 12 varieties in the three irrigated canola experiments at Leeton.
| Trial 1 (V.POP.SD) | Trial 2 (V.N) | Trial 3 (V.POP) | Average | |
|---|---|---|---|---|
| ATR-Bonito | 125.1 | 144.0 | 146.4 | 138.5 |
| ATR-Gem | 144.2 | 150.7 | 153.3 | 149.4 |
| Nuseed Diamond | 149.0 | 153.2 | 151.9 | 151.4 |
| Hyola®559TT | 146.2 | 157.1 | 151.7 | |
| Victory®V3002 | 146.8 | 158.5 | 152.7 | |
| Hyola®575CL | 146.7 | 160.0 | 153.4 | |
| Pioneer®44Y89 (CL) | 146.8 | 158.6 | 164.4 | 156.6 |
| AV-Garnet | 152.9 | 162.2 | 160.9 | 158.7 |
| Pioneer®45Y88 (CL) | 154.1 | 163.8 | 159.0 | |
| Pioneer®45Y25 (RR) | 154.6 | 164.2 | 159.4 | |
| Nuseed GT-50 | 159.0 | 165.5 | 162.3 | |
| Hyola®600RR | 162.7 | 170.2 | 173.2 | 168.7 |
| l.s.d. (P<0.05) | 5.39 | 4.56 | 4.42 |
Conclusion
The 2016 irrigated canola experiments at Leeton Field Station demonstrated that varietal selection is a key driver for achieving a maximum yield under irrigation. The three experiments averaged 3.65t/ha across all varieties and treatments. Pioneer®45Y88 (CL), Nuseed Diamond, Pioneer®45Y25 (RR) and AV-Garnet were the highest average yielding varieties, while the TT varieties were consistently the lowest yielding varieties across the three experiments.
A general trend was observed with an increase in yield when the sowing date was delayed. The lowest N rate of 150kg N/ha resulted in lower grain yield than all other N rates. There was no increase in yield when N rates exceeded 200kg N/ha.
A plant population between 25 and 55 plants/m2 resulted in the highest grain yields. Yields were reduced when the plant population was below 25 plants/m2 and above 55 plants/m2.
Variety selection also had a significant effect on grain oil content with AV-Garnet, Pioneer®45Y88 (CL), Hyola®559TT and Nuseed Diamond all achieving the highest average oil content when averaged across these experiments.
The sowing date and N application rate both had a significant effect on grain oil content. The average oil content declined with the delay in sowing time and also declined with every increase in N application. Plant population did not affect oil content.
Variety selection also had a significant effect on lodging. Pioneer®45Y88 (CL), Hyola®575CL, Pioneer®45Y25 (RR), Pioneer®44Y89 (CL) and Victory®V3002 had low levels of lodging while Hyola®559TT, Hyola®600RR and AV-Garnet showed their susceptibility to lodging with high lodging scores. A trend was observed with an increase in yield as the incidence of lodging decreased.
Sowing date, plant population and N rate all had a significant effect on the incidence of crop lodging. Crop lodging increased as plant population increased and as N application rate increased. Crop lodging also increased with the sowing delay from 5 April to the 26 April.
Useful resources
Slinger, D, Madden, E, Podmore, C & Martin C (eds) 2016, Southern NSW research results 2015. NSW Department of Primary Industries.
Podmore C & Napier T (2014). $1.2 million boost to irrigated cereal & canola research. IREC Farmers’ Newsletter – Large Area Edition No. 191: Spring 2014.
Napier T, Slinger D, Gaynor L, Graham N & Podmore C (2015). Achieving 4 t/ha of irrigated canola in the Murrumbidgee. IREC Farmers’ Newsletter – Large Area Edition No. 192: Autumn 2015.
Napier T, Slinger D, Gaynor L, Graham N & Podmore C (2015). Southern irrigated crops project update. IREC Farmers’ Newsletter – Large Area Edition No. 193: Spring 2015.
Napier T, Podmore C, Slinger D, Gaynor L & Graham N (2016). Lifting irrigated canola yields. IREC Farmers’ Newsletter – Large Area Edition No. 194: Autumn 2016.
Napier T, Gaynor L, Slinger D, Graham N & Podmore C (2015). Drivers of high-yielding irrigated canola production. Proceedings of the 17th ASA Conference, 20–24 September 2015, Hobart, Australia. Website: Australian Society and Agronomy.
Acknowledgements
This research is a collaborative project between the GRDC and the NSW Department of Primary Industries. The research undertaken as part of this project is made possible by the significant contributions of growers through both trial cooperation and the support of the GRDC, the author would like to thank them for their continued support.
The authors would also like to gratefully acknowledge the support of Gabby Napier and Michael Hately for assistance with trial management, field assessments and data collection.
Contact details
Tony Napier
NSW Department of Primary Industries
Yanco Agricultural Institute, Private Mail Bag, Yanco NSW 2703
02 6951 2796
tony.napier@dpi.nsw.gov.au
@NSWDPI_AGRONOMY
GRDC Project Code: DAN00198,
Was this page helpful?
YOUR FEEDBACK
