The key drivers of high end irrigated wheat yields
ɸExtra technical comment by Protech Consulting Pty Ltd
Take home messages
- Correct varietal selection and optimal agronomic management can result in irrigated wheat yields of over 10t/ha. Cobra was the highest yielding variety with an average yield of 10.79t/ha when averaged across both trials. LongReach Trojan, Beckom and Chara also yielded well.
- As plant population increased from 120 plants/m2 to 200 plants/m2, the average grain yield declined by 0.15t/ha.
- Varietal differences in grain protein content were observed with the durum line 280913 achieving the highest grain protein content in both trials. Wallup, EGA Bellaroi, Corack and Mace also achieved high grain protein content.
- Nitrogen (N) timing significantly affected grain protein and lodging. Grain protein content increased and lodging decreased as N application was delayed.
- The incidence of lodging increased as plant population increased.
Background
There is widespread evidence of the impact varietal selection and agronomic management has on dryland wheat grain yield. However, less research has been conducted on irrigated cropping systems in south-eastern Australia on modern wheat varieties where irrigated wheat is common in crop rotations.High-yielding irrigated wheat is also dependent on correct varietal selection for the region and optimum agronomic management for the chosen variety. There is significant potential to increase irrigated crop yields and the ‘Southern irrigated cereal and canola varieties achieving target yields’ project has demonstrated how this can be achieved over three years of trials.
The trial results from the first two years demonstrated that the optimum combination of variety selection and agronomic management can result in a wheat grain yield consistently higher than 10t/ha (when measured by machine harvest) in the Murrumbidgee and Murray Valleys. Nitrogen (N) management and plant population also affected grain yield, quality and lodging.
The third year of trials was conducted in the winter growing season of 2016 and is reported here.
Method
The irrigated wheat experiments were conducted at Coleambally in the Murrumbidgee Valley and Finley in the Murray Valley, southern NSW (Table 1). The Coleambally experiment evaluated the effect of variety selection and plant population, while the Finley experiment evaluated the effect of variety selection and N timing (Table 2).
Soil moisture content was measured daily with a Hanson logger and watermark sensors. Due to the higher than average rainfall, no spring irrigations were applied at the Coleambally site and only one spring irrigation was applied at the Finley site (Table 2). The two wheat experiments were sown in early May 2016 and harvested in early December 2016. The Coleambally site was sown into permanent beds following a 2015/16 soybean crop. The Finley site was sown into a border check irrigation layout following a 2015 wheat crop.
Prior to the machine harvest, a hand harvest was obtained from both experiments by collecting 2m2 biomass cuts from every plot. The 2m2 biomass cuts will be used to calculate a hand harvest yield. Machine harvest was conducted using a Kingaroy plot harvester with the entire plot being harvested for a machine yield assessment. At the time of writing this paper, the 2m2 biomass cuts had not yet been processed for a hand harvested yield. Only the machine harvested yields, which are generally 10–15% higher than hand harvested yields due to edge effects, are reported in this paper.
Subsamples of the machine harvest grain were used to calculate screenings, grain weight, grain protein and test weight. Yield and protein content were calculated at 12% grain moisture. The lodging assessments were conducted using a score of 0–9, with 0 indicating no lodging and 9 indicating the plot was flat on the ground. Each treatment was replicated three times in a randomised block design. Individual trials were analysed within Genstat 17th edition (VSN International 2014).
Table 1. Wheat experiment site details.
| Coleambally | Finley | |
|---|---|---|
| Trial design | Variety (12) x Plant population (4) x 3 replicates | Variety (12) x Nitrogen (4) x 3 replicates |
| Soil type | Medium grey clay | Medium red clay |
| Previous crop | Soybeans (2015-16) | Wheat (2015) |
| Plot size | 1.2m x 10.5m = 12.60m2 | 1.5m x 10.5m = 15.75m2 |
| Row spacing | 200mm (6 rows per plot and furrows not sown) | 250mm (6 rows per plot) |
| Varieties | Suntop Corack LongReach Lancer Cobra Kiora Wallup Chara EGA Bellaroi 280913 LongReach Trojan Mace EGA Gregory - - |
Suntop Corack LongReach Lancer Cobra Kiora Wallup Chara EGA Bellaroi 280913 LongReach Trojan - - Beckom DS Darwin |
| Sowing date | 4 May 2016 | 3 May 2016 |
| Plant population | Very low - 80 plants/m2 Low - 120 plants/m2 Medium - 160 plants/m2 High - 200 plants/m2 |
180 plants m2 |
| Irrigation layout | Permanent beds | Border check |
| Irrigation schedule | No irrigation applied | One spring irrigation (29/10/16) Total 0.8ML/ha |
| Rainfall | Autumn - 97mm Winter - 191mm Spring - 167mm Total 457mm (4.6ML/ha) |
Autumn - 80mm Winter - 189mm Spring - 178mm Total 447mm (4.5ML/ha) |
| Base fertiliser | MAP 200kg/ha | MAP 150kg/ha |
| Herbicides | MCPA 1.25L/ha LontrelTM 70mL/haɸa |
Boxer Gold® 2.0L/ha Axial® 300mL/ha LVE MCPA 1.8L/ha |
| Fungicides | Orius® 150mL/haɸb (by aircraft) |
Prosaro® 200mL/ha (2 applications) |
| Harvest date | 2 December 2016 | 12 December 2016 |
ɸaLowest label rate on Lontrel Advanced is 50ml/ha for volunteer vetch. Most weeds need 75ml/ha.
ɸbLabel rate is 145ml/ha or 290ml/ha.
Table 2. Nitrogen timing treatments evaluated in the 2016 Finley irrigated wheat trial.
| Nitrogen treatment | Base (kg N/ha) | First node (kg N/ha) | Booting (kg N/ha) | Total (kg N/ha) |
|---|---|---|---|---|
| Early N (EN) | 145 | 100 | 0 | 245 |
| Late N (LN)-1 | 45 | 150 | 50 | 245 |
| Late N (LN)-2 | 45 | 100 | 100 | 245 |
| Late N (LN)-3 | 45 | 50 | 150 | 245 |
Results and discussion
Grain yield
Variety had a significant effect on grain yield in both the Coleambally and Finley experiments. The highest yield achieved was Cobra at Coleambally (11.48t/ha) which also had the highest average yield across the two experiments. LongReach Trojan was the second highest yielding variety in both experiments with an average of 10.68t/ha. Beckom also averaged over 10t/ha, however this variety was only included in the Finley experiment (Table 3).
The durum breeding line 280913 yielded the lowest in both experiments with 7.67t/ha at Coleambally and 3.53t/ha at Finley. EGA Gregory was the second lowest yielding variety with an average yield of 8.51t/ha in the Coleambally experiment.
Table 3. Grain yield (t/ha) of 14 wheat varieties evaluated in the irrigated wheat experiments at Coleambally and Finley, 2016.
| Variety | Coleambally (V.POP) (t/ha) | Finley (V.N) (t/ha) | Average (t/ha) |
|---|---|---|---|
| Cobra | 11.48 | 10.10 | 10.79 |
| LongReach Trojan | 10.99 | 10.38 | 10.68 |
| Beckom | - | 10.41 | 10.41 |
| Chara | 9.82 | 10.05 | 9.93 |
| LongReach Lancer | 10.09 | 9.70 | 9.89 |
| Suntop | 10.04 | 9.49 | 9.77 |
| Kiora | 9.17 | 10.01 | 9.59 |
| Mace | 9.56 | 9.56 | |
| EGA Bellaroi | 9.57 | 8.44 | 9.01 |
| DS Darwin | - | 8.92 | 8.92 |
| Corack | 9.66 | 8.06 | 8.86 |
| Wallup | 9.42 | 7.97 | 8.70 |
| EGA Gregory | 8.51 | 8.51 | |
| 280913 | 7.67 | 3.53 | 5.60 |
| Average | 9.67 | 8.92 | 9.30 |
| l.s.d. (P<0.05) | 0.24 t/ha | 0.46 t/ha |
|
The Coleambally experiment demonstrated a significant effect of plant population on grain yield (Table 4). The ‘low’ population resulted in an average grain yield of 9.74t/ha which was significantly higher than the ‘high’ population that averaged 9.59t/ha. Overall, a trend was observed with yield increasing as plant population decreased from 200 plants/m2 to 120 plants/m2.
There was also a significant interaction between varietal selection and plant population. EGA Gregory, Mace, EGA Bellaroi, Corack and Cobra all had a significantly higher yield at the ‘very low’ or ‘low’ plant populations compared to the high plant population. Alternatively, Wallup, Suntop and Lancer achieved their highest yield at the ‘high’ plant population. Lancer had a significantly higher yield at the ‘high’ plant population compared to the ‘very low’ plant population.
Nitrogen timing did not affect grain yield in the Finley experiment.
Table 4. Grain yield (t/ha) of four plant populations (averaged across all varieties) evaluated in the irrigated wheat experiment at Coleambally, 2016. (l.s.d. (P <0.05) = 0.14t/ha).
| Treatment | Plant population (plants/m2) | Yield (t/ha) |
|---|---|---|
| Very Low | 80 | 9.714 |
| Low | 120 | 9.744 |
| Medium | 160 | 9.611 |
| High | 200 | 9.591 |
| l.s.d. (P<0.05 | 0.140 |
Grain quality
Variety affected grain protein content, screenings, grain weight and test weight in both experiments.
The durum breeding line 280913 achieved the highest grain protein content in both experiments with 13.50% at Coleambally and 13.88% at Finley. This was followed by Wallup (13.22%) and EGA Bellaroi (13.00%). Beckom had the lowest grain protein content at Finley with 10.7% (not included in Coleambally trial) and LongReach Trojan had the second lowest average protein content with 11.13% (Table 5), however it had very high grain yields.
Table 5. Grain protein content of 14 wheat varieties evaluated in two irrigated wheat experiments at Coleambally and Finley, 2016.
| Variety | Coleambally (V.POP) (%) | Finley (V.N) (%) | Average (%) |
|---|---|---|---|
| 280913 | 13.50 | 13.88 | 13.69 |
| Wallup | 13.05 | 13.38 | 13.22 |
| EGA Bellaroi | 13.25 | 12.74 | 13.00 |
| Corack | 12.29 | 12.71 | 12.50 |
| Mace | 12.5 | 12.50 | |
| Cobra | 12.00 | 11.90 | 11.95 |
| EGA Gregory | 11.91 | 11.91 | |
| DS Darwin | 11.80 | 11.80 | |
| Lancer | 12.10 | 11.21 | 11.66 |
| Chara | 11.92 | 11.25 | 11.59 |
| Kiora | 11.94 | 11.03 | 11.49 |
| Suntop | 11.62 | 11.24 | 11.43 |
| LongReach Trojan | 11.43 | 10.83 | 11.13 |
| Beckom | 10.70 | 10.70 | |
| l.s.d. 5% | 0.23% | 0.33% |
Grain protein content increased as the rate of N applied at the booting stage increased (Figure 1). The highest grain protein content was achieved from applying 30kg N/ha at sowing, 50kg N/ha at first node and 150kg N/ha at booting. The lowest protein content resulted from 130kg N/ha being applied at sowing, 100kg N/ha at first node and no N at booting. Plant population did not affect grain protein content at the Coleambally experiment.
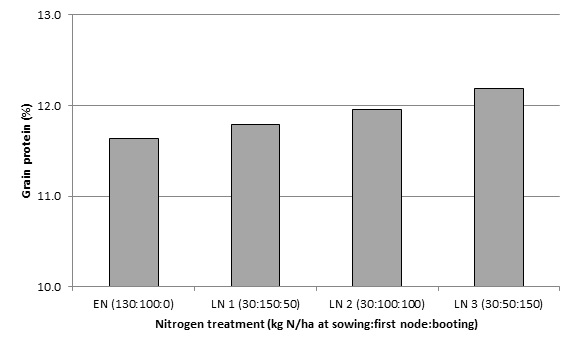
Figure 1. Average grain protein percentage at four nitrogen application times in the irrigated wheat experiment at Finley, 2016 (l.s.d. (P <0.05) = 0.19%).
The Finley trial had higher average screenings with an average of 5.05% compared to Coleambally with an average of 3.65% (Table 6). Wallup achieved the lowest screenings percentage in both experiments with 1.68% at Finley and 1.44% at Coleambally. Other varieties that achieved lower than average screening percentages included 280913, Mace, LongReach Trojan and Corack. Lancer had the highest screenings at Finley (8.39%) with Chara and Suntop also having average screenings greater than 6% at Finley. Kiora had the highest screenings at Coleambally (5.48%) with Lancer, EGA Gregory and Chara also having average screenings greater than 4% at Coleambally.
The two durum varieties of 280913 and EGA Bellaroi had the highest grain weight when averaged across both experiments with thousand grain weights of 56.94g and 53.41g, respectively. The bread wheats with the highest average grain weight across both experiments were Corack, DS Darwin and LongReach Trojan with an average thousand grain weight of 52.91g, 51.03g and 48.19g, respectively. Kiora, Chara and Beckom had the lowest average thousand grain weights with 41.22g, 42.49g and 42.53g (Table 6).
LongReach Trojan (86.4kg/hL), Lancer (86.3kg/hL) and DS Darwin (86.2kg/hL) achieved the highest average test weight when averaged across both experiments. Line 280913 (80.1g) had the lowest test weight followed by EGA Bellaroi (83.5kg/hL) and Wallup (84.4kg/hL) (Table 6).
Screenings percentage, grain weight and test weight were not affected by plant population or N treatment.
Table 6. Grain quality measurements of 14 wheat varieties (in order of descending yield) evaluated in the two irrigated wheat experiments at Coleambally and Finley, 2016.
| Variety | Screenings (%) | Thousand grain weight (g) | Test weight (kg/hL) | |||
|---|---|---|---|---|---|---|
| Coleambally | Finley | Coleambally | Finley | Coleambally | Finley | |
| Cobra | 3.58 | 5.18 | 44.64 | 47.24 | 85.19 | 86.35 |
| LongReach Trojan | 3.24 | 3.73 | 46.14 | 50.67 | 86.16 | 86.69 |
| Beckom | - | 5.89 | - | 42.53 | - | 85.66 |
| Chara | 4.41 | 6.82 | 40.52 | 44.45 | 84.94 | 84.99 |
| Lancer | 4.88 | 8.39 | 44.55 | 48.36 | 86.38 | 86.15 |
| Suntop | 3.84 | 6.04 | 44.70 | 45.91 | 85.64 | 85.50 |
| Kiora | 5.58 | 4.70 | 37.93 | 44.51 | 84.94 | 86.04 |
| Mace | 2.84 | 44.22 | - | 84.46 | - | |
| EGA Bellaroi | 3.52 | 4.97 | 51.37 | 55.45 | 83.50 | 83.49 |
| DS Darwin | - | 5.80 | - | 51.03 | - | 86.18 |
| Corack | 3.23 | 3.95 | 51.98 | 53.83 | 85.00 | 85.02 |
| Wallup | 1.44 | 1.68 | 43.78 | 45.36 | 85.38 | 83.42 |
| EGA Gregory | 4.80 | - | 45.49 | - | 84.56 | - |
| 280913 | 2.44 | 3.43 | 56.40 | 57.48 | 82.10 | 78.05 |
| Average | 3.65 | 5.05 | 45.98 | 48.90 | 84.85 | 84.55 |
| l.s.d. (P<0.05) | 0.99% | 1.14% | 0.97g | 1.02g | 1.26g | 0.88g |
Lodging
Lodging was affected by variety, plant population and N management. Lodging was slightly higher in the Finley trial with an average lodging score of 3.22 compared to the Coleambally trial with an average lodging score of 2.19 (score 0 equals no lodging and 9 the plot was flat on the ground). There was no correlation between lodging and grain yield.
EGA Gregory had the highest lodging score of 3.24 at the Coleambally experiment and was the only variety with a score over 3.0. Lancer, Chara and Kiora had the highest lodging scores at the Finley experiment and were the only varieties with lodging scores over 4.0. Line 280913, EGA Bellaroi and Corack all demonstrated the highest tolerance to lodging with the lowest lodging scores when averaged across both experiments (Table 7).
Table 7. Grain quality measurements of 14 wheat varieties evaluated in two irrigated wheat experiments at Coleambally and Finley, 2016 (0 indicating no lodging and 9 indicating the plot was flat on the ground).
| Variety | Coleambally | Finley |
|---|---|---|
| 280913 | 1.73 | 0.70 |
| EGA Bellaroi | 2.43 | 0.78 |
| Corack | 1.92 | 2.04 |
| LongReach Trojan | 1.47 | 3.11 |
| Mace | 2.31 | - |
| Cobra | 2.07 | 3.58 |
| Suntop | 2.09 | 3.59 |
| Wallup | 2.51 | 3.70 |
| Kiora | 2.04 | 4.38 |
| EGA Gregory | 3.24 | - |
| Chara | 2.18 | 4.61 |
| LongReach Lancer | 2.33 | 4.64 |
| Beckom | - | 3.69 |
| DS Darwin | - | 3.85 |
| l.s.d. (P<0.05) | 0.68 | 0.72 |
At the Coleambally experiment (variety x population), the incidence of lodging increased as plant population increased (Figure 2). Both the ‘very low’ and ‘low’ plant populations had significantly less lodging than the ‘medium’ and ‘high’ plant populations.
At the Finley experiment (variety x N timing), the incidence of lodging was highest (3.66) when the majority of the N budget was applied at sowing (130kg N/ha at sowing, 100kg N/ha at first node and 0kg N/ha at booting). Lodging decreased as the amount of N applied at first node decreased, and the amount of N applied at booting increased (Figure 3).
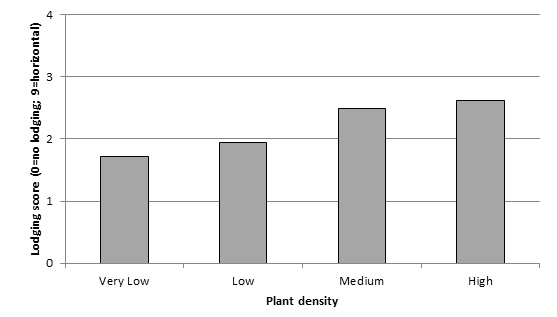
Figure 2. Average lodging scores of the four plant populations in the irrigated wheat experiment at Coleambally, 2016 (l.s.d. (P <0.05) = 0.39).
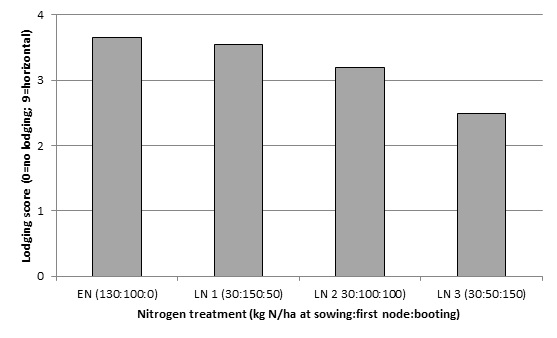
Figure 3. Average lodging scores of the four nitrogen timing treatments in the irrigated wheat experiment at Finley, 2016 (l.s.d. (P <0.05) = 0.41).
Conclusion
The 2016 irrigated wheat experiments at Coleambally and Finley demonstrated that varietal selection is a key driver for achieving maximum yield under irrigation. The two experiments averaged 9.30t/ha across all varieties and treatments. Cobra was the highest yielding variety with 10.78t/ha when averaged across the two experiments. Other high yielding varieties include LongReach Trojan, Beckom and Chara. Plant population demonstrated a significant effect on grain yield. A trend was observed with grain yield increasing as plant population decreased from 200 plants/m2 to 120 plants/m2. There was also a significant interaction between varietal selection and plant population. EGA Gregory, Mace, EGA Bellaroi, Corack and Cobra had higher average yields at the lower plant populations while Wallup, Suntop and Lancer had higher average yields at the higher plant populations. Nitrogen timing did not demonstrate an effect on grain yield in the N application experiment.
Variety selection had a significant effect on grain protein content with line 280913, Wallup, EGA Bellaroi, Corack and Mace all achieving a grain protein content greater than 12.5% when averaged across both experiments. The timing of N application also had a significant effect on grain protein content. As the N application rate increased at booting, the grain protein percentage increased.
Lodging was affected by variety, plant population and N management. EGA Gregory, Lancer, Chara and Kiora all demonstrated their susceptibility to lodging while line 280913, EGA Bellaroi and Corack all demonstrated they were the most resistant varieties to lodging. The Coleambally population experiment demonstrated that the incidence of lodging increased as plant population increased. The Finley N timing experiment demonstrated that the incidence of lodging decreased with any delay in N application.
Screenings percentage, grain weight and test weight were significantly affected by variety selection but not affected by plant population or N timing. The variety Wallup had the lowest average screenings in both experiments while Lancer and Chara demonstrated the highest average screenings when averaged across both experiments. Line 280913 and EGA Bellaroi achieved the highest grain weight when averaged across both experiments with a thousand grain weight of over 53g for both varieties. Kiora, Chara and Beckom achieved the lowest grain weights when averaged across both experiments with a thousand grain weight less than 43g for these varieties.
LongReach Trojan, Lancer and DS Darwin achieved the highest average test weight when averaged across both experiments. Line 280913, EGA Bellaroi and Wallup achieved the lowest average test weight when averaged across both experiments.
Useful resources
Slinger, D, Madden, E, Podmore, C & Martin C (eds). 2016, Southern NSW research results 2015. NSW Department of Primary Industries.
Podmore C & Napier T (2014) $1.2 million boost to irrigated cereal & canola research. IREC Farmers’ Newsletter – Large Area Edition No. 191: Spring 2014.
Napier T, Slinger D, Gaynor L, Graham N & Podmore C (2015). Achieving 10 t/ha of irrigated wheat in the Murrumbidgee. IREC Farmers’ Newsletter – Large Area Edition No. 192: Autumn 2015.
Napier T, Slinger D, Gaynor L, Graham N & Podmore C (2015). Southern irrigated crops project update. IREC Farmers’ Newsletter – Large Area Edition No. 193: Spring 2015.
Napier T, Podmore C, Graham N, Gaynor L & Slinger D (2016). Lifting irrigated wheat yields. IREC Farmers’ Newsletter – Large Area Edition No. 194: Autumn 2016.
Napier T, Gaynor L, Slinger D, Graham N & Podmore C (2015). Drivers of high-yielding irrigated wheat production. Proceedings of the 17th ASA Conference, 20–24 September 2015, Hobart, Australia. Website: Australian Society of Agronomy.
Acknowledgements
This research is part of the ‘Irrigated Cereal and Canola Varieties Achieving Target Yields’ (DAN00198) project which is jointly funded by GRDC and NSW Department of Primary Industries. The research undertaken as part of this project is made possible by the significant contributions of growers through both trial cooperation and the support of the GRDC — the author would like to thank them for their continued support.
We would like to gratefully acknowledge David and Paul Bellato (Coleambally) and Warren Lang (Finley) for allowing us to conduct the experiments on their properties. We would also like to acknowledge the support of Gabby Napier and Michael Hately for assistance with trial management, field assessments and data collection.
Contact details
Tony Napier
NSW Department of Primary Industries
Yanco Agricultural Institute
Private Mail Bag, Yanco NSW 2703
02 6951 2796
tony.napier@dpi.nsw.gov.au
@NSWDPI_AGRONOMY
GRDC Project Code: DAN00198,
Was this page helpful?
YOUR FEEDBACK