Nitrogen management in wheat 2016 - method, timing and variety
Author: Richard Daniel, Denielle Kilby and Linda Bailey, Northern Grower Alliance | Date: 07 Mar 2017
Take home messages
1. The rate of nitrogen applied was the main factor impacting yield and grain quality in all trials.
2. Urea spread with no physical incorporation, provided equivalent crop responses to urea spread and incorporated.
3. There was no consistent impact from N application timing.
In recent years, NGA have been heavily involved in projects focussed on nitrogen (N) application strategies in wheat, particularly to assist the management of high yielding, and frequently lower protein achieving, wheat varieties such as EGA Gregory and Suntop. In 2016 the trial activity focussed on two main areas; 1) the impact of method of application of urea (spread v incorporated) and 2) the impact of timing of urea application (comparing December, February and planting application).
What was done?
Three sites were established in 2016 in paddocks identified by agronomists and growers as low in nitrogen or expected to be N responsive. Suntop was the test variety in three N method x timing trials with EGA Gregory and Lancer evaluated in three variety comparison trials. Both approaches were conducted at each trial site with urea as the only nitrogen source.
All trials were established using small plot planters with row spacings of 32cm and plot lengths of 9-12m. The N application approaches evaluated were;
Suntop timing and method trial
- Application A - N spread and then incorporated by narrow point tynes (fallow Nov/Dec)
- Application B - N spread on soil surface (fallow Nov/Dec)
- Application C - N spread and then incorporated by narrow point tynes (fallow Feb)
- Application D - N spread on soil surface (fallow Feb)
- Application E - N spread immediately before sowing and incorporated by sowing (IBS) with narrow point tynes (sowing)
- Application F - N spread immediately post sowing (PSPE) and
- Application G - N spread in-crop at GS30
EGA Gregory and Lancer variety comparison trial
- Application A - N spread on soil surface (fallow Feb)
- Application B - N spread immediately before sowing and incorporated by sowing (IBS) with narrow point tynes (sowing)
- Application C - N spread in-crop at ~GS30
Table 1. Site and application details 2016
|
Macalister |
Billa Billa |
Tulloona |
|
|
Previous crop |
Wheat |
Wheat |
Chickpea |
|
Available soil nitrogen sowing (kg N/ha) |
100 (0-120cm) |
118 (0-120cm) |
79 (0-120cm) |
|
Fallow (Nov/Dec) |
7/12/15 |
30/11/15 |
14/12/15 |
|
Timing and quantity of next rain |
25mm |
11mm |
17mm |
|
Fallow (Feb) |
29/2/16 |
15/2/16 |
23/2/16 |
|
Timing and quantity of next rain |
9mm |
31mm |
2mm |
|
Sowing |
22/7/16 |
10/5/16 |
14/6/16 |
|
Timing and quantity of next rain |
9mm |
14mm |
22mm |
|
In-crop |
26/9/16 |
11/7/16 |
8/8/16 |
|
Timing and quantity of next rain |
11mm |
10mm |
6mm |
|
In-crop rainfall (mm) |
178 |
242 |
280 |
NB Available soil nitrogen = total soil mineral N kg/ha (to soil depth) using bulk density of closest similar soil type It does NOT include any mineralisation credit. DAA= Days after application. Macalister planting was very delayed due to absence of planting moisture.
Table 2. Suntop timing and method trial: key treatments evaluated
|
Application |
Description |
kg N/ha |
|
A & C |
Fallow incorporated |
50, 100, 200 |
|
B & D |
Fallow spread |
100 |
|
E |
Spread and IBS |
50, 100, 200 |
|
F |
Spread PSPE |
100 |
|
G |
In-crop |
50, 100 |
NB the 200 kg N/ha rates were included in an attempt to over-fertilise.
Three split applications of a total of 100 kg N/ha were also evaluated. All had 50% of the N incorporated at either the fallow timings or the IBS application followed by 50% spread at GS30.
Table 3. EGA Gregory and Lancer variety comparison trial: key treatments evaluated
|
Application |
Description |
kg N/ha |
|
A |
Fallow spread |
50, 100, 200 |
|
B |
Spread and IBS |
50, 100, 200 |
|
C |
In-crop |
50, 100, 200 |
NB the 200 kg N/ha rates were included in an attempt to over-fertilise.
Two split applications of a total of 100 kg N/ha were evaluated. Both had 50% of the N applied at either the fallow timing or the IBS application, followed by 50% spread at GS30.
Rainfall for incorporation of spread urea (see table 1)
Conditions for natural incorporation (rainfall) of urea spread at the December fallow timing were considered good at Macalister and Tulloona (both >15mm within 2-6 days of application) but poorer at Billa Billa (~ 2 weeks until first rainfall). Following the February fallow timing, conditions were poor (~ 3-4 weeks until first rainfall) at both Macalister and Tulloona. Macalister and Billa Billa did not receive their first rainfall after sowing was until ~ 2-3 weeks. The Billa Billa site did not receive any rainfall after the GS30 application for 30 days.
Results
1. Were the sites actually nitrogen responsive?
When dealing with nitrogen response trials, the most basic consideration is whether the sites were actually N responsive. NDVI (Normalised Difference Vegetation Index) was used to provide an objective in-crop assessment of nitrogen response. A larger NDVI ratio indicates increased biomass and/or greener treatments. Figure 1 shows the Suntop NDVI results, at each site, from the factorial analysis of urea applied at three rates and three timings.
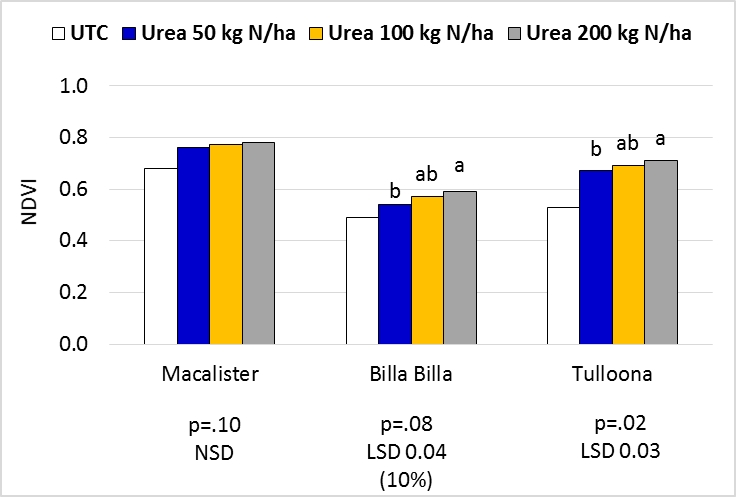
Figure 1. Suntop NDVI responses to nitrogen rate by trial site when assessed in mid-September to mid-October
UTC= untreated (no additional nitrogen applied). UTC not able to be included in factorial analysis but graphed for reference. Treatments that share the same letter within each site are not significantly different at P=0.05, except Billa Billa where p=.10.
- Although there was no significant N rate response at Macalister, all N treatments applied in the fallow or at planting provided a significant increase in NDVI compared to the UTC.
- NDVI results indicated all sites were responsive to added nitrogen.
Figure 2 shows the Suntop factorial analysis of yield when urea was applied and incorporated at three rates and timings.
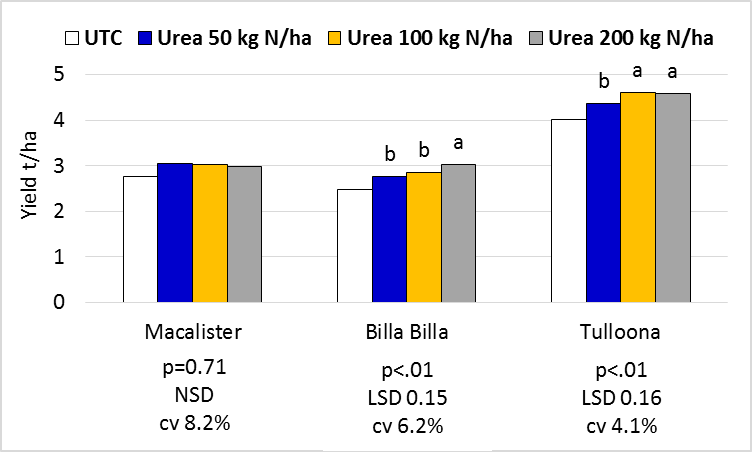
Figure 2. Suntop yield responses to nitrogen rate by trial site. All treatments applied and incorporated at three timings.
UTC= untreated (no additional nitrogen applied). UTC not able to be included in factorial analysis but graphed for reference. Treatments that share the same letter within each site are not significantly different at P=0.05.
- The 200 kg N/ha rate resulted in a significant yield increase compared to the 50 kg N/ha rate at both Billa Billa and Tulloona.
- The Macalister site was less responsive to applied nitrogen than Tulloona or Billa Billa
Figure 3 shows the Suntop factorial analysis of protein when urea was applied and incorporated at three rates and timings.
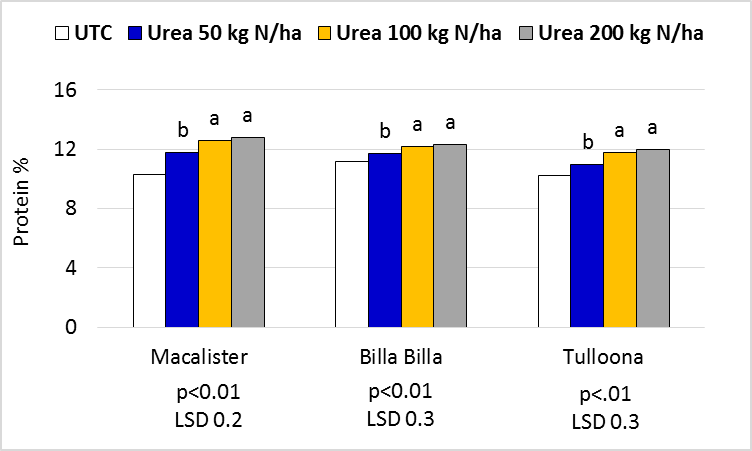
Figure 3. Suntop protein responses to nitrogen rate by trial site. All treatments applied and incorporated at three timings.
UTC= untreated (no additional nitrogen applied). UTC not able to be included in factorial analysis but graphed for reference. Treatments that share the same letter within each site are not significantly different at P=0.05.
- Both the 100 and 200 kg N/ha rates resulted in a significant increase in grain protein compared to the 50 kg N/ha rate - at all sites, in both sets of trials.
- Protein level appeared to plateau at 100 kg N/ha in these trials.
- Grain protein levels at all trial sites were highly responsive to nitrogen.
Overall: All sites were nitrogen responsive with grain protein the most responsive followed by NDVI and yield. This was similar to results from 2014 and 2015 trial activity.
2. What were the key comparisons of interest?
Two of the key areas of focus in these trials were:
a) Method of application
b) Timing of application
a) Method of application
The Suntop trial was designed to assess the method of application of urea. A rate of 100 kg N/ha was applied in December, February and at planting. At each timing, treatments were spread and incorporated on the same day with narrow point tynes or spread with no physically incorporation. In addition a split application treatment was included with 50 kg N/ha incorporated at each of the timings and then followed with 50 kg N/ha spread in-crop at GS30.
Figures 4 and 5 show the Suntop factorial analysis of yield and protein when urea was applied at 100 kg N/ha using the three different methods of application. 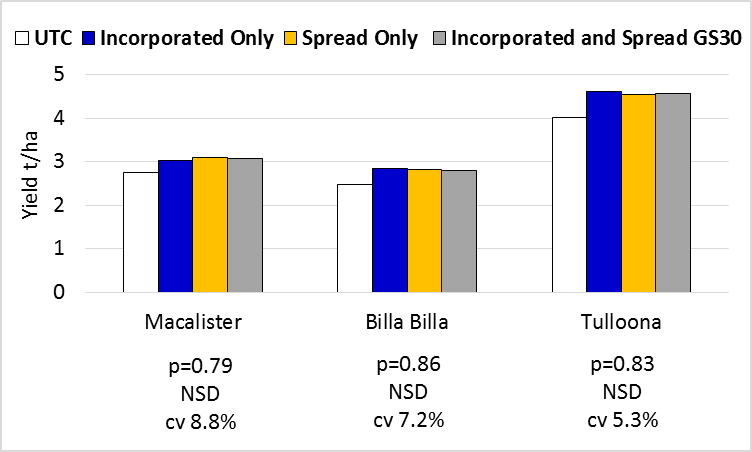
Figure 4. Suntop yield responses to 100kg N/ha by Method of Application. All treatments were applied at three timings (December, February and planting).
UTC= untreated (no additional nitrogen applied). UTC not able to be included in factorial analysis but graphed for reference. Treatments that share the same letter within each site are not significantly different at P=0.05
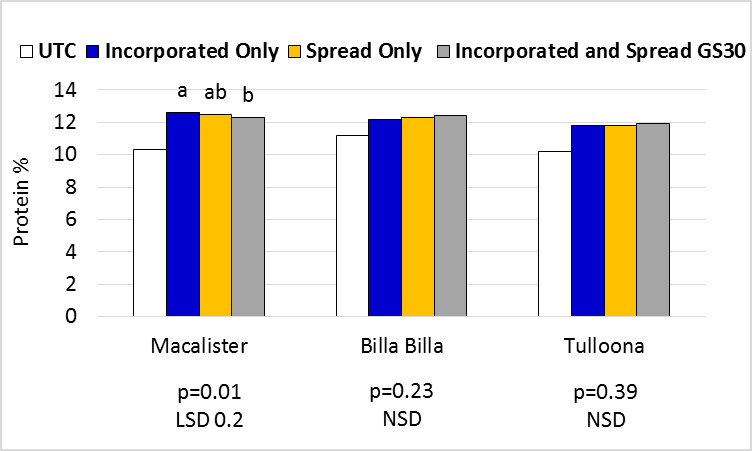
Figure 5. Suntop protein responses to 100kg N/ha by Method of Application. All treatments were applied at three timings (December, February and planting).
UTC= untreated (no additional nitrogen applied). UTC not able to be included in factorial analysis but graphed for reference. Treatments that share the same letter within each site are not significantly different at P=0.05
- There was no significant difference in Suntop yield or protein at any site between 100 kg N/ha applied and incorporated or spread only.
- The split application of nitrogen at Macalister resulted in significantly lower (-0.3%) protein levels than the same total rate of nitrogen incorporated at planting or during the fallow.
b) Timing of application
Figures 6 and 7 show the Suntop factorial analysis of yield and protein when urea was applied and incorporated at 50, 100 or 200 kg N/ha at all three timings.
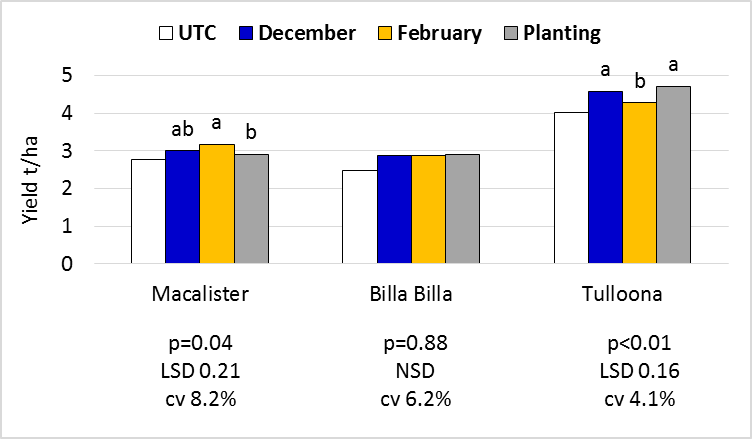
Figure 6. Suntop yield responses to Timing of Application. All treatments incorporated and applied at three rates.
UTC= untreated (no additional nitrogen applied). UTC not able to be included in factorial analysis but graphed for reference. Treatments that share the same letter within each site are not significantly different at P=0.05
Urea treatments applied at planting in the Macalister trial resulted in significantly lower yield than the same treatments applied in February. This was a site with a high cereal stubble load from 2015 which resulted in some planting difficulties. Crop establishment in treatments where an incorporation event occurred during the fallow were significantly higher (13-19%) than from planting treatments, in a late sown situation.
Urea applied and incorporated in February in the Tulloona trial resulted in significantly lower yield than the same treatments applied in December or at planting. However, where urea was spread without any incorporation in February, yields were equivalent to the same rate of urea applied at planting (see Figure 8).
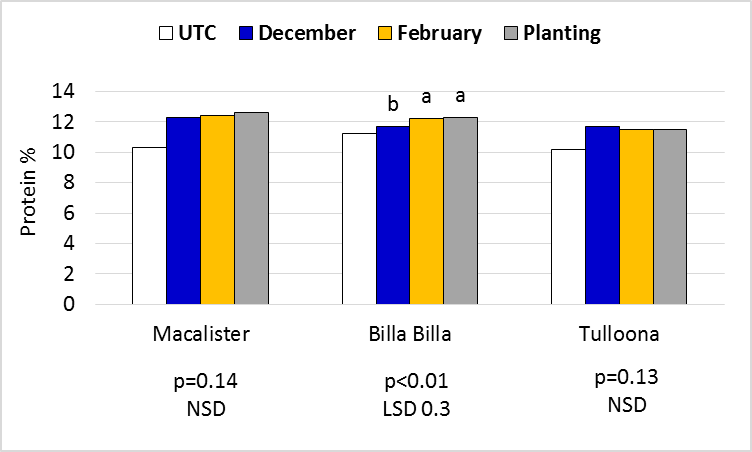
Figure 7. Suntop protein responses to timing of application. All treatments incorporated and applied at three rates.
UTC= untreated (no additional nitrogen applied). UTC not able to be included in factorial analysis but graphed for reference. Treatments that share the same letter within each site are not significantly different at P=0.05
Figures 8 and 9 show the EGA Gregory and Lancer factorial analysis of yield and protein when urea was applied at 50, 100 or 200 kg N/ha at all three timings.
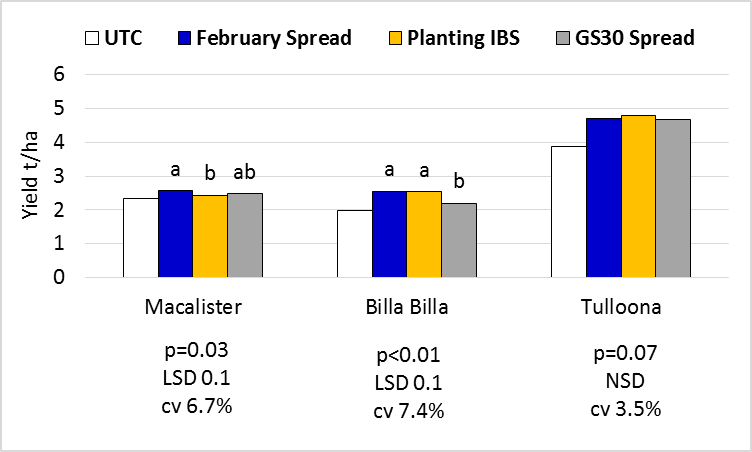
Figure 8. EGA Gregory and Lancer yield responses to timing of application. NB February and GS30 treatments spread only.
UTC= untreated (no additional nitrogen applied). UTC not able to be included in factorial analysis but graphed for reference. Treatments that share the same letter within each site are not significantly different at P=0.05
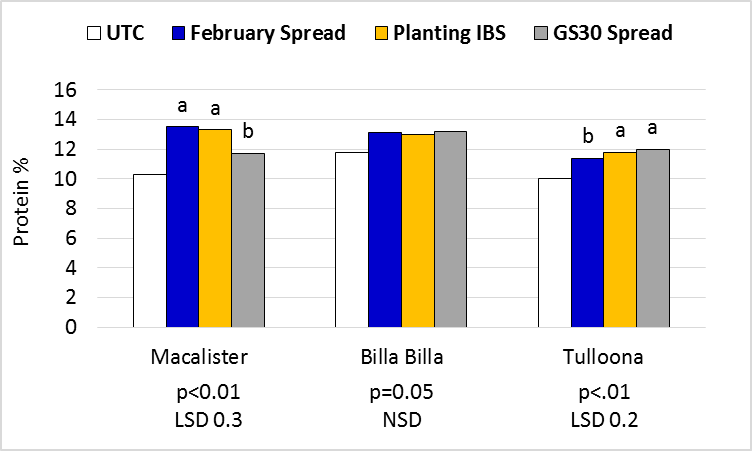
Figure 9. EGA Gregory and Lancer protein responses to timing of application. NB February and GS30 treatments spread only.
UTC= untreated (no additional nitrogen applied). UTC not able to be included in factorial analysis but graphed for reference. Treatments that share the same letter within each site are not significantly different at P=0.05
- Similar patterns of impact from timing of application were seen in both sets of trials at all sites
- The GS30 only application of urea at Billa Billa was significantly lower in yield than February or planting application. This site did not receive any rain for 30 days after the in-crop application.
- The impacts from timing of application of urea appeared minor compared to the rate of nitrogen applied. Similar results were seen in 2015 comparing February/March timing to a planting application.
Grain quality
Table 4. Suntop grain quality when all urea was incorporated and applied at three timings
|
Macalister |
|||||
|
N Rate |
Protein % |
Screening % |
Receival grade |
||
|
UTC |
10.3 |
7.2 |
GP |
||
|
50 kg N/ha |
11.8 |
b |
9.9 |
b |
AUH2 |
|
100 kg N/ha |
12.6 |
a |
10.9 |
a |
HPS1 |
|
200 kg N/ha |
12.8 |
a |
10.8 |
a |
HPS1 |
|
p<0.01, LSD 0.2 |
P=0.02, LSD 0.7 |
||||
|
Billa Billa |
|||||
|
N Rate |
Protein % |
Screening % |
Receival grade |
||
|
UTC |
11.2 |
3.3 |
APW |
||
|
50 kg N/ha |
11.7 |
b |
3.0 |
H2 |
|
|
100 kg N/ha |
12.2 |
a |
3.0 |
H2 |
|
|
200 kg N/ha |
12.3 |
a |
3.0 |
H2 |
|
|
p<0.01, LSD 0.3 |
P=0.98, NSD |
||||
|
Tulloona |
|||||
|
N Rate |
Protein % |
Screening % |
Receival grade |
||
|
UTC |
10.2 |
5.2 |
GP |
||
|
50 kg N/ha |
11.0 |
b |
5.5 |
GP |
|
|
100 kg N/ha |
11.8 |
a |
5.2 |
AUH2 |
|
|
200 kg N/ha |
12.0 |
a |
5.3 |
AUH2 |
|
|
p<0.01, LSD 0.3 |
P=0.72, NSD |
||||
UTC= untreated (no additional nitrogen applied). UTC not able to be included in factorial analysis but added for reference. Treatments that share the same letter within each site are not significantly different at P=0.05.
Tables 5-7 show the grain quality results when EGA Gregory and Lancer were compared with all applications at three timings.
Table 5. EGA Gregory and Lancer grain quality at Macalister
|
Macalister- EGA Gregory |
|||||
|
N Rate |
Protein % |
Screening % |
Receival grade |
||
|
UTC |
9.8 |
5.4 |
GP |
||
|
50 kg N/ha |
11.5 |
d |
7.4 |
bc |
AUH2 |
|
100 kg N/ha |
12.6 |
c |
9.8 |
a |
AUH2 |
|
200 kg N/ha |
12.6 |
c |
8.5 |
b |
AUH2 |
|
Macalister- Lancer |
|||||
|
N Rate |
Protein % |
Screening % |
Receival grade |
||
|
UTC |
10.8 |
3.0 |
APW |
||
|
50 kg N/ha |
12.5 |
c |
3.6 |
e |
H2 |
|
100 kg N/ha |
13.5 |
b |
5.2 |
d |
AUH2 |
|
200 kg N/ha |
14.3 |
a |
6.4 |
cd |
AUH2 |
|
P=0.02, LSD 0.4 |
P=0.06, LSD 1.2 (10% level) |
||||
Treatments incorporated at planting but spread only at February and in-crop.
UTC= untreated (no additional nitrogen applied). UTC not able to be included in factorial analysis but added for reference. Treatments that share the same letter are not significantly different at P=0.05.
Table 6. EGA Gregory and Lancer grain quality at Billa Billa
|
Billa Billa- EGA Gregory |
|||||
|
N Rate |
Protein % |
Screening % |
Receival grade |
||
|
UTC |
11.2 |
4.4 |
APW |
||
|
50 kg N/ha |
12.0 |
c |
4.2 |
a |
H2 |
|
100 kg N/ha |
12.4 |
b |
4.0 |
a |
H2 |
|
200 kg N/ha |
12.7 |
a |
4.0 |
a |
H2 |
|
p<0.01, LSD 0.2 |
|
||||
|
Billa Billa- Lancer |
|||||
|
N Rate |
Protein % |
Screening % |
Receival grade |
||
|
UTC |
12.4 |
3.0 |
|||
|
50 kg N/ha |
13.4 |
c |
2.4 |
c |
APH2 |
|
100 kg N/ha |
13.8 |
b |
2.8 |
b |
APH2 |
|
200 kg N/ha |
14.2 |
a |
3.2 |
b |
APH1 |
|
p<0.01, LSD 0.2 |
P=0.01, LSD 0.4 |
||||
Treatments incorporated at planting but spread only at February and in-crop.
UTC= untreated (no additional nitrogen applied). UTC not able to be included in factorial analysis but added for reference. Treatments that share the same letter for protein are not significantly different at P=0.05, within each variety. Treatments that share the same letter for screenings are not significantly different at P=0.05, across varieties.
Table 7. EGA Gregory and Lancer grain quality at Tulloona
|
Tulloona- EGA Gregory |
|||||
|
N Rate |
Protein % |
Screening % |
Receival grade |
||
|
UTC |
9.3 |
5.5 |
GP |
||
|
50 kg N/ha |
10.3 |
c |
4.7 |
ASW |
|
|
100 kg N/ha |
11.2 |
b |
4.5 |
APW |
|
|
200 kg N/ha |
12.1 |
a |
4.0 |
H2 |
|
|
p<0.01, LSD 0.2 |
|||||
|
Tulloona- Lancer |
|||||
|
N Rate |
Protein % |
Screening % |
Receival grade |
||
|
UTC |
10.7 |
5.4 |
GP |
||
|
50 kg N/ha |
11.3 |
c |
4.7 |
APW |
|
|
100 kg N/ha |
12.4 |
b |
4.7 |
H2 |
|
|
200 kg N/ha |
13.1 |
a |
4.4 |
APH2 |
|
|
p<0.01, LSD 0.2 |
P=0.11, NSD |
||||
Treatments incorporated at planting but spread only at February and in-crop.
UTC= untreated (no additional nitrogen applied). UTC not able to be included in factorial analysis but added for reference. Treatments that share the same letter for protein are not significantly different at P=0.05, within each variety.
- Lancer had significantly higher protein levels (plus ~1%) than EGA Gregory at all sites, despite also having significantly higher yields at two of the three sites
- Lancer had significantly lower screening levels than EGA Gregory at Macalister and Billa Billa.
Grain nitrogen recovery (data not presented)
Grain nitrogen recovery (yield t/ha x protein % x 1.75) was calculated to assess the efficiency of the applied urea. In addition, soil sampling at planting and harvest enabled a grain nitrogen recovery calculation for the UTC. This figure assessed the ‘efficiency’ of recovery of the available soil NO3 and NH4, as determined by soil tests to 120cm depth. Grain nitrogen recovery in the UTC was calculated by dividing the amount of grain nitrogen removed by the amount of soil N depleted eg at Macalister, 50 kg N/ha was removed in the grain from a depletion of 87 kg N/ha in soil N level (soil tests at planting indicated 100 kg N/ha with only 13 kg N/ha remaining at harvest).
In the Suntop trials:
- With all urea incorporated, the grain nitrogen recoveries averaged 23%, 18% and 10% from the 50, 100 and 200 kg N/ha application rates respectively. This is similar to results from 2014 and 2015.
- The grain nitrogen recoveries from soil derived N ranged from 57% at Macalister to 101% at Billa Billa and 128% at Tulloona (for values >100%, it is assumed that additional mineralisation occurred during the cropping period). This is similar to results from 2014 and 2015.
In the EGA Gregory and Lancer trials:
- Lancer had significantly higher grain nitrogen recoveries than EGA Gregory at all sites (range from 4-12 kg N/ha)
Economics
Net benefits were calculated using grain receival prices for delivery Moree in mid November 2016. There was a large spread of >$60/t between APH and APW classifications. Figure 10 shows the net benefit/loss across all sites for the Suntop trials where all urea was incorporated.
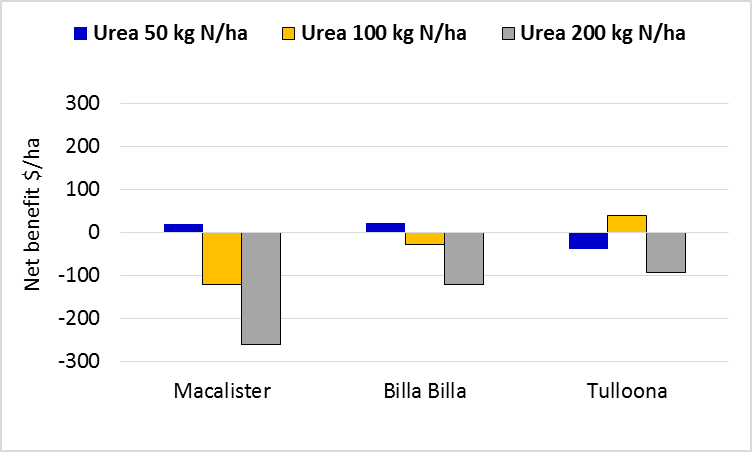
Figure 10. Suntop net benefit from applied nitrogen rate by trial site. All treatments applied and incorporated at three timings.
Assumptions: urea at $1.30/kg N ($600/t), spreading cost at planting $25/ha, fallow incorporation at $40/ha, grain prices delivered Moree mid Nov 2016: APH2 $237/t, H2 $202/t, AUH2 $194/t, APW $177/t, ASW $172/t, AGP $172/t and HPS $171/t
Figures 11 and 12 show the net benefit/loss across all sites for EGA Gregory and Lancer trials.
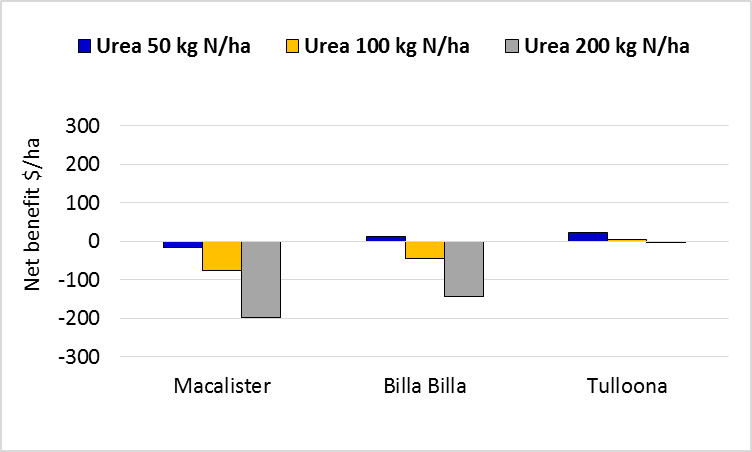
Figure 11. EGA Gregory net benefit from applied nitrogen rate by trial site. Treatments incorporated at planting but spread only at February and in-crop.
Assumptions: urea at $1.30/kg N ($600/t), spreading cost $25/ha, grain prices delivered Moree mid Nov 2016: APH2 $237/t, H2 $202/t, AUH2 $194/t, APW $177/t, ASW $172/t, AGP $172/t and HPS $171/t
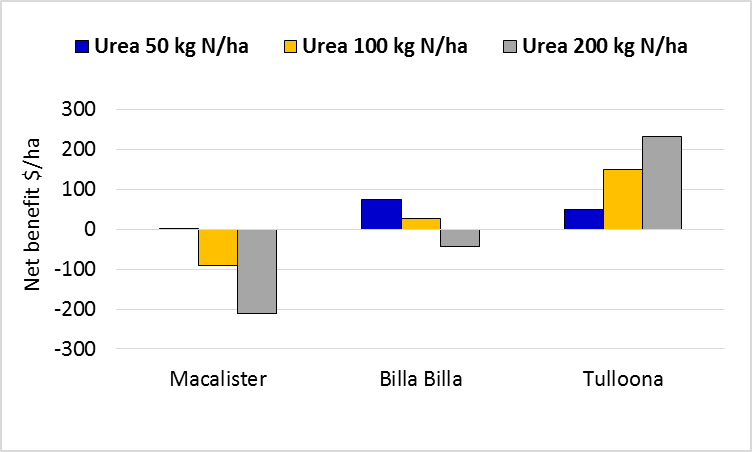
Figure 12. Lancer net benefit from applied nitrogen rate by trial site. Treatments incorporated at planting but spread only at February and in-crop.
Assumptions: urea at $1.30/kg N ($600/t), spreading cost $25/ha, grain prices delivered Moree mid Nov 2016: APH2 $237/t, H2 $202/t, AUH2 $194/t, APW $177/t, ASW $172/t, AGP $172/t and HPS $171/t
- At Macalister and Billa Billa (yields ~2.5-3.0t/ha), the 50 kg N/ha rate was the most economic rate evaluated although net benefits were $20/ha or less for five of the six comparisons.
- At Tulloona (yields >4t/ha), higher rates of N were economic, resulting from both increased yield and improved grain quality.
- Lancer provided the highest net benefits at both Billa Billa and Tulloona, with similar results from all varieties at the Macalister site.
Key points 2016
- Nitrogen rate was the key factor impacting yield in both series of trials.
- There was no significant impact on yield from method of application.
- There were significant differences from application timing but these appear to be associated with other agronomy impacts rather than N availability.
Conclusions
The results in 2016 are in line with earlier project activity.
- The rate of N applied has been the dominant factor affecting yield and grain quality in all twelve trials.
- The performance of urea spread and not mechanically incorporated has continued to provide equivalent results to urea incorporated at the same timings.
The February fallow application at Tulloona provided the longest interval in the trial series between spreading and first rainfall, with only 2mm at 25 days after application. This data continues to support the N volatilisation results achieved by Dr Graeme Schwenke and indicates that spreading of urea is less risky than previously considered in the northern region. These results are not suggesting there are no N losses. However the losses were small enough that we were unable to measure a difference in the following crop, despite significant N rate responses at each site.
Application of N in the fallow was compared to at planting in 2015 and 2016. The hypothesis tested was that application prior to planting may allow N to distribute more deeply in the profile and provide a ‘canopy management’ benefit compared to a shallow N concentration at planting. In the eight trials, there has been no consistent difference between application timings in crop yield or grain quality response.
A concern from these trials is that despite all sites recording significant grain protein increases with added N, actual net benefits have only been achieved from EGA Gregory in 4 of the 12 trials.
Acknowledgements
The research undertaken as part of this project is made possible by the significant contributions of growers through both trial cooperation and the support of the GRDC, the authors would like to thank them for their continued support.
NGA would particularly like to acknowledge the assistance from Jason Schelberg, George Picton and Peter Butler for 2016 trial activity together with Kalyx staff for trial planting, maintenance and harvest. In addition we would like to thank AGT and Pacific Seeds for product supply.
Contact details
Richard DanielNorthern Grower Alliance
Ph: 07 4639 5344
Email: richard.daniel@nga.org.au
GRDC Project Code: NGA00004,
Was this page helpful?
YOUR FEEDBACK