PLANT TISSUE TESTING - AN UNDER UTILISED TOOL FOR DIAGNOSING HIDDEN HUNGER IN CROPS
| Date: 17 Sep 2010
1) Are there nutrients limiting production?
Grain cropping is essentially about converting rainfall into a harvestable commodity as often and as efficiently as possible. To achieve this, constraints to water use by plants need to be reduced where possible. Adequate plant nutrition is one such constraint that can have a significant influence on the overall productivity of the system, and potentially whole farm profitability.
Hidden hunger in plants can restrict plant growth without visual symptoms of nutrient deficiency. Plant tissue analysis may allow this lost production potential as a result of inadequate plant nutrient uptake to be identified. Visual differences in crop growth of less than 20% are difficult for the human eye to detect, so applying remote or proximal sensor measurements may allow an improved plant growth assessment. Is it due to variety, nutrition, water, weeds, disease, insects, herbicides, nematodes or another factor? Plant tissue analysis could be part of the ‘ground truthing’ response – why are these areas different in productivity?
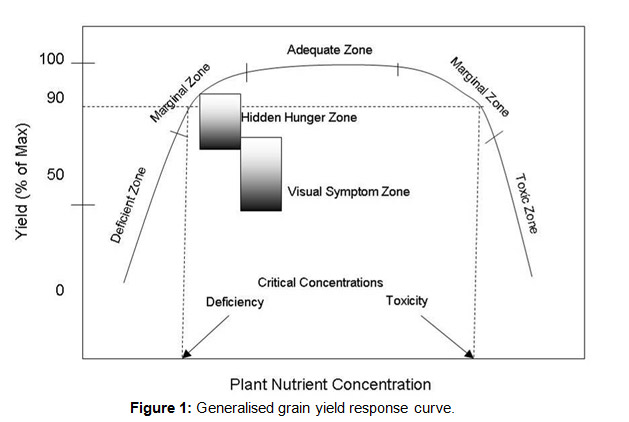
If plant growth (usually grain yield or whole plant biomass) is plotted against the concentration of the limiting nutrient, the relationship generally looks like Figure 1. Traditionally, the 90% of maximum yield value (dashed horizontal line) has been regarded as the ‘critical’ value for deficiency or toxicity level for the tissue nutrient concentration. Hidden hunger is a zone that extends from around the 90% concentration value to around 65-75% of the maximum yield. Below the hidden hunger zone, visual symptoms of that nutrient limitation may be observed. These aren’t likely to be distinct values, but will have some amount of overlap due to interactions with environment, genotype and management.
2) Why would nutrients limit crop growth?
Two reasons potentially stand out: a) depletion of soil fertility through nutrient removal from the paddock, and b) redistribution of nutrients within the soil altering accessibility to plants.
a) Soil nutrient depletion
Soils are dynamic physical, chemical and biological systems. Soil fertility has generally declined since converting native vegetation into grain and/or pasture production. Nutrient removal in grain, hay and livestock accounts for most of the fertility loss.
Negative farm gate nitrogen (N), phosphorus (P) and potassium (K) balances exist across the northern grains region with the largest nutrient exports occurred in higher yielding dryland areas such as the north-west slopes and plains of New South Wales, and south-east Queensland.
Some rules of thumb have been around related to how much nutrient you need to produce a ton of grain, the old 20-22 kg of N per ton of wheat. During 2006-2008, sorghum, wheat, barley and chickpea grain samples from commercial crops across the northern region were collected and analysed for their nutrient concentrations (GRDC project DAQ00084). Results suggest the P removal values in grain used for wheat (3.4 kg/t) and chickpea (3.7 kg/t) are about right.
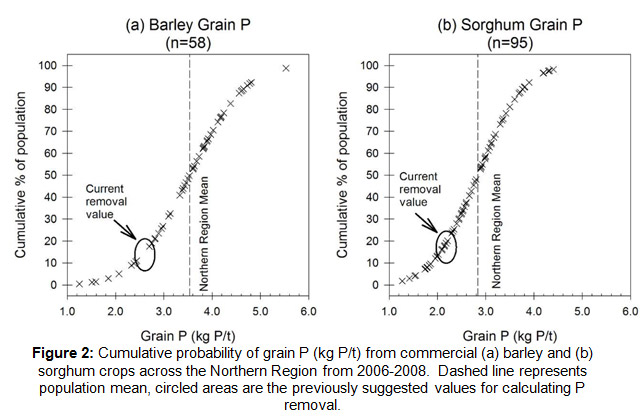
However, the study identified that the P removals in sorghum and barley had probably been underestimating removal by 0.5-0.8 kg/t (Fig. 2a, b) – that is soil P had been exported at a faster rate than we’d previously thought. The previously assumed concentrations (about 2.2 kg P/t) for calculating P removal (circled) fitted about 20% of the northern region barley and sorghum crops. The dashed line is the average (the 50% value) for the northern region: ≈ 3.5 kg P/t for barley and 2.85 kg P/t for sorghum.
There are few studies measuring grain mineral content with any frequency to determine nutrient removal and replacement values. Growers can have their own grain analysed to better understand the nutrient removal from their paddocks.
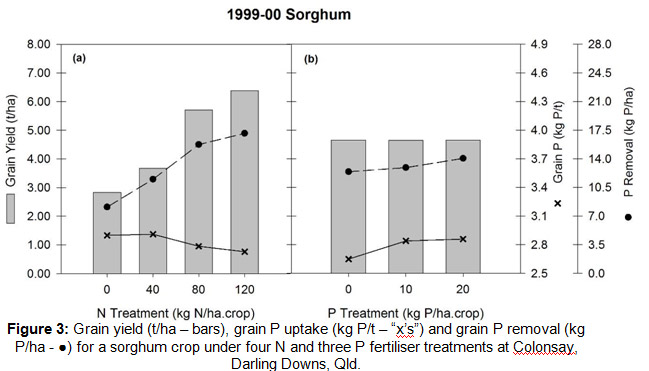
Whilst the grain nutrient concentration is important, grain yield drives nutrient removal — the more yield, the more removal. For example in Fig. 3 as grain yield (bars in the chart) increases with fertiliser N there is some dilution of grain P concentration (the “x’s”, Fig. 3a), but overall an increase in P removed (â—, Fig. 3a). Using P fertiliser can increase the grain P concentration (x, 3b), but it doesn’t nessecarilly change yield so it hasn’t increased removal. Applying 10 kg P/ha where N supply was adequate (say around the 80 kg N/ha rate) still was in deficit by 7 kg P/ha. If no P was applied, the deficit is 17 kg P.
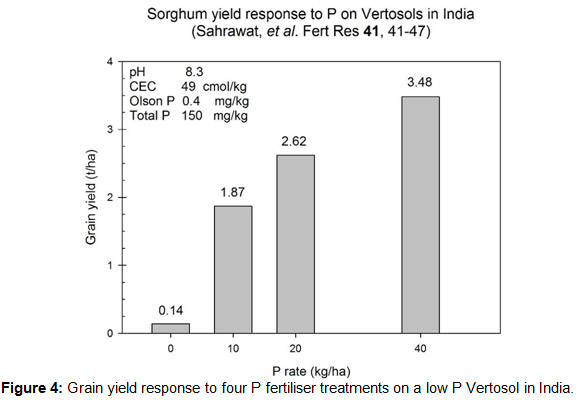
So why would long-term nutrient deficit/s be a problem? Worst case scenario may be seen in some Vertosols in India (Fig. 4) where after perhaps centuries of deficit you can’t produce a crop without higher P inputs. Yield at 10 kg P/ha is slightly over half what it is at 40 kg P/ha. While the northern region soils probably aren’t at that stage yet, with higher estimated nutrient removal rates (from both increasing yield and higher grain concentrations), the availability of nutrients in the soil for the plant may be altering.
b) Soil nutrient (re)distribution
By measuring the plant, we may be able to identify if the nutrient supplies have become marginal, or are now limiting crop yields. In soils, phosphorus and potassium pools can be segregated into ‘labile’ and ‘non-labile’ sources (Moody, Bell papers GRDC adviser update 2009). Labile pools are immediately plant available whilst the non-labile component can provide a resupply reservoir for the labile pool.
Over time and also with fertiliser use, differential enrichment and depletion of labile and non-labile P and K is occurring between the soil surface and subsurface layers. What we don’t know yet is the rate at which this non-labile depletion is occurring, and how much longer they can keep resupplying the labile sources. There are some new soil analysis methods being evaluated (e.g. the tetraphenyl-borate method “TBK” for potassium) but while this research continues, plant tissue test can be used now to assess crop nutrient status.
3) Grain analysis as an early indicator of looming problems?
Grain itself can also be considered for analysis, particularly as part of a nutrient budgeting program, and there are some diagnostic criteria reported for a few crops and nutrients.
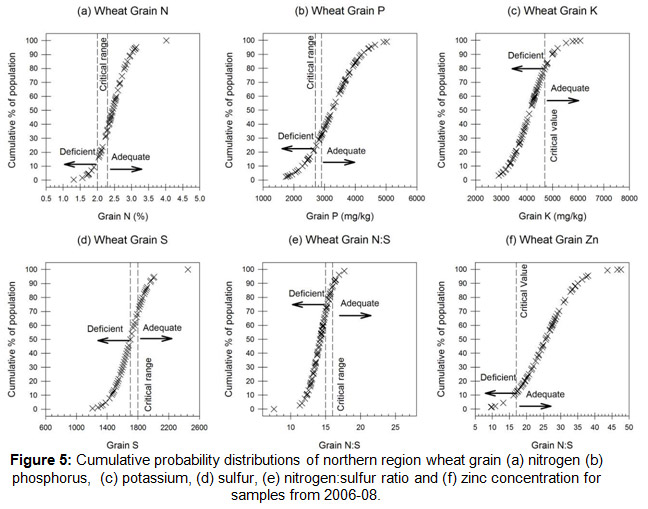
Using the wheat survey data from DAQ00084 crops generally had adequate N (Fig. 4a) and Zn (Fig. 4f), and mainly adequate P (Fig. 4b). The more crosses to the left of the critical range/value line the more of the population is likely to be deficient. In the northern region, the introduction in the mid-1990’s of co-granulated P and Zn fertilisers (the ‘Starter-Z’ type product) appears to have overcome low Zn supply or acquisition by crops.
Repeated Starter-Z applications will increase the soil DTPA-Zn levels, hence if the soil levels are likely to be above the suggested critical values (≈ 0.8 mg/kg) growers may opt to apply P only at sowing and collect a tissue test for confirmation of not only Zn adequacy, but Cu, Fe, Mn and B also. If the tissue test suggests low micro-nutrient supply growers can consider a foliar spray/s.
Of more concern are the indications of a potential sulfur (S) limitation with around 50% of the population below the critical grain S concentration (Fig. 4d) and 70% below the grain N:S ratio (Fig. 4e). Both grain S concentration and the N:S ratio are used in combination for S diagnosis to separate out N as the potential limitation.
Whilst the grain K data may suggest a problem, the critical value used is from a very limited number of studies so further investigation is required.
Growers and their advisers could undertake tissue testing and/or on-farm experimentation to confirm whether crop S nutrition is adequate with guidelines how to conduct on-farm research using precision agriculture in Bramley et al. (1999).
4) Making tissue testing work - Getting the right plant part at the right growth stage
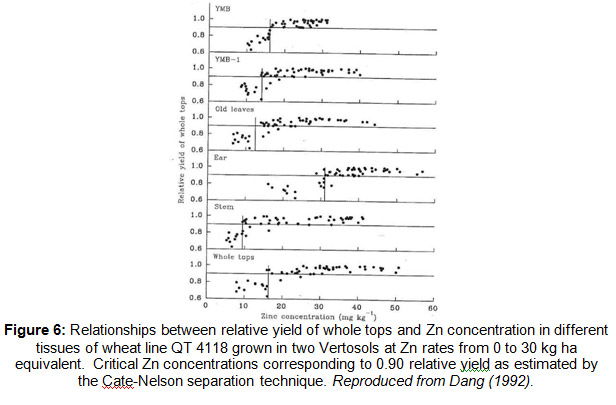
The successful use of plant tissue analysis depends on sampling the correct plant part at the appropriate growth stage as demonstrated by Dang (1992) (Fig. 6) for Zn. Similarly, the critical tissue P concentration changes with the age of wheat plants (Elliott et al. 1997a; 1997b).
For these reasons, critical tissue concentrations should be associated specifically with defined stages of plant growth or plant part rather than growth periods (i.e. days from sowing). If the lab you are using has a guide or instructions for sample collection – follow them as it’s these sorts of interpretative guidelines that the sample will be assessed against.
If the plant or crop you want to sample is outside of the ‘standard’ or defined growth stage for sampling, seek further advice as there are alternate techniques available.
Contact details
David Lester
Plant Science/ Agri-Science Queensland
Department of Employment, Economic Development and Innovation
Leslie Research Centre, PO Box 2282, Toowoomba Qld 4350
Phone 07 4639 8886
Fax 07 4639 8800
Email david.lester@deedi.qld.gov.au
References
- Bramley RGV, Cook S, Adams M, Corner R (1999) 'Designing your own on-farm experiments : how precision agriculture can help.' (Grains Research and Development Corporation: Kingston, A.C.T.)
- Dang YP (1992) Soil zinc reactions and the prediction of zinc responses by wheat grown in vertisols. Ph.D. thesis, University of Queensland.
- Elliott DE, Reuter DJ, Reddy GD, Abbott RJ (1997a) Phosphorus nutrition of spring wheat (Triticum aestivum L) .2. Distribution of phosphorus in glasshouse-grown wheat and the diagnosis of phosphorus deficiency by plant analysis. Australian Journal of Agricultural Research 48, 869-882.
- Elliott DE, Reuter DJ, Reddy GD, Abbott RJ (1997b) Phosphorus nutrition of spring wheat (Triticum aestivum L.). 4. Calibration of plant phosphorus test criteria from rain-fed field experiments. Australian Journal of Agricultural Research 48, 899-912.
- Sahrawat KL, Rego TJ, Burford JR, Rahman MH, Rao JK, Adam A (1995) Response of Sorghum to Fertilizer Phosphorus and Its Residual Value in a Vertisol. Fertilizer Research 41, 41-47.
GRDC Project Code: code DAQ00148,
Was this page helpful?
YOUR FEEDBACK