Summer fallow management
| Date: 09 Feb 2011
Summer fallow management
James Hunt, CSIRO
Introduction
Table 1. Mean (1889-2008) additional PAW at sowing, grain yield and water-use efficiency attributable to summer fallow rain for southern locations within the GRDC WUE initiative. Years with no return on investment are defined as years in which sufficient rain fell to germinate weeds (25 mm in a single event) but additional yield was less that 0.1 t/ha. Locations with summer fallow experiments are shaded in grey.
|
Sate
|
Location
|
Mean additional PAW at sowing (mm)
|
Mean additional grain yield (t ha-1)
|
Potential increase in WUE (%)
|
Years with no return on investment (%)
|
|
SA
|
Minnipa
|
31
|
0.7
|
17
|
3
|
|
SA
|
Cleve
|
21
|
0.8
|
31
|
8
|
|
SA
|
Cummins
|
8
|
0.2
|
5
|
18
|
|
SA
|
Morchard (heavy soil)
|
14
|
0.6
|
69
|
17
|
|
SA
|
Morchard (light soil)
|
35
|
1.0
|
29
|
0
|
|
SA
|
Hart
|
22
|
0.9
|
25
|
6
|
|
SA
|
Bordertown
|
33
|
0.8
|
15
|
8
|
|
SA
|
Waikerie
|
33
|
0.5
|
29
|
2
|
|
Vic.
|
Hopetoun (clay)
|
17
|
0.7
|
67
|
12
|
|
Vic.
|
Hopetoun (sand)
|
41
|
1.2
|
45
|
2
|
|
Vic.
|
Longerenong
|
24
|
1.0
|
46
|
6
|
|
Vic.
|
Yarrawonga
|
40
|
1.3
|
47
|
16
|
|
Vic.
|
Inverleigh
|
63
|
1.3
|
7
|
11
|
|
Tas.
|
Cressy
|
68
|
1.3
|
3
|
12
|
|
NSW
|
Urana
|
40
|
1.2
|
51
|
6
|
|
NSW
|
Temora
|
51
|
1.2
|
35
|
12
|
|
NSW
|
Cootamundra
|
84
|
1.7
|
27
|
12
|
|
NSW
|
Dubbo
|
78
|
2.1
|
93
|
8
|
|
NSW
|
Bogan Gate (loamy sand)
|
106
|
2.3
|
49
|
1
|
|
NSW
|
Bogan Gate (loamy clay)
|
68
|
2.1
|
148
|
3
|
|
NSW
|
Condobolin
|
57
|
1.7
|
173
|
1
|
|
NSW
|
Tottenham
|
60
|
2.2
|
210
|
2
|
|
Site
|
Year
|
Subsequent crop
|
Summer fallow rain (mm)
|
Additional PAW pre-sowing (mm)
|
Additional mineral N pre-sowing (kg/ha)
|
Additional yield (t/ha)
|
Return on investment in weed control ($ per $ invested)
|
|
BCG & CSIRO Curyo, Vic
|
2008
|
Wheat
|
76
|
24
|
14
|
1.3
|
$4.00
|
|
BCG & CSIRO Hopetoun, Vic (sand)
|
2009
|
Barley
|
90
|
11
|
-3
|
0.2
|
$0.20
|
|
BCG & CSIRO Hopetoun, Vic (clay)
|
2009
|
Barley
|
90
|
3
|
10
|
0.3
|
$0.80
|
|
BCG & CSIRO Hopetoun, Vic (sand)
|
2010
|
Canola
|
224
|
40
|
45
|
0.4
|
$3.76
|
|
BCG & CSIRO Hopetoun, Vic (clay)
|
2010
|
Canola
|
254
|
52
|
43
|
0.6
|
$6.16
|
|
UNFS & CSIRO Quorn, SA (heavy soil)
|
2009
|
Wheat
|
175
|
10
|
-
|
0.2
|
-$0.02
|
|
UNFS & CSIRO Port Germein, SA (light soil)
|
2009
|
Field pea
|
89
|
30
|
-
|
0.4
|
$1.09
|
|
NSW I&I & CWFS Waroo, NSW
|
2008
|
Wheat
|
358
|
56
|
25
|
1.0
|
$11.00
|
|
NSW I&I & CWFS Gunningbland, NSW
|
2010
|
Wheat
|
NA
|
53
|
57
|
1.7
|
$4.67
|
|
NSW I&I & CWFS Tottenham, NSW
|
2010
|
Wheat
|
NA
|
21
|
32
|
1.4
|
$3.67
|
Summer weed density does appear to be important – higher densities use more water (Figure 1) and nitrogen and subsequent crop yield is reduced proportionally (Figure 2).
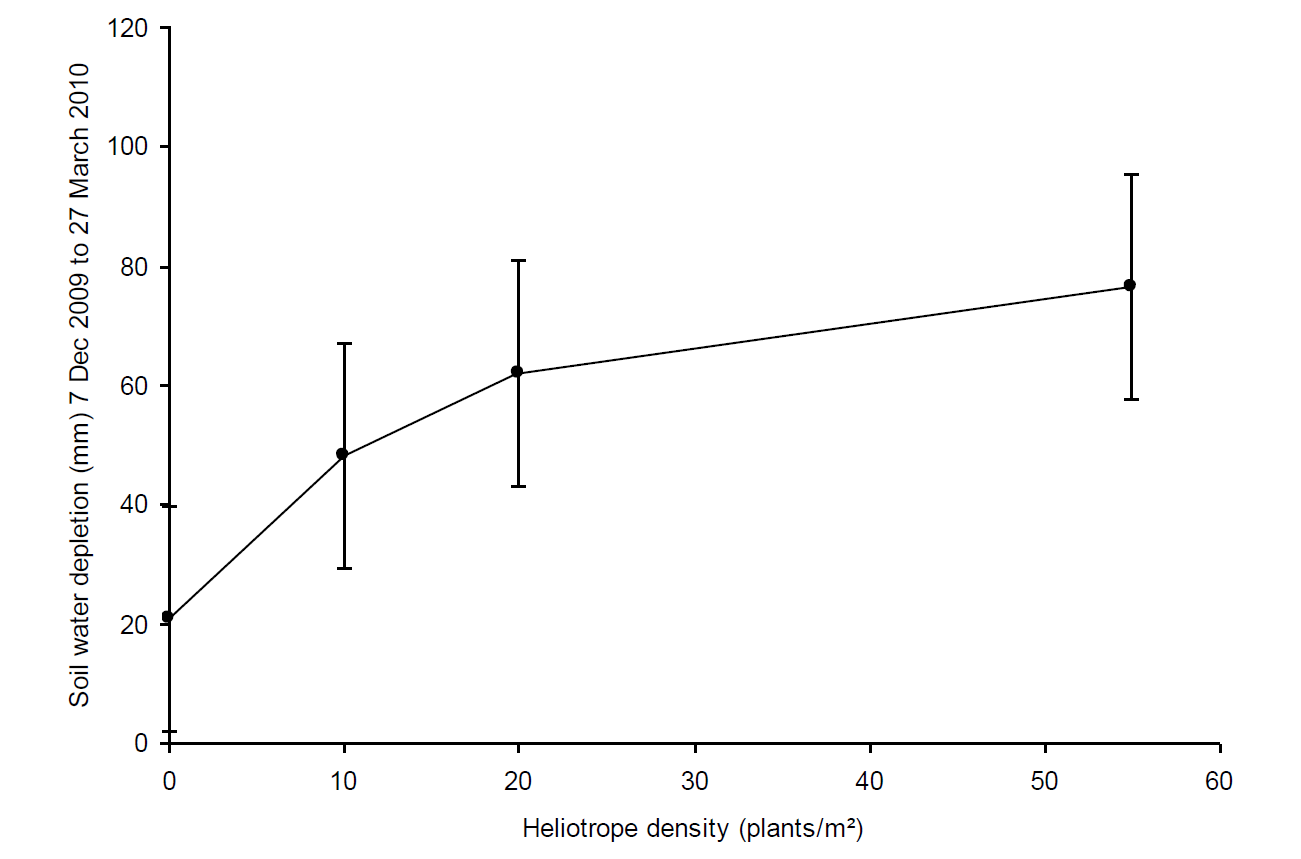
Figure 1. Soil water depletion by different densities of common heliotrope (Heliotropium europaeum) during the 2009/2010 summer fallow period at Jil Jil, Vic. November-April rain at the site was 151 mm, error bars are the LSD (p=0.05). Data courtesy BCG & Australian Weeds Research Council project AWRC08-86 ‘Summer weeds: counting the costs for a climate-changed future’.
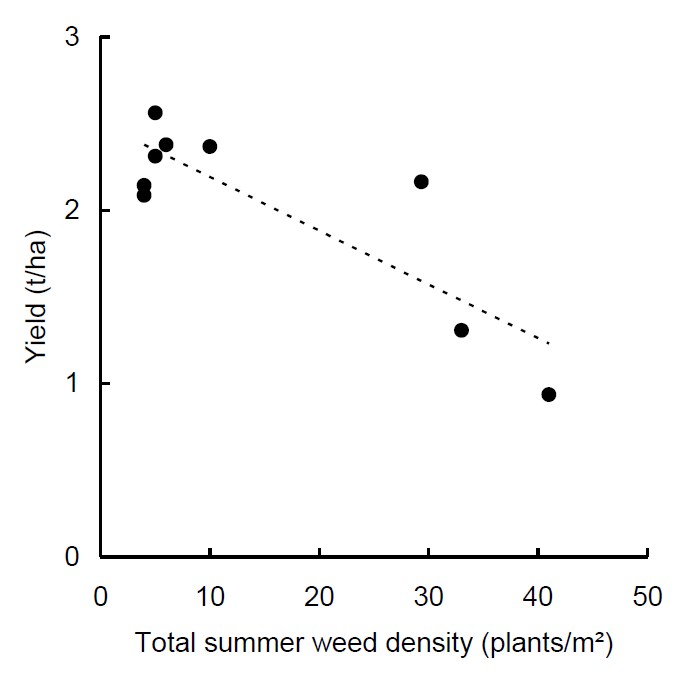
Figure 2. The relationship between summer weed density (common heliotrope and volunteer cereals) on 11 February 2008 and subsequent wheat grain yield in 2008 at Curyo, Vic (R²=0.72).
|
|
Plant available water (mm)
|
|||
|
Treatment
|
16 Dec 09
|
13 Jan 10
|
23 Feb 10
|
16 Mar 10
|
|
No graze (5.4 t/ha wheat stubble)
|
13
|
14
|
105a
|
155a
|
|
Stubble graze (0.8 t/ha wheat stubble)
|
14
|
14
|
77b
|
110b
|
|
Stubble & winter graze (0.8 t/ha wheat stubble)
|
15
|
16
|
66b
|
99b
|
|
LSD (P=0.05)
|
NS
|
NS
|
13
|
19
|
Note: Values that are followed by different superscript letters are significantly different at a 5% confidence level according to least significant difference (LSD) statistical analyses.
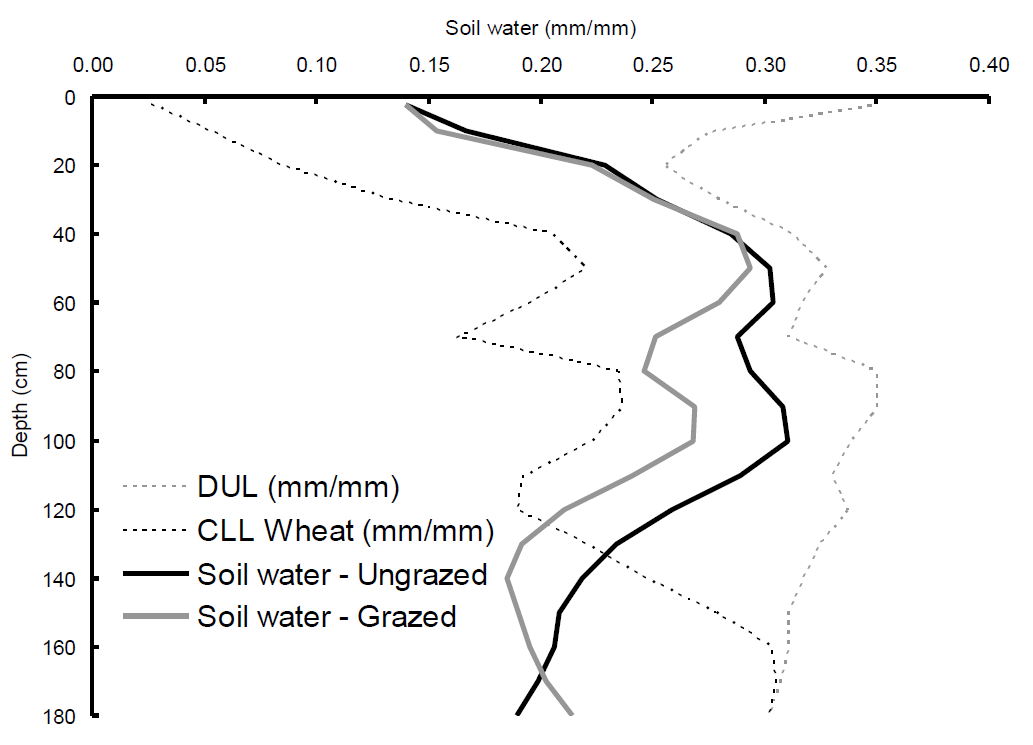
Figure 3. Volumetric soil water content down the soil profile at Temora of the No graze (black solid line) and combined grazed treatments (grey solid line) from Table 6 on 16 March 2010 relative to drained upper limit (grey dashed line) and crop lower limit for wheat (black dashed line). It clearly shows that the additional ~50 mm of water stored in the no-graze treatment is present at depth, implying the difference is due to improved infiltration rather than reduced evaporation.This is a caption underneath the image. Replace the image with a Sitecore media item.
Stubble can slow soil evaporation following rainfall events, but if conditions remain dry for an extended period total evaporation will be the same whether residues are retained or not (Figure 4). Also, unlike weeds which can extract water from depth, evaporative losses from fallows are restricted to the top 20-30 cm of soil and hence the total amounts of water involved tend to be small. It is for these reasons that increases in fallow efficiency and subsequent crop yield attributable to surface residues decreasing evaporation tend to be minor and only occur when large amounts of residue are present (e.g. header trails, added stubble) and rainfall patterns favourable. The presence of stubble on the soil surface during the growing season theoretically results in greater net reductions in evaporation as evaporative demand at that time is lower and rainfall events more frequent (Verburg et al. 2010). This effect can lead to improved establishment following marginal planting rain, and is also thought to be the reason for the observed increase in canola dry matter production at the clay site of the BCG and CSIRO trial site at Hopetoun in 2010 (Table 5).

|
Treatment
|
Canola dry matter at 70% flowered (t/ha)
|
|
4.0 t/ha barley stubble
|
3.9
|
|
No stubble
|
3.3
|
|
P-value
LSD (p=0.05)
|
0.01
0.5
|
In central-west NSW in 2009, wheat yield measured by NSW I&I at different positions across the header trail of the previous year’s crop showed a very clear relationship with trash distribution (Figure 5), but it is unclear by what mechanism (improved infiltration, reduced evaporation, faster emergence or all some or all of the above) this was brought about.

|
Treatment
|
Amount of water to ponding (mm)
|
Steady-state infiltration rate (mm/h)
|
|
No graze (5.4 t/ha wheat stubble)
|
19a
|
36a
|
|
Stubble graze (0.8 t/ha wheat stubble)
|
8ab
|
20b
|
|
Stubble & winter graze (0.8 t/ha wheat stubble)
|
6ab
|
16b
|
|
Un-grazed canola stubble (~1.6 t/ha)
|
5b
|
11b
|
|
LSD (P=0.05)
|
14
|
11
|
|
Treatment
|
Canola grain yield (t/ha)
|
PAW at canola maturity (mm)
|
|
No graze (5.4 t/ha wheat stubble)
|
4.1
|
116
|
|
Stubble graze (0.8 t/ha wheat stubble)
|
4.2
|
86
|
|
Stubble & winter graze (0.8 t/ha wheat stubble)
|
4.0
|
78
|
|
P-value
LSD (P=0.05)
|
0.62
NS
|
0.01
25
|
|
Treatment
|
Available water 4 May 2010 (mm)
|
Grain yield (t/ha)
|
|
Ungrazed (2.6 t/ha stubble)
|
127
|
4.6
|
|
Ungrazed stubble added (5.6 t/ha stubble)
|
135
|
4.7
|
|
Light graze (1.7 t/ha stubble)
|
123
|
4.7
|
|
Heavy graze (1.0 t/ha stubble)
|
122
|
4.4
|
|
LSD (P=0.05)
|
NS
|
0.2
|
|
Location
|
Emerald
|
Roma
|
Moree
|
Condobolin
|
Temora
|
Kerang
|
|
Baseline
|
2359
|
2909
|
3712
|
2815
|
4032
|
3066
|
|
Reduced root growth
|
||||||
|
Mild
|
+20
|
-2
|
-50
|
-22
|
-48
|
-68
|
|
Moderate
|
-6
|
46
|
-83
|
-28
|
-123
|
-266
|
|
Severe
|
-991
|
-222
|
-832
|
-384
|
-554
|
-1044
|
|
Reduced surface conductivity
|
||||||
|
Mild
|
-30
|
-57
|
-117
|
-43
|
-31
|
-15
|
|
Moderate
|
-77
|
-143
|
-250
|
-113
|
-91
|
-46
|
|
Severe
|
-172
|
-278
|
-479
|
-222
|
-167
|
-87
|
|
Combined effects
|
||||||
|
Mild
|
-15
|
-59
|
-141
|
-67
|
-77
|
-78
|
|
Moderate
|
-77
|
-89
|
-304
|
-145
|
-204
|
-306
|
|
Severe
|
-1018
|
-458
|
-1131
|
-555
|
-697
|
-1140
|
|
Tillage treatment
|
Change in soil water Nov 2009 - Apr 2010 (mm)
|
PAW at 6 Apr 2010 (mm)
|
Grain yield (t/ha)
|
|
Nil
|
26a
|
75a
|
6.7a
|
|
Renovate (knife points)
|
61b
|
116b
|
6.3a
|
|
Cultivate (sweeps)
|
47b
|
101ab
|
6.6a
|
|
LSD (P=0.05)
|
17
|
29
|
NS
|
This framework is being investigated to determine whether it can produce rules of thumb that allow growers and advisors to predict the likely outcomes of management on soil water storage as affected by evaporative demand, stubble cover, soil type and the sequence of rainfall. For instance if the maximum evaporative loss for a given soil type during a long dry spell is known, this essentially equates to the threshold amount of rainfall required before summer weed control will result in additional water storage.

- How important to final yield outcome is stored moisture at seeding in comparison to rainfall received during the growth stage of the crops? Many of the cropping areas have generally low but often erratic summer rainfall patterns and the ability to capture summer rain varies. Can seasonal uncertainty be reduced by reference to PAW at seeding? This will define the management focus necessary on summer fallow soil water capture.
- Can flexibility in management in response to the presence (or absence) of PAW actually achieve improved outcomes?


b) Moderate Modelled Plant Available Water at seeding (PAW 38-78 mm)


c) High Modelled Plant Available Water at seeding (PAW >78 mm)


|
Site and Soil Type
|
All Years
|
Years with above median PAW at seeding
|
Years with below median PAW at seeding
|
|
Quorn- clay loam
|
|
|
|
|
-Number of observations
|
110
|
55
|
55
|
|
-Median Yield (t/ha)
|
1.3
|
2.6
|
0.4
|
|
-No. of years < 0.7 t/ha
|
39 (35%)
|
6 (11%)
|
34 (62%)
|
|
-No. of Years > 2.0 t/ha
|
49 (45%)
|
37 (67%)
|
12 (22%)
|
- Varying crop area and type. Different crops have different response curves to the presence or absence of PAW at seeding. Complexity is added by considerations of local environment, rotations, management capabilities and constraints, longer term seasonal variability etc.
- Adjusting the ratio of crops and livestock within season. Implicit to altering livestock levels is the development of feed-lots or robust exit strategies for livestock enterprises in the face of adverse seasonal conditions.
- Changing varieties. The presence of PAW provides the option to use shorter growing season varieties to reduce the possible effects of spring heat shock on final yields. Implications to frost risk need to be assessed.
- Time of seeding. As with changing to a shorter growing season variety, earlier seeding may allow better utilisation of stored soil moisture. In any event, timeliness of seeding and crop establishment is critical. Closely related are methods to improve crop establishment under marginal (or deep) soil moisture levels in autumn. A novel approach to this is the use of long coleoptile wheat varieties to allow deeper planting (110mm) into stored soil moisture (Kirkegaard and Hunt, 2010).
- Changing crop nutrition and pest and disease management in response to PAW. Techniques are already well covered by conventional agronomy.
- Tactical fallow in the absence of PAW. Involves accepting the seasonal risk in the current year and trading this off against the seasonal uncertainly of the following year.
- Sowing of crops with multi-purpose uses e.g. hay, graze or grain. Allows PAW to be assessed at a more advanced stage of the season before locking in outputs
James Hunt
CSIRO Plant Industry PO Box 1600 Canberra ACT 2600
james.hunt@csiro.au
Was this page helpful?
YOUR FEEDBACK