Cereal disease update 2013
Author: Grant Hollaway and Mark McLean | Date: 06 Feb 2013
Grant Hollaway and Mark McLean
Department of Primary Industries, Horsham, Victoria
GRDC project code: DAV00111, DAV00123, DAS00099, DAS00116
Keywords: disease control, resistance, variety selection
Take home messages
- Sustainable management of most cereal diseases can be achieved by avoiding susceptible and very susceptible cultivars.
- An important part of disease control includes avoiding paddocks with high inoculum loads (either soil or stubble borne).
- Fungicides, if used in a timely manner, can provide effective management of diseases when inoculum pressure is high and/or susceptible cultivars are grown.
2012 in Review
The late start to the 2012 season was followed by average winter rains and finished with a very dry spring. The stubble borne diseases: yellow leaf spot in wheat and spot form of net blotch in barley were common in the winter months, especially when susceptible cultivars were sown into diseased stubble. Dry conditions during spring did not favour further development of these diseases and as a result they did not progress up the canopy. Recent findings suggested that yield loss may have still occurred in some cases (see section on yellow leaf spot).
There was limited carry over of the rusts on volunteers during summer and the dry spring slowed their development. Some stem rust was observed on volunteer wheat growing in the Mallee during August and there were some reports within YitpiA crops later in the season. Stripe rust was wide spread during October, but in general was only of significance in the most susceptible cultivars.
Crown rot caused widespread whiteheads in wheat crops during 2012, which was due to the dry finish. Further comments on crown rot management are provided below.
Avoid Susceptible and Very Susceptible Cultivars for Effective Disease Suppression
Sustainable control of most important diseases can be achieved by avoiding susceptible and very susceptible cultivars, which are often referred to as “suckers”. For most diseases, cultivars with intermediate resistance (i.e. ratings of MRMS and sometimes MS) are often sufficient to provide sustainable control, provided the more susceptible cultivars are also not being grown in that paddock, or in the case of wind borne diseases such as rust, in the district. Figure 1 illustrates stripe rust infection in a range of wheat cultivars during 2012, a less than ideal season for stripe rust development. Within this experiment (conducted by the Birchip Cropping Group) only the most susceptible cultivars had significant stripe rust infection.
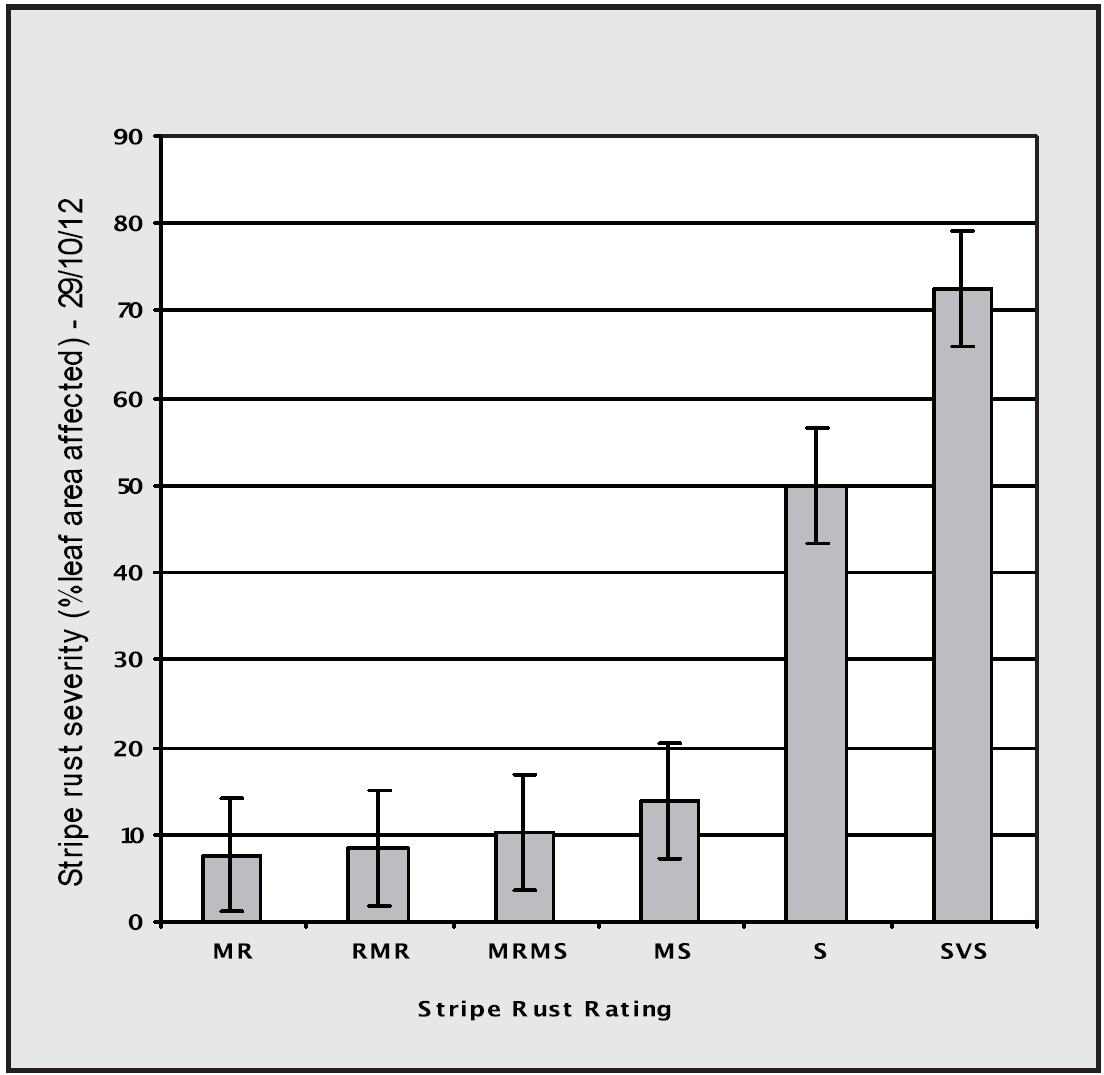
Figure 1. Relative stripe rust severity (% leaf area affected) on wheat cultivars with different resistance ratings at Horsham during 2012, a season not conducive to stripe rust development. The experiment was conducted by the Birchip Cropping Group.
Not only are susceptible cultivars more prone to yield loss, but because of their ability to produce large numbers of spores they:
- place increased disease pressure on other more intermediate cultivars in the district that otherwise would not need fungicide protection,
- increase the likelihood of resistance breakdown occurring, and
- increase the carry over of inoculum from one season to the next.
Avoiding susceptible and very susceptible cultivars is also desirable for the management of nematode diseases. As shown in Table 1, the number of root lesion nematodes (per gram of soil) following the most susceptible cultivars, such as MagentaA and Batavia (S), was four times more than following the intermediate cultivars such as MerindaA or CharaA (MRMS). Even though nematode numbers increased following the intermediate cultivars, the nematode population was still lower than following the susceptible cultivars and will therefore have a smaller effect on the yield of a subsequent crop.
Table 1. Relative effect of a range of cereal cultivars differing in susceptibility to the root lesion nematode Pratylenchus thornei on nematode numbers at Banyena during 2011. Nematode density at sowing was 14 / g soil
| Cultivar | Nematode density (nem/g soil) | Indicative rating |
|---|---|---|
| Yallaroi | 6 a* | MR |
| GS50a | 10 b | MR |
| Tamaroi | 13 bc | MR |
| Fallow | 19 c | MR |
|
Merinda |
36 d | MRMS |
|
Chara |
38 d | MRMS |
|
Catalina |
39 d | MRMS |
| Arapiles | 46 de | MRMS |
|
Hindmarsh |
66 ef | MRMS/MS |
|
Gairdner |
72 ef | MRMS/MS |
|
Axe |
81 f | MS |
| Gatcher | 94 fg | MS |
| Janz | 100 fgh | S |
|
Peake |
144 ghi | S |
| Machete | 150 ghi | S |
|
Yandanooka |
158 hi | S |
| Batavia | 169 j | S |
|
Magenta |
173 j | S |
* Means followed by the same letter are not significantly different (p=0.05).
To help in the selection of the most appropriate cultivars to manage disease the DPI publishes the Victorian Cereal Disease Guide annually. This guide provides disease ratings for all the important diseases. Current disease ratings are also available as an APP for smart phones from Google Play and iTunes by searching on “DPI Crop Disease”.
Rust Update
The dry spring during 2012 limited rust development in cereal crops. However, stripe rust was still widespread and warranted management, especially in susceptible cultivars.
Recent dry conditions during December (2012) and January (2013) in Victoria have limited the build up and carry over of rust incoulum. Should the summer remain dry there will be reduced rust pressure on 2013 cereal crops. In spite of this, it is still important to have a plan to manage rust, especially in the more susceptible cultivars.
There were no new changes in rust pathotypes of significance to Victorian growers reported during 2012.
Crown Rot Research Update
The conditions during 2012 were ideal for crown rot. Crown rot causes scattered white heads to develop within bread and durum wheat crops and has become an important disease in Victoria during the last 15 years. Stubble retention and more intensive cereal rotations have favoured this stubble borne disease. Crown rot prefers seasons with a wet start, which allows the fungus to infect the young plant, followed by a dry spring that favours the growth of the fungus within the plant and whitehead formation.
A survey of 900 Victorian wheat crops during 1997 to 2009 found that this disease was on average reducing Victorian wheat yields by 2 to 3% per annum (Hollaway and Exell 2010). Within ~ 10 to 15% of wheat crops yield loss was greater than 5% during this period, with some crops suffering yield losses greater than 20%. The severity of crown rot was greatest in those seasons with a dry spring.
Testing paddocks for crown rot
The key to the management of crown rot is to identify paddocks at risk of yield loss. Using 26 data sets collected from Victoria and South Australia, during the years 2005 to 2010, DPIVic and SARDI have shown that crown rot levels determined prior to sowing, using the PredictaB soil test, provided a reliable indicator of crown rot risk and potential yield loss in a following crop (Figure 2) (Hollaway et al. 2013).
These studies clearly demonstrated the role of seasonal rainfall in crown rot development. The yield loss from crown rot was greatest in seasons with below average combined September and October rainfall and negligible in seasons with above average rainfall at this time (Figure 2).
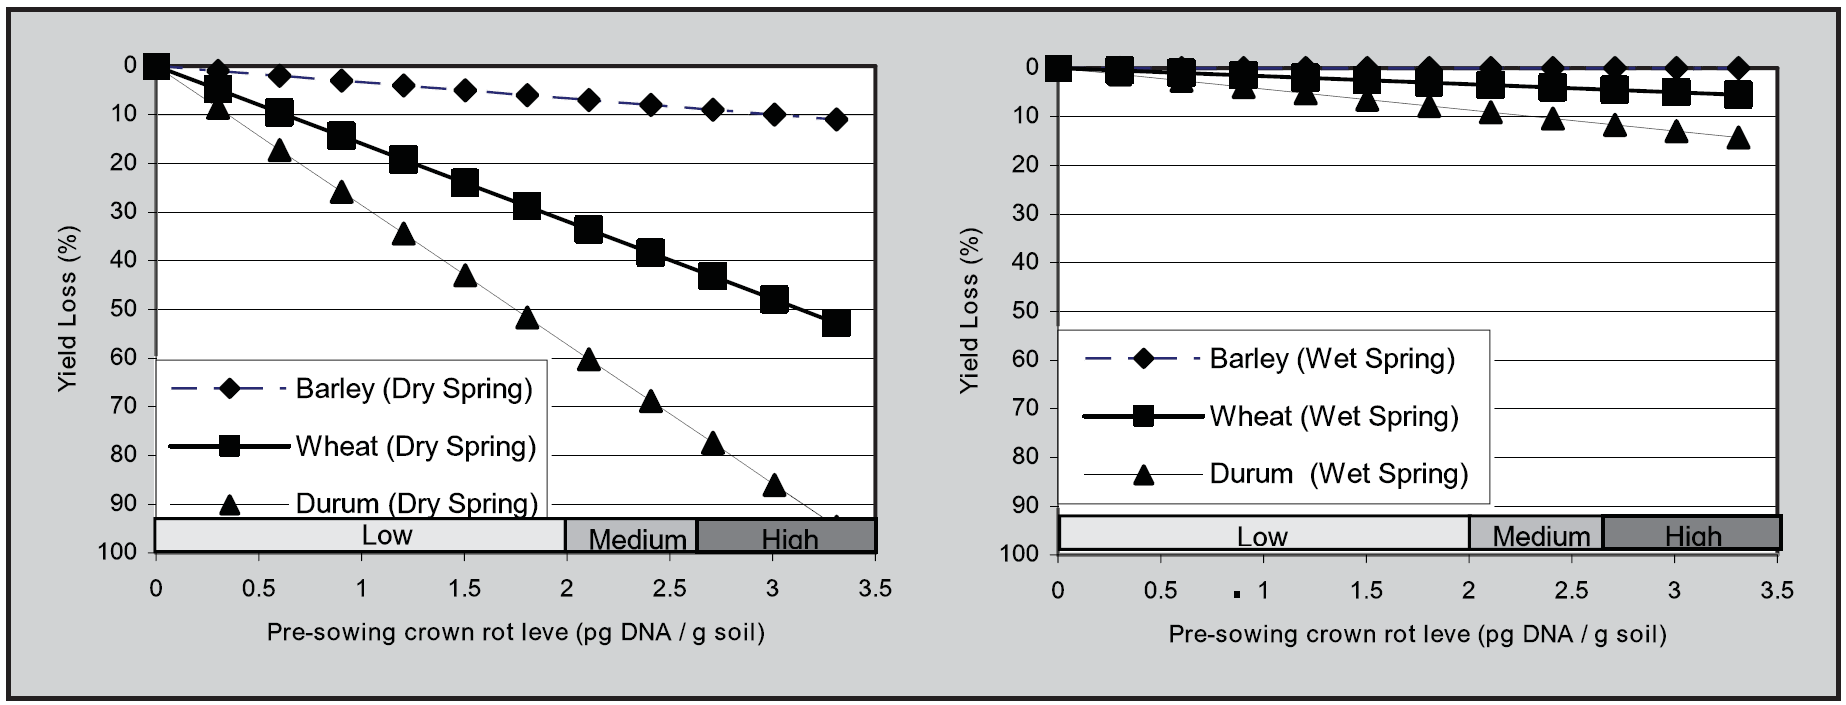
Figure 2. A graphical representation of the relative effect of increasing pre-sowing crown rot inoculum levels, as determined using PredictaB, on grain yield loss (%) in three cereals in seasons with below average combined September and October rainfall (left) and above average rainfall for the same period (right) using 26 data sets collected in Victoria and South Australia during the years 2005 to 2010 (Hollaway et al. 2013).
Crop choice
As shown in Figure 2, cereal types (barley, bread wheat and durum wheat) vary in the extent of yield loss they suffer in the presence of a given level of crown rot inoculum at sowing. In paddocks with a medium to high crown rot risk it is best to avoid durum wheat and grow barley in preference to bread wheat. Note however, that even though yield loss is reduced by growing barley, this crop is a good host and can increase inoculum levels (Figure 3).
In paddocks with medium to high crown rot levels, ideally a non-host (i.e. a non-cereal crop) such as pulses or oilseeds should be grown to reduce inoculum levels. Studies by DPIVic and SARDI, during the years 2003 to 2008 in Victoria and South Australia showed that rotation to non-host crops reduces crown rot incoulum levels (Figure 3) and therefore the crown rot risk to a subsequent cereal crop (Evans et al. 2010). In general, however, a two year grass free break may be necessary to reduce crown rot levels to a low level. The length of break required is influenced by the time for stubble residues to decompose.
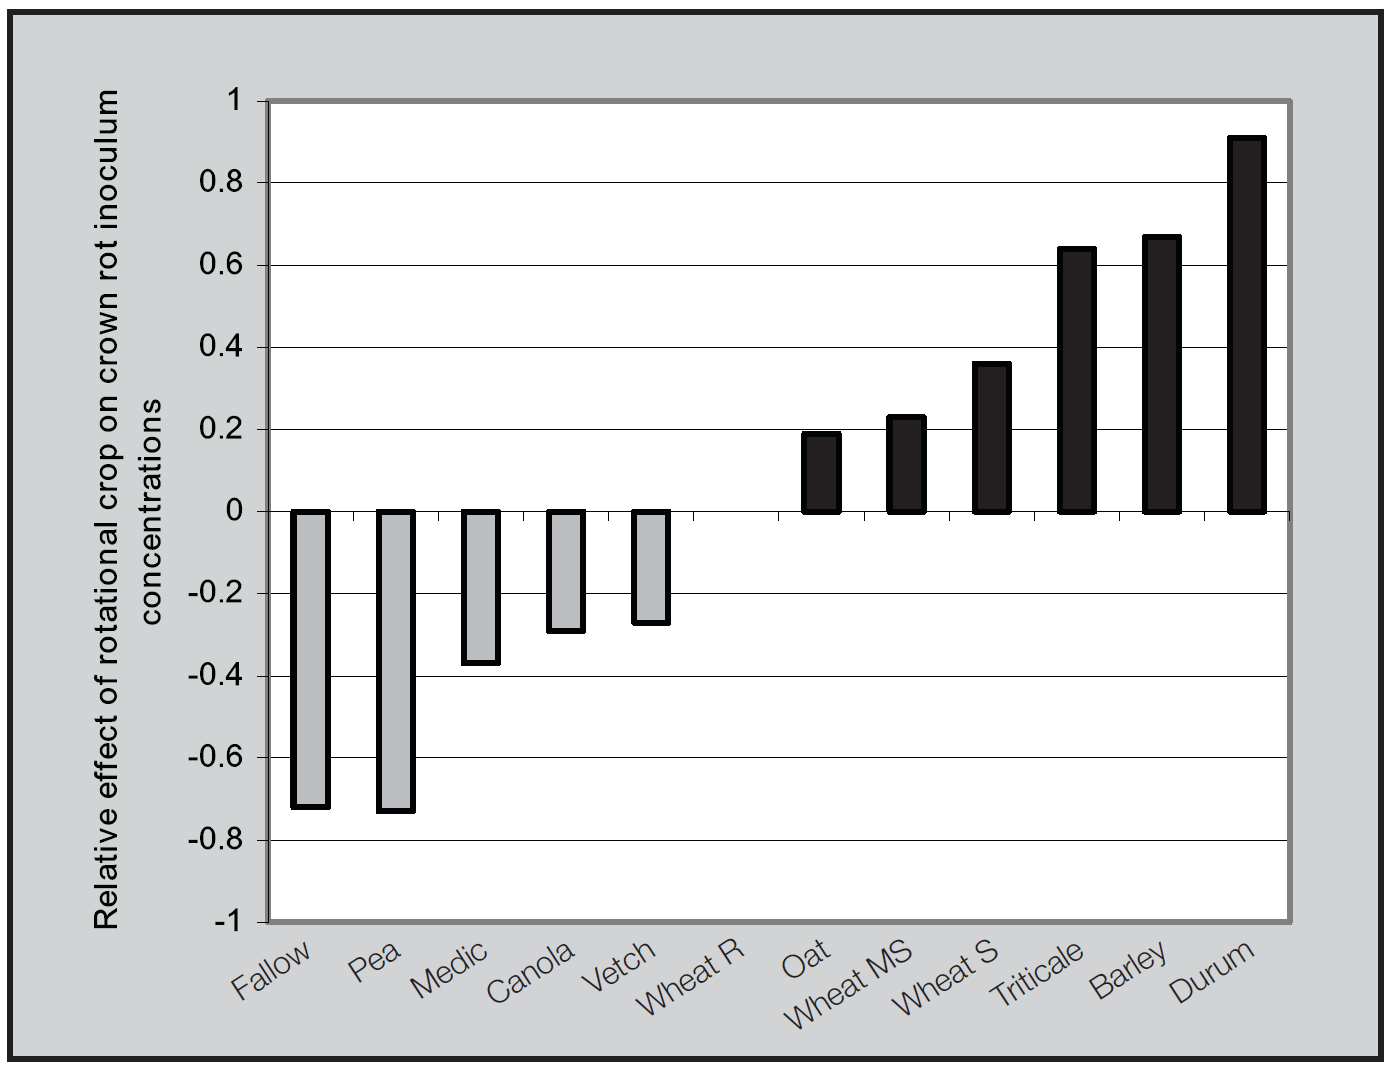
Figure 3. Relative effects of rotational crops (cereal and non cereals) on crown rot inoculum levels in south-eastern Australia: 2003 – 2008 (Evans et al. 2010).
Crown rot control: summary
A crown rot management strategy includes:
- testing paddocks prior to sowing to identify risk levels,
- if a paddock has a medium level avoid durum wheat, and consider barley, and
- if a paddock has a high crown rot level, rotate to a grass free break crop for two years.
Nematode Research Update
DPIVic and SARDI, with GRDC’s support, have been conducting new research into root lesion and cereal cyst nematodes to improve understanding of the relative importance and control of these nematodes in a modern farming system.
A field study, conducted during 2011, showed that yield loss caused by different pre-sowing densities of the root lesion nematode, Pratylenchus thornei, (measured by using PredictaB), is determined by the relative tolerance of the cultivar (Figure 4). A medium density (40 nematode / g soil) of P. thornei present at sowing did not affect the yield of the tolerant cultivars HindmarshA or CatalinaA, but reduced the grain yield of the wheat cultivars CharaA, YitpiA and DerrimutA by 6, 8 and 10% respectively. Previous studies have shown that these losses would have been greater with later sowing. In the presence of medium to high nematode numbers yield loss can be minimised by avoiding late sowing and by selecting the most tolerant suitable cultivar.
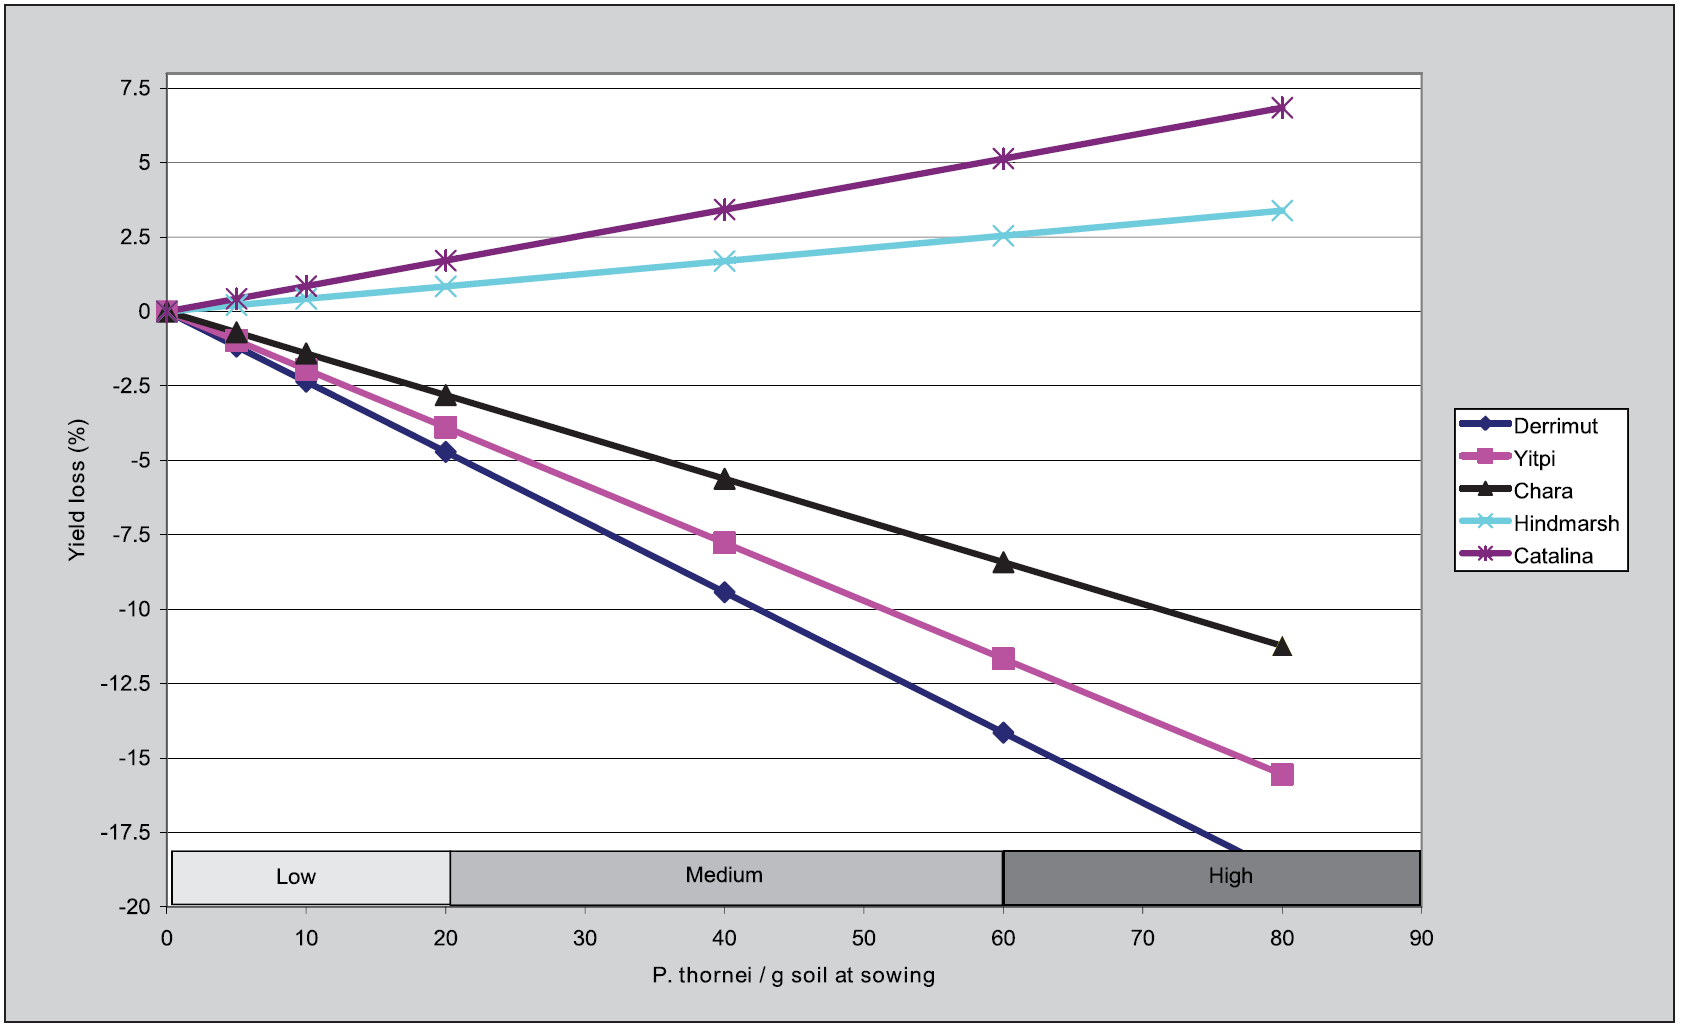
Figure 4. Relationship between pre-sowing inoculum density of Pratylenchus thornei and the grain yield in five cereal cultivars at Banyena during 2011. Note that the slopes for the Hindmarsh and Catalina lines were not statistically different from zero.
Since yield losses due to root lesion nematodes are generally <10%, and don’t cause obvious symptoms, they often go un-noticed. The best way to identify paddocks at risk from nematode damage is to use a PredictaB soil test prior to sowing. Should medium to high nematode densities be identified then resistant and/or tolerant crops and cultivars can be selected. As shown in Table 1, cereals range in their resistance/susceptibility to these nematodes. For information on the resistance/susceptibility of current cereal cultivars to root lesion nematodes consult the current cereal disease guide.
Yellow Leaf Spot
Yellow leaf spot, is a stubble borne foliar disease of wheat, common when susceptible wheat cultivars are sown into infected wheat stubbles. Even though this disease is widespread, it has generally been regarded as causing limited yield loss. However, recent data collected by the Birchip Cropping Group and DPIVic suggests that in the presence of yellow leaf spot inoculum the more resistant cultivars (MR and MRMS), out yielded susceptible cultivars (S and SVS) by ~ 10% and was consistent with DPI data collected previously. This indicates that cultivar selection in a wheat on wheat situation is important to minimise losses associated with this disease. Fungicide control of this disease is often difficult.
To minimise losses associated with yellow leaf spot do not sow wheat into paddocks with one or two year old wheat stubble present. If, however, wheat is to be grown where infected stubble is present chose one of the several more resistant (i.e. MR, or MRMS) cultivars that are available. Avoiding the more susceptible cultivars (e.g. those rated S and SVS) is particularly important when infected wheat stubble is present.
Barley Scald Control
Scald is an aggressive foliar disease of barley that requires the implementation of an integrated management approach. This can include some or all of the following methods:
- not sowing susceptible barley cultivars into infected stubble from the previous two years,
- selecting the least scald susceptible cultivars possible,
- using seed or fertiliser applied fungicides and/or foliar fungicides to limit scald development in susceptible cultivars, and
- avoiding early sowing.
Scald yield loss and cultivar selection
Studies by the DPI during 2010 to 2012 have shown that scald can cause significant grain and economic loss when susceptible and very susceptible barley cultivars are grown in the presence of infected stubble (Table 2). Up-to 1.2 t/ha was lost and income reduced by $228/ha in the worst case. These experiments also demonstrated that growing a moderately susceptible cultivar greatly reduced potential losses, but this varied between locations, depending on local conditions. Due to the potential for scald to spread rapidly and cause significant yield loss it is important to monitor all barley crops during the season with a view to applying foliar fungicides in a timely manner where necessary.
Table 2. Grain yield, disease severity (% Leaf Area Affected) and economic loss of 5 barley cultivars in the presence and absence of scald in the Wimmera during 2010-12
| Year | Location | Cultivar | Grain Yield (t/ha) | |||
|---|---|---|---|---|---|---|
| DiseasedA (%LAA in brackets) | FungicideB (%LAA <1) | % diff | EconomicsC ($/ha) |
|||
| 2010 | Lubeck | Yagan (VS) | 3.2 (58) | 3.9 | -18 | -$133 |
| 2011 | Horsham | Yagan | 4.6 (10) | 5.8 | -21 | -$228 |
| 2012 | Horsham | Yagan | 3.6 (55) | 4.2 | -14 | -$114 |
| 2012 | Wonwondah | Yagan | 3.9 (59) | 4.7 | -17 | -$152 |
| 2012 | Horsham | Barque (VS) | 4.3 (11) | 4.5 | -4 | -$38 |
| 2012 | Wonwondah | Barque | 4.2 (14) | 4.5 | -7 | -$57 |
| 2012 | Horsham |
Skipper |
4.5 (7) | 4.6 | -2 | -$19 |
| 2012 | Wonwondah |
Skipper |
4.7 (7) | 5.2 | -10 | -$95 |
| 2012 | Horsham |
Flagship |
4.1 (4) | 4.1 | 0 | 0 |
| 2012 | Wonwondah |
Flagship |
4.3 (2) | 4.4 | -2 | -$19 |
| 2012 | Horsham |
Hindmarsh |
5.2 (1) | 5.1 | 0 | 0 |
| 2012 | Wonwondah |
Hindmarsh |
5.1 (1) | 5.1 | 0 | 0 |
ADiseased treated plots were treated with stubble naturally infected with scald
BFungicide plots were treated with Tilt® (250 g/L propiconazole) applied @ 250ml/ha during 2010 and Prosaro® (210 g/L prothioconazole 210 g/L tebuconazole) applied @ 300ml/ha during 2011-12
CEconomics based on the difference in grain yield between the diseased and fungicide treatment multiplied by a barley grain price of $190/t
D# note that Hindmarsh![]() is rated SVS to alternate pathotypes present in Victoria.
is rated SVS to alternate pathotypes present in Victoria.
Scald management using fungicides
Seed, fertiliser and foliar applied fungicides can be used as part of an integrated approach to manage scald in barley where there is a risk of yield loss. Three field experiments were conducted in the Wimmera during 2011-12. The treatments consisted of seed, fertiliser and foliar applied fungicides on a very susceptible barley cultivar (Table 3). The best suppression of scald was consistently achieved following the application of a combination of fertiliser and foliar fungicides or following two foliar applications at growth stage Z31 and Z39 (Table 3). A single application of foliar fungicide at either Z31 or Z39 was partially effective at suppressing scald but there was still yield and economic loss. The seed and fertiliser applied fungicides treatments, when used without a foliar fungicide application were the least effective treatments, indicating that follow up applications of foliar fungicide may be necessary where very susceptible cultivars are grown in paddocks with high disease pressure.
Scald severity is highly influenced by climatic conditions and is favoured by wet weather. As a result, there will be a greater need to monitor and apply foliar fungicides in wetter seasons. Scald is also often more severe in early sown than later sown crops.
The application of foliar fungicide at Z31 and Z39 will also provide suppression of the spot form of net blotch, which will be useful in further reducing grain yield and quality loss in some barley cultivars. See management of spot form of net blotch using fungicides section for more details.
Table 3. Effect of application of different seed, fertiliser and foliar fungicide treatments on scald severity (% leaf area affected) and grain yield in barley var. Yagan (VS) at Horsham (Hsm) during 2011-12 and Wonwondah (Won) during 2012
| Treatment A |
Scald severity (%LAA) |
Grain yield (t/ha) |
|||||
|---|---|---|---|---|---|---|---|
| HsmB 2011 | Hsm 2012 | Won 2012 | HsmB 2011 | Hsm 2012 | Won 2012 | ||
| Nil | 10a | 55a | 59a | 4.6a | 3.6a | 3.9a | |
| Baytan® | -C | 31b | 25b | - | 3.7ab | 4.3b | |
| Impact® | 0b | 18c | 24b | 5.0ab | 3.9abc | 4.3b | |
| Prosaro® @ Z31 | 0b | 8e | 6c | 4.9ab | 4.1bc | 4.4bd | |
| Prosaro® @ Z39 | 0b | 8e | 4c | 5.3bc | 3.8bc | 4.4bd | |
| Prosaro @ Z31 and Z39 | 0b | 0d | 0c | 5.5c | 4.1bc | 4.9c | |
| Impact® and Prosaro® @ Z31 | 0b | 4de | 1c | 5.5c | 4.1bc | 4.6de | |
| Impact® and Prosaro® @ Z39 | 0b | 0d | 1c | 5.6c | 4.1bc | 4.6de | |
| Impact® and Prosaro® @ Z31, Z39 | 0b | 0d | 0c | 5.5c | 4.2c | 4.7e | |
| Impact® and Prosaro® @Z31, 39 & 55 | - | 0d | 0c | - | 4.2c | 4.7e | |
| P = | <0.001 | <0.001 | <0.001 | <0.001 | 0.017 | <0.001 | |
| LSD (0.05) = | 1.72 | 7.17 | 11.16 | 0.44 | 0.40 | 0.26 | |
ABaytan® (150 g/L Triadimenal,) applied @ 100 ml/100kg of seed, Impact Infurrow® (Flutriafol 250 g/L) applied @ 400 ml100kg of seed, Prosaro® (210 g/L prothioconazole 210 g/L tebuconazole) applied @ 300 ml/ha.
BMeans within a column followed by the same letter are not significantly different (P=0.05)
C- = Treatment not tested in 2011.
Spot form of net blotch management
Spot form of net blotch (SFNB) is another common stubble-borne disease of barley that can be best managed by growing cultivars with a rating of moderately susceptible (MS) or better. However, the majority of available malting quality cultivars are susceptible. Ten field experiments were conducted in the Wimmera region of Victoria during 2003-11 in which one to three barley cultivars were grown and disease and fungicide treatments applied. The disease plots were inoculated with stubble infected with SFNB. Fungicide plots were treated with a foliar fungicide on four occasions (Z25,31,39 and 55).
The results show that grain yield and economic loss due to SFNB was typically 0.1-0.4 t/ha in S and VS cultivars (Table 4). The MSS cultivar, grown in 2003-04, had no yield loss. These results indicate that yield losses due to SFNB are usually <10% annually, but in addition to yield loss this disease can have affects on grain quality attributes such as grain plumpness which is important for malt grain.
Table 4. Grain yield loss in susceptible barley cultivars in the presence and absence of spot form of net blotch in the Wimmera region of Victoria during 2003-11
| Year | Location | Cultivar | Grain Yield (t/ha) | Economics | ||
|---|---|---|---|---|---|---|
| ADiseased | BFungicide | % diff | ||||
|
2003
|
Horsham
|
Gairdner |
4.8 | 4.7 | 1 | $19 |
|
Dhow |
4.6 | 4.6 | 0 | 0 | ||
|
SloopVic |
4.7 | 4.6 | 1 | $19 | ||
|
2004
|
Horsham
|
Gairdner |
1.7 | 2.0 | -15 | -$57 |
|
Dhow |
1.7 | 1.8 | -6 | -$19 | ||
|
SloopVic |
2 | 2.0 | 0 | 0 | ||
| 2005 | Horsham |
Gairdner |
3.2 | 3.6 | -12 | -$76 |
| 2006 | Horsham |
Dash |
0.3 | 0.3 | 0 | 0 |
|
2007
|
Horsham |
Dash |
3.1 | 3.3 | -6 | -$38 |
| Wonwondah |
Dash |
5.1 | 5.2 | -2 | -$19 | |
| 2008 | Wonwondah |
Dash |
3.4 | 3.6 | -6 | -$38 |
|
2009
|
Horsham |
Dash |
3.9 | 4.0 | -2 | -$19 |
| Wonwondah |
Dash |
4.9 | 5.0 | -2 | -$19 | |
| 2011 | Horsham |
Dash |
5.4 | 5.8 | -7 | -$76 |
ADiseased plots were treated with stubble naturally infected with SFNB
BFungicide plots were treated with Tilt® or Bumper® (250 g/L propiconazole) applied @ 250 ml/ha.
CEconomics based on the difference in grain yield between the diseased and fungicide treatment multiplied by a barley grain price of $190/t.
Foliar fungicides can be used to help suppress SFNB and reduce the likelihood of losses in grain yield and quality. Five field experiments were conducted during 2005-09 to determine the best growth stage to apply foliar fungicide for suppression of SFNB in a very susceptible barley cultivar. The cultivar GairdnerA was sown during 2005 and DashA sown 2007-09. Disease plots were inoculated with stubble infected with SFNB. Fungicide plots were treated with foliar fungicide on one of four occasions (Z25,31,39,55).
The application of foliar fungicide at Z31 provided the most consistent reduction in spot form of net blotch severity (Table 5). Application at Z39 provided significant reductions in 3 of the 5 experiments. Applications at Z25 and Z55-9 were less reliable in suppressing SFNB with significant suppression achieved in one and two experiments respectively. None of the treatments provided complete control of SFNB. These results indicate that when disease pressure is high, a two application strategy may be necessary to provide sufficient suppression which would ideally consist of applications at both Z31 and Z39.
Table 5. Effect of foliar fungicide application at different crop developmental stages on spot form of net blotch severity (% leaf area affected) on the top four leaves of Gairdner![]() (S) (2005) or Dash
(S) (2005) or Dash![]() (VS) (2007-2009) at dough development in the Wimmera
(VS) (2007-2009) at dough development in the Wimmera
|
SFNB severity (%LAA) |
|||||
|---|---|---|---|---|---|
| Treatment A | Horsham 2005 | Wonwondah 2007 | Wonwondah 2008 | Horsham 2009 | Wonwondah 2009 |
| Nil | 17.6 | 26.3 | 4.7 | 8.3 | 5.3 |
| Z25 | 14.9 | 21.0 | 3.4* | 6.6 | 5.8 |
| Z31 | 10.0* | 16.3* | 2.3* | 6.1* | 5.0 |
| Z39 | 16.8 | 15.7 * | 4.6 | 5.8* | 2.8* |
| Z55-59 | 12.8 * | 21.3 | 1.6* | 9.7 | 6.1 |
| P= | <0.001 | <0.001 | <0.001 | <0.001 | <0.001 |
| LSD (0.05) | 3.624 | 5.926 | 1.166 | 1.937 | 1.448 |
AFungicide plots were treated with Tilt® (250 g/L propiconazole) applied @ 250ml/ha
* Significantly lower than the Nil treatment at (5% sig)
References
Evans ML, Hollaway GJ, Dennis JI, Correll R, Wallwork H (2010) Crop sequence as a tool for managing populations of Fusarium pseudograminearum and F. culmorum in south-eastern Australia. Australasian Plant Pathology 39, 376-382
Hollaway GJ, Evans ML, Wallwork H, Dyson CB, McKay AC (2013) Yield loss in cereals, caused by Fusarium culmorum and F. pseudograminearum (crown rot), is related to concentrations of fungal DNA in soil prior to planting, rainfall and cereal type. Plant Disease (In Press)
Hollaway GJ, Exell GK (2010) Survey of wheat crops for white heads caused by crown rot in Victoria, 1997-2009. Australasian Plant Pathology 39, 363-367.
More Information
More information is available on the DPI web site: www.dpi.vic.gov.au/graindiseases
Contact details
Grant Hollaway
Department of Primary Industries, Private Bag 260, Horsham, Victoria, 3401
grant.hollaway@dpi.vic.gov.au
Mark McLean
Department of Primary Industries, Private Bag 260, Horsham, Victoria, 3401
mark.mclean@dpi.vic.gov.au
Was this page helpful?
YOUR FEEDBACK