Quantifying herbicide resistance in modern farming systems (Griffith region 2012/2013)
Author: Barry Haskins | Date: 11 Feb 2014
Author:
Barry Haskins, Ag Grow Agronomy and Research Pty Ltd
GRDC Fast track project
Take home messages
- Herbicide resistance is becoming a major issue in cropping systems. Ryegrass and sow thistle were evaluated in this project; however other weeds such as wild oats, wild radish, mustards, poppy, etc. are also developing resistance in this region.
- This project evaluated samples taken from both known resistant populations and non-resistant populations. 100% of ryegrass samples and 22% of sow thistle samples were resistant or developing resistance to at least one herbicide. Multiple resistance in ryegrass was common.
- Growers and advisers were accurate 74% of the time when predicting ryegrass resistance. This reduced to 65% for post emergent herbicides.
- Cross resistance between Logran® and Hussar® in ryegrass was lower than expected. This has raised some questions.
- No-till continuous cropping rotations hosted higher resistance levels and often to more herbicides than less intensive rotations that included pasture. However in many cases, samples from paddocks that have had minimal herbicide applications often showed resistance to multiple herbicides.
- This project was initiated by NSW DPI, and taken over by Ag Grow Agronomy as a result of restructuring. This project highlights the importance of pre-emergent herbicides in conjunction with non-herbicide weed control for a sustainable farming future.
Background
Herbicide resistance in annual ryegrass (Lolium rigidum) and common sowthistle (Sonchus oleraceus) in the western riverina region of NSW has elevated significantly in recent years.
The nature of the cropping and pasture rotations in the region have made managing herbicide resistance extremely difficult, and recent random herbicide resistance surveys funded by GRDC have included only limited samples from this region.
The majority of the region is marginal dryland winter cropping (2t/ha average) where no-till farming adoption has elevated to over 75% (Ag Grow crop benchmarking, 2013). Spending money on expensive alternative herbicides is difficult as farm sizes are large (>3500ha) and returns are often low and variable.
In comparison, the highly intensive irrigation cropping systems within the region, where tight rotations (including horticulture), high herbicide inputs and large areas of channels and roads exist, have resulted in extremely high perceived levels of herbicide resistance.
Widespread flooding in the region in March 2012 caused significant seed dispersal across large areas, and growers and advisers felt unarmed with the appropriate knowledge to choose the right herbicides for effective weed control, particularly for ryegrass and sow thistle.
This was raised as an issue with GRDC, and therefore, a fast track project was established to provide growers and advisers with the necessary information to manage the problem.
It is important to note that this project was originally established between NSW DPI and GRDC, however as a result of structural changes in NSW DPI, Ag Grow Agronomy and Research was contracted to complete the project.
Aim
The aim of this project was to capture the current resistance status of a large sample of ryegrass and sow thistle; to key pre-emergent and post emergent herbicides in the western riverina region of SW NSW.
In addition, the project aimed to measure the risks of herbicide resistance according to the rotational history and farming practices, and also the ability of growers and advisers to predict the resistance status of each sample.
Methodology
Sampling
101 annual ryegrass and 31 sow thistle samples were collected by growers and advisers during harvest in 2012.
Samples were taken from both known resistant populations and non-resistant populations.
An A4 envelope of seed was required following weed maturity, and samples were taken at every five to ten paces aiming to avoid bias towards single populations.
Samples were appropriately identified, GPS referenced, and submitted with the appropriate questionnaire sheet.
The questionnaire sheet requested information about the history of the paddock, the current farming system and the expected resistance status of the sample.
Testing
The resistance screening took place at the Graham Centre resistance testing facility in Wagga Wagga, and was performed under the same protocols as commercial tests.
Table 1. Herbicides and rates used for resistance screening
|
Herbicide |
Example trade name |
Pre- or post- treatment |
Rate (Lt or g/ha) |
Rate (g ha-1 a.e.) |
Adjuvant (rate % v/v) |
|---|---|---|---|---|---|
Ryegrass |
|||||
|
diclofop-methyl |
Hoegrass® |
Post |
0.75Lt |
375 |
Chemwet 1000 (0.25) |
|
haloxyfop-R |
VerdictTM |
Post |
0.075Lt |
39 |
Uptake (0.5) |
|
clethodim |
Status® |
Post |
0.5Lt |
120 |
Hasten (1.0) |
|
pinoxaden + cloquintocet-mexyl |
Axial® |
Post |
0.3Lt |
30 |
Agidor (0.5) |
|
imazamox + imazapyr |
Intervix® |
Post |
0.75Lt |
48 |
Hasten (0.5) |
|
iodosulfuron-methyl-sodium |
Hussar® |
Post |
0.1Lt |
10 |
Chemwet 1000 (0.25) |
|
triasulfuron |
Logran® |
Pre |
35g |
26.25 |
- |
|
trifluralin |
Triflur X® |
Pre |
1.7Lt |
816 |
- |
|
prosulocarb + S-metolachlor |
Boxer Gold® |
Pre |
2.5Lt |
2300 |
- |
|
pyroxasulfone |
Sakura® |
Pre |
118g |
100.3 |
- |
|
glyphosate |
Roundup |
Post |
1.2Lt |
648 |
- |
Sow thistle |
|||||
|
metsulfuron-methyl |
Ally® |
Post |
5g |
3 |
Chemwet 1000 (0.1) |
|
iodosulfuron-methyl-sodium |
Hussar® |
Post |
0.1Lt |
10 |
Chemwet 1000 (0.25) |
|
MCPA + imazapyr + imazapic |
Midas® |
Post |
0.9Lt |
286 |
Supercharge (0.5) |
|
clopyralid |
LontrelTM |
Post |
0.125Lt |
75 |
- |
|
MCPA |
MCPA |
Post |
1.4Lt |
700 |
- |
|
glyphosate |
Roundup |
Post |
1.2Lt |
648 |
- |
Results
The results of the herbicide resistance testing were quite remarkable and somewhat unexpected.
The results can be analysed broadly whereby trends are linked to each herbicide, and also individually where specific background information are linked to each sample which allows a detailed interpretation of the reasoning why a sample may be resistant to a particular herbicide.
Table 2. Rotation and farming system details of samples
|
|
Ryegrass |
Sowthistle |
||||
|---|---|---|---|---|---|---|
|
Rotation |
Dryland |
Irrigated |
Total |
Dryland |
Irrigated |
Total |
|
Continuous cropping no till |
30 |
4 |
34 |
9 |
1 |
10 |
|
Continuous cropping with cultivation |
13 |
21 |
34 |
4 |
8 |
12 |
|
Cropping and fallow with cultivation |
13 |
4 |
17 |
2 |
2 |
4 |
|
Mixed farming including cropping and pasture |
4 |
2 |
6 |
0 |
0 |
0 |
|
No till with chemical fallow |
6 |
1 |
7 |
4 |
0 |
4 |
|
Pasture > 5yrs |
3 |
1 |
4 |
0 |
1 |
1 |
|
Grand Total |
69 |
33 |
102 |
19 |
12 |
31 |
Table 3. Expected versus actual resistance levels in ryegrass and sow thistle
|
|
Expected resistance in ryegrass |
Actual resistance in ryegrass |
|||
|---|---|---|---|---|---|
|
|
Yes |
No |
Yes |
Developing |
No |
|
Glyphosate |
32 |
70 |
8 |
13 |
78 |
|
TreflanTM |
0 |
102 |
0 |
3 |
96 |
|
Sakura® |
0 |
102 |
0 |
0 |
0 |
|
Boxer Gold® |
0 |
102 |
0 |
0 |
0 |
|
Logran® |
57 |
45 |
82 |
14 |
5 |
|
Hoegrass® |
53 |
49 |
62 |
18 |
21 |
|
Axial® |
39 |
63 |
43 |
18 |
37 |
|
VerdictTM |
30 |
72 |
49 |
20 |
29 |
|
Status® |
31 |
71 |
2 |
8 |
89 |
|
Intervix® |
14 |
88 |
19 |
21 |
57 |
|
Hussar® |
19 |
83 |
17 |
8 |
72 |
|
|
Expected resistance in sowthistle |
Actual resistance in sowthistle |
|||
|
|
Yes |
No |
Yes |
Developing |
No |
|
Glyphosate |
7 |
24 |
0 |
0 |
0 |
|
Ally® |
7 |
24 |
3 |
3 |
25 |
|
MCPA |
1 |
30 |
0 |
0 |
31 |
|
LontrelTM |
0 |
31 |
0 |
0 |
31 |
|
Hussar® |
0 |
31 |
0 |
0 |
31 |
|
Midas® |
0 |
31 |
0 |
1 |
30 |
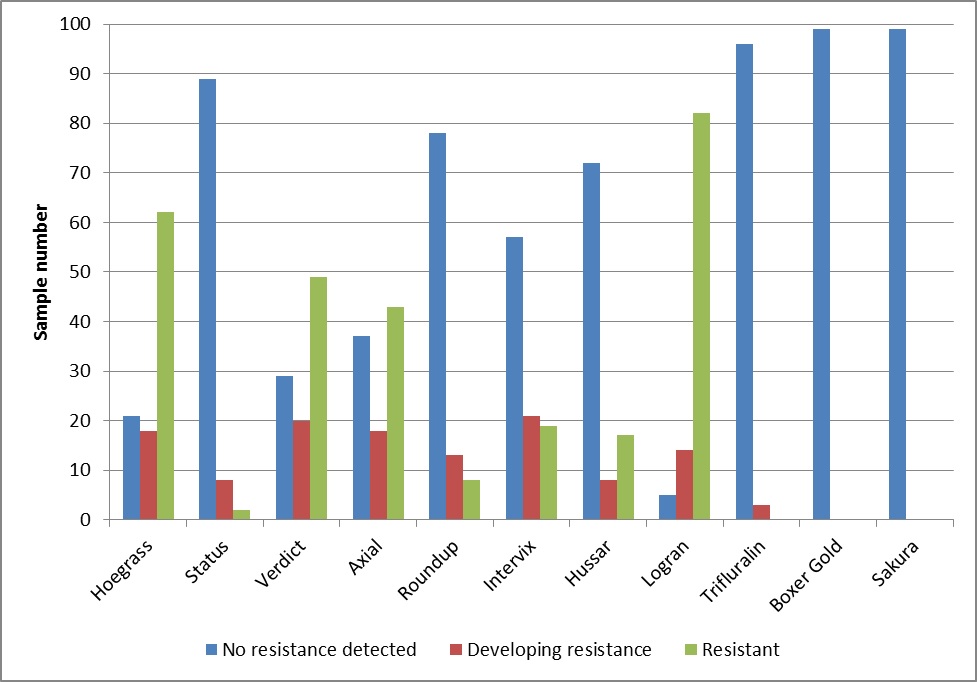
Figure 1. Herbicide resistance test results in ryegrass averaged across each herbicide.
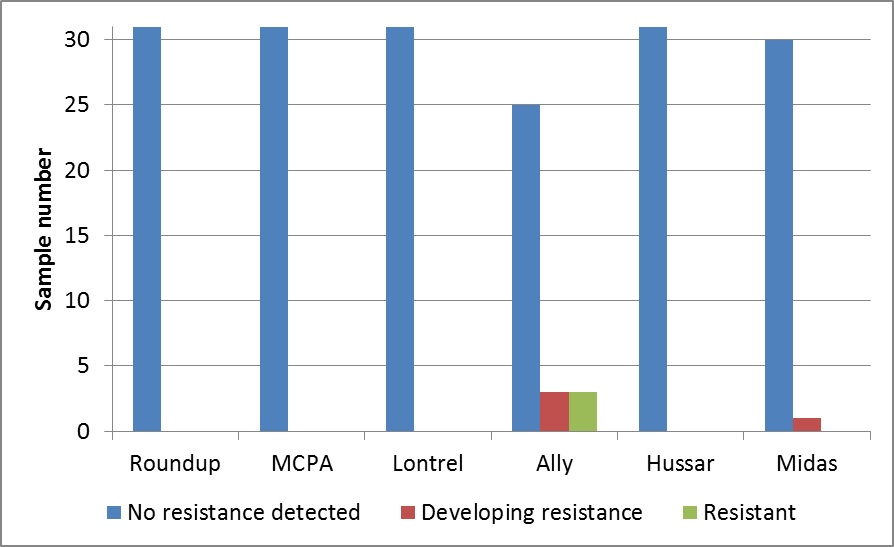
Figure 2. Herbicide resistance test results in sow thistle averaged across each herbicide.
Resistance test results
There were a number of samples that were resistant to one or more herbicides. Importantly, the number of samples that were resistant to all key post emergent herbicides that control ryegrass was disturbing. This highlights the necessity of utilising pre- emergent herbicides such as Treflan®, Boxer Gold® and Sakura®, but also the necessity for non-herbicide weed control tactics.
Resistance levels to more conventional type herbicides such as Logran® and Hoegrass® were higher than expected, however the result was not that surprising.
Resistance to Roundup however, is much higher than what would have been suggested by industry trends; however levels were as expected by growers and advisers. This highlights the need to utilise other knockdown herbicides such as Gramoxone® in conjunction with other non-herbicide knockdown tactics to extend the life of Roundup.
The same could be said for Axial® and VerdictTM, however the elevated levels caught many growers and advisers by surprise.
What was extremely interesting was the lack of association between Logran® and Hussar® resistance. Both herbicides belong to the sulfonyl urea group B herbicide group, and therefore, some cross resistance would be expected. This was not the case in this project, and levels of cross resistance are much lower than industry experience (industry expectations would be around 10-15%). The level of cross resistance experienced in this project was 67% (i.e. in 67% of the time a sample that showed resistance to Logran® was non-resistant to Hussar®). The reasons these trends have occurred are beyond the scope of this project, and may form an interesting topic for research by industry specialists. It is worth noting that many paddock scenarios in 2013 reinforced the test results from the laboratory.
Grower/adviser ability to predict resistance
Another point of discussion was the ability of the grower/adviser to predict if resistance was going to be present in the sample submitted.
The prediction accuracy averaged across all herbicides was 74%, however for post emergent herbicides; the prediction accuracy was only 65%. This is concerning, as most growers/advisers that presented samples were highly experienced and familiar with the issues they were facing with resistance on their farms. The fact that 26% of the time the grower/adviser thought that a sample was non-resistant but in actual fact the sample was resistant may paint a picture as to the level of failed herbicide applications that occurs commonly in the farming system. And this survey was conducted with the top level farmers and advisers!
Effect of rotation on resistance levels
Results showed that higher cropping intensity correlated with higher the resistance to a wider number of herbicides.
What was very interesting however, was the level of resistance measured in samples with no expected resistance. In many cases, these paddocks had never had an application of the herbicide that it was resistant to. In some cases, the paddocks had never had any herbicides applied to them at all. However, they still hosted resistance to at least one herbicide. Experience in the field has also shown this to be true.
This would suggest that either the populations were naturally resistant to that herbicide type, or resistance has crept into the population either by seed movement in wind, water, stock, wild animals, etc., or other means such as pollen movement (as ryegrass is a cross pollinating weed). The latter explanation is unlikely however, in some cases the only reasonable answer. Industry experts would suggest that pollen movement would only be likely within short distances (e.g. 10-20m), and the details behind such movement of herbicide resistance is beyond the scope of this project.
Acknowledgements
This project would not have initiated without the involvement of NSW DPI district agronomists and management staff.
The technical expertise in establishing collection and testing protocols, and resistance testing was performed by John Broster, Graham Centre.
AgGrow Agronomy and Research would like to formally acknowledge all farmers involved in the project, and agronomists John Ronan and Heath McWhiter (Elders), Peter Hill and Thane Pringle (Yenda Producers Coop), Chris Lvitzke (Landmark), Allan Jones (Agronomic Business Solutions) and Pat Connell (PC Agronomy) for submitting samples and being involved in the extension of the project.
Contact details
Barry Haskins
Was this page helpful?
YOUR FEEDBACK