Frost damage in crops - where to from here?
Author: Dale Grey | Date: 12 Mar 2014
Dale Grey,
DEPI Bendigo
Take home messages
- Frost is a relatively rare occurrence but some areas are more prone to it.
- There has been an increase in frost frequency in many areas in the last 20 years.
- Minor agronomic tweaks might be necessary in some frost prone areas but most growers should be steady as she goes.
- In the event of severe frost, monitoring needs to occur up to two weeks after the event to detect all the damage.
Background
In October 2013 many farmers and their advisers experienced severe late frosting that dramatically decreased yield. The 18th of October was the morning that caused people the most grief, but in parts of NE Victoria and Southern NSW up to three significant frosts were experienced in October. Due to the relative sparseness of official temperature readings and the large effect low topography plays in frosting, the maps (Figures 1 and 2) are an underestimate of the affected area. Known frost effected regions exist outside these boundaries however; a suitable satellite did not pass overhead on that morning for a finer resolution image.
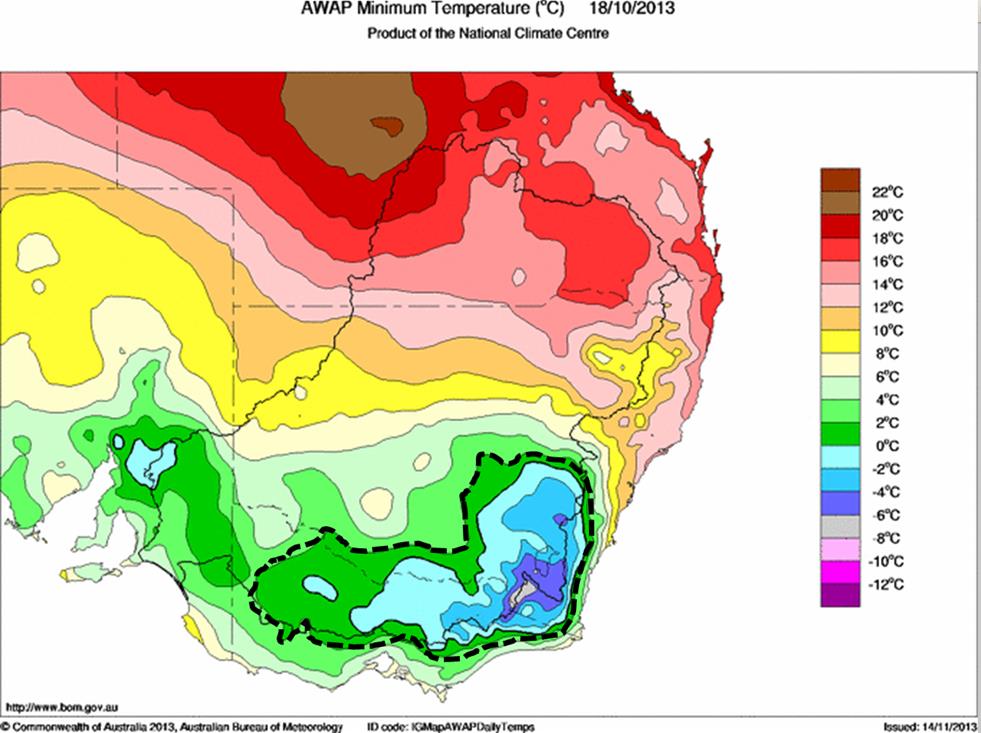
Figure 1. Frost distribution map set at +2 degrees C, ground level 0 degrees C, wheat head height + 1 degrees C, perimeter in black dashes.
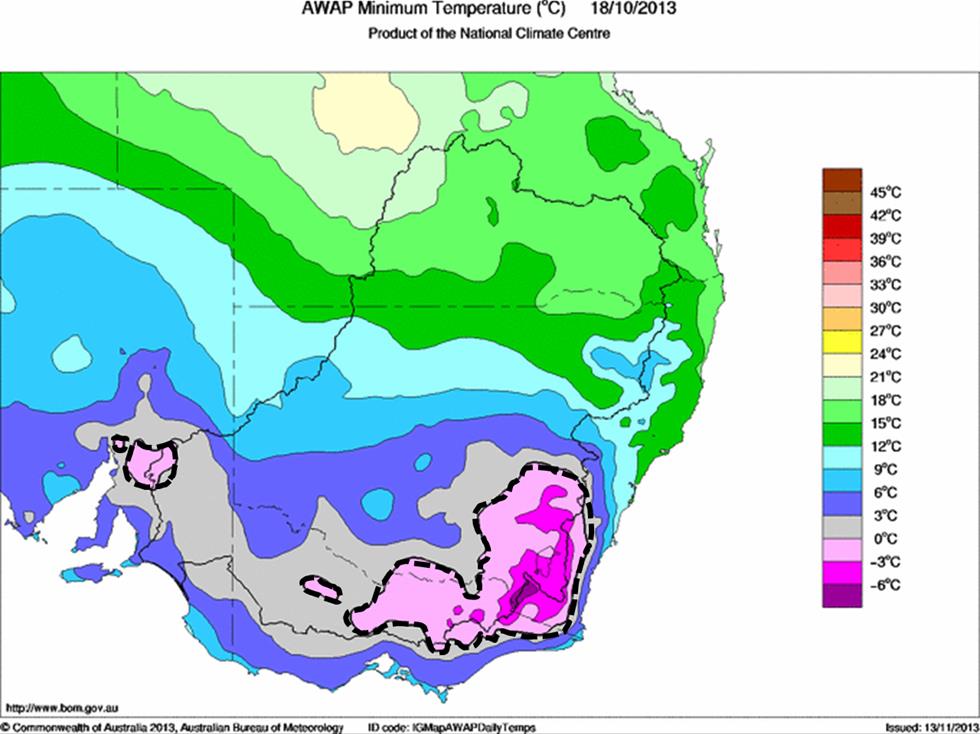
Figure 2. Frost distribution map set at 0 degrees C, ground level – 2 degrees C, wheat head height -1 degrees C, perimeter in black dashes.
Concern about frost
A small survey conducted by DEPI in October-November 2013 showed that 68% of respondents in SE Australia were very or moderately concerned about frost damage in cereals (n=111). In canola the number was less, at 40% and in pulses the level was 57%.
What causes frost?
Clear, calm and dry nights following cold days are the precursor conditions for a radiation frost (or hoar frost). These conditions are most often met during winter and spring where high pressures follow a cold front, bringing cold air from the southern ocean but settled cloudless weather. When the loss of heat from the earth during the night decreases the temperature at ground level to zero, a frost occurs. Wind and cloud reduce the likelihood of frost by decreasing the loss of heat to the atmosphere. The extent of frost damage is determined by how quickly the temperature takes to get to zero, the length of time its stays below zero and the how far below zero it gets.
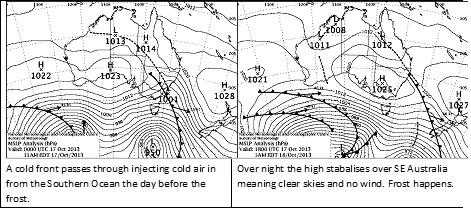
Figure 3. Common weather patterns experienced prior to frost occurrence.
How do we measure frost temperatures?
Most BoM temperatures are measured 1.2-1.5 metres above the ground in a Stevenson Screen. Frost occurs at ground level when it’s +2.2oC in the white box. The officially recorded temperatures vary for frost damage depending on the height of the crops; lentils and chickpeas being the shortest. The threshold temperature for damage also varies with crop and season. In general however, an official temperature of 0oC, will have a negative effect on crops of any crop height, but between 0+2oC the frost effect is variable.
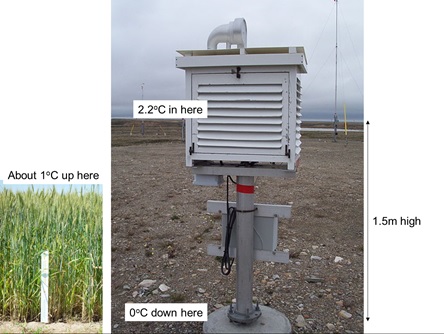
Figure 4. Diagram of frost recording system and the variation of temperature recorded with location of measurement.
Frost effect on the plant
There are two types of frost experienced in Victoria, “white” and “black”. “White” frost occurs when the air around the plant is moist and the temperature around the plant is zero or below. Ice crystals form on the surface of the plant (“white”). The water in between plant cells freezes and draws water out of surrounding cells to form more ice. When frost melts slowly (e.g. in winter), damage is minor and the plants repair themselves to fight another day. Often the least damage is in the shadows of trees where the thaw is slower, or on the side of the grain head away from the sun. The visual effect is similar to drought stress as plants can temporarily appear wilted. In spring, the thawing can be rapid and damage can be severe.
“Black” frost occurs when the temperature drops below zero but the surrounding air is dry (e.g. drought conditions). Ice can’t form on the plant surface and the water between cells freezes quickly and forms large crystals. These large crystals “pop” holes in the cells causing permanent damage. Once thawed, plant parts affected immediately look floppy, spongy and discoloured. If that plant part happens to be a flower or a developing ovary the result can be detrimental to yield.
Frost damage occurs to legume pods and seeds, canola pods, flowers and seeds and cereal grains, flowers, or whole heads if the stem freezes around the flag leaf or in the boot. Flowering wheat, triticale, podding canola and field peas are some of the most sensitive crops to frost. Barley and oats are the most tolerant.
Are frosts becoming more frequent?
The DEPI survey showed that 66% of respondents thought that frost events were a 1-3 in 10 year event, but the spread between never and every year in ten was wide. Geographic viewing of this data might help to elucidate this better for the different regions.
It is ironic that as temperatures (particularly those in winter and spring), are getting warmer, frost is still a major issue. CSIRO researchers have discovered that there are areas of Australia where the frost number has been measured to be rising (greatest in August), with Eyre Peninsula, Esperance, Northern Vic Mallee, and Central West NSW the only major crop growing areas to be less affected by frost in the period 1961-2010 (Crimp et al. in Press) The finger of blame has been pointed at the latitude of the Sub Tropical Ridge of high pressure drifting south (causing more stable pressure systems) and the existence of more El Nino conditions during this period.
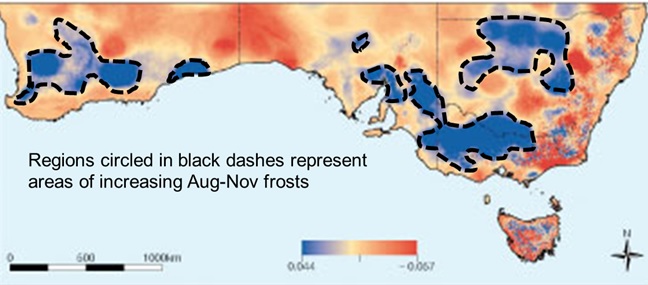
Figure 5. Regions of increasing Aug – Nov frosts (Source: Steven Crimp).
Effect of nitrogen and stubble on frost damage
Any action that can increase the storage of heat in the soil for re-radiation back at night can help to decrease frost damage. Unfortunately, thin crops and bare soils which increase the storage of heat within the soil, are agronomically on the nose. The process of heat storage requires moist soil which is why frost damage is greatest when soil is dry. Stubble cover insulates the surface against moisture and heat loss, but also increases heat gain. Extra soil moisture or lower soil temperatures as a result of stubble cover can delay flowering potentially changing the frost risk in or out of the danger zone. WA is conducting research on stubble retention and frost due to anecdotal information from farmers. The use of high nutrition rates can lead to thick crops which are also a good insulator for preventing heat loss back to the surrounding air at night, but also preventing sunshine from warming the earth. If the addition of nitrogen (N) increases canopy size, it will also increases water use at a time that could be critical for frost damage. Nitrogen application delays flowering potentially moving the crop out of a frost period. WA research has shown that sowing frost prone areas thinly and cutting back fertiliser has led to a greater chance of lower losses from those paddocks.
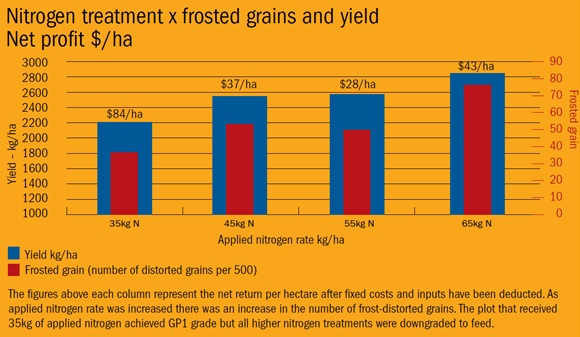
Figure 6. Effect of nitrogen application (Source GRDC Managing frost, minimising damage Fact sheet; Yealering WA 2005, variety = Wyalkatchem)
The importance of sowing time and flowering dates
Most people stage their sowing dates over a 3-6 week period. If you were sowing just one variety, this would provide a long flowering window. If like most people you sow the winter wheat first, then the long season, then the mid-season, then the early maturing wheats last, you set your whole crop to flower over a 2 week period, potentially exposing you to more frost risk but maximising the yield potential in the absence of frost. To maximise frost risk resilience you need a mix of sowing dates and maturity types to be able to miss the late frosts. In years of severe frost it may not matter what you do to prevent damage.
What can you do about it?
The DEPI survey asked people what they were currently doing to mitigate against frost damage. Most farmers and advisers use crop types and maturity length regularly, but much less mix up their sowing times to manipulate frost risk exposure. Even fewer people choose to deliberately sow later. Some people do treat frost prone areas differently or grow less of the susceptible crops.
Table 1. Survey results regarding grower’s methods of mitigation against frost damage
|
All the time |
Most of the time |
Some of the time |
Never |
Other |
|
|---|---|---|---|---|---|
|
Sowing a mix of crop types |
26% |
36% |
28% |
10% |
|
|
Sowing a mix of crop maturities |
20% |
33% |
37% |
10% |
|
|
Sowing at a mix of times |
5% |
16% |
46% |
32% |
|
|
Delaying sowing |
3% |
2% |
37% |
59% |
|
|
Treating frost prone areas differently |
9% |
10% |
32% |
49% |
|
|
Grow less of the most susceptible crops |
7% |
13% |
48% |
32% |
|
|
Other |
3% |
||||
|
N=111 |
N=111 |
N=111 |
N=111 |
Other strategies suggested by respondents
- Sow varieties with higher tillering capacity and those that flower over an extended period.
- Grow crops on fallow to avoid extreme moisture stress when vulnerable to frost.
- Frost at flowering is not the only susceptible time. Because damage occurs at any time from head emergence to late in grain filling the strategies have to be more robust than just minor variations in things like sowing dates.
When the frost is late and cold, it may not matter what you have done if you are in a frost prone area. There are many things you can do to mitigate against frost damage in the not so bad years though. Sowing an earlier maturity variety early, whilst flying in the face of the frost often misses out on the late ones. Likewise barley and oats which have much greater temperature thresholds than wheat can minimise the loss as well. Perhaps if you have copped one too many frosts in the same paddock you might start treating those parts of paddocks slightly differently.
What have we learned?
Let’s not throw the baby out with the bathwater as most of us are sowing our crops as soon as we can to maximise the yield in the absence of frost. The odds would suggest that the majority of crop should remain that way. Perhaps though, a few paddocks could fly in the face of conventional agronomic wisdom to keep nature guessing. Frost mitigation really requires some serious mixing up of the cropping program.
This season was similar to the 1998 frost. Symptoms showed up the next day on the crops closest to flowering but the damage on developing grains can take up to two weeks to become totally apparent. Once you know you have had a bad frost you must continually monitor for signs of damage even after the first check has proven OK.
References
Crimp et al. 2013 Bayesian space-time model to analyse frost risk for agriculture in South-East Australia: explaining the frost paradox. Int. J. Clim. 2013 (in Press)
Contact details
Dale Grey
Department of Environment and Primary Industries, PO Box 3100, Bendigo DC, 3554.
0354 304444
Was this page helpful?
YOUR FEEDBACK