The effect of plant density on yield in chickpea across central and northern NSW
Author: Andrew Verrell, Rohan Brill and Leigh Jenkins | Date: 05 Mar 2014
GRDC project code: DAN00171
![]() Varieties displaying this symbol beside them are protected under the Plant Breeders Rights Act 1994.
Varieties displaying this symbol beside them are protected under the Plant Breeders Rights Act 1994.
Authors
Andrew Verrell: Tamworth Agricultural Institute, NSW Department of Primary Industries, Tamworth NSW 2340, Australia.
andrew.verrell@dpi.nsw.gov.au
Rohan Brill: Wagga Wagga Agricultural Institute, NSW Department of Primary Industries, Wagga Wagga, NSW 2650, Australia.
rohan.brill@dpi.nsw.gov.au
Leigh Jenkins: Trangie Agricultural Research Institute, NSW Department of Primary Industries, Trangie NSW 2823, Australia.
leigh.jenkins@dpi.nsw.gov.au
Take home message
- When sowing within the optimum sowing window mid May – mid June;
- yield potential ≥ 1.5 t/ha sow at ≥ 30 plants/m2
- yield potential ≤ 1.5 t/ha sow at ≥ 20 plants/m2
- When sowing very late sow at high plant density
- To reduce losses due to virus, DO NOT sow below 20 plants/m2
Introduction
Research in Queensland by Beech and Leach (1989), recommended plant populations of 40 plants/m2 and later work by Brinsmead et al. (1996) suggested an optimum sowing density of 20–40 plants/m2.Whish et al (2007) monitored 52 commercial chickpea crops over three seasons (2002-04) which showed the median plant density on farm fluctuated between 14 and 22 plants/m2. Modelling by Whish et al (2007) suggested that increasing plant density independently of sowing date would improve yields 55% of the time for crops sown in early June and 60% of the time for crops sown in mid May.
Current agronomic advice suggests yields are relatively stable over plant densities of 20-30 plants/m2, with an optimum target population of 25 plants/m2 for northern regions (Cumming and Jenkins, 2011).
Methods
A series of variety x plant density factorial experiments were conducted across a number of central and northern NSW locations from 2011 to 2013.
Varieties examined were PBA HatTrick![]() , PBA Boundary
, PBA Boundary![]() , Kyabra
, Kyabra![]() , CICA912 and GEN090 (small seeded kabuli) at plant densities of 5, 10, 15, 20, 30 and 45 plants/m2. During 2011 and 2012 experimental sites were located at Coonamble and Tamworth. In 2013 the number of sites was expanded to eight with the commencement of DAN00171 to include; North Star, Moree, Edgeroi, Burren Junction (not harvested), Coonamble, Tamworth, Pine Ridge and Trangie.
, CICA912 and GEN090 (small seeded kabuli) at plant densities of 5, 10, 15, 20, 30 and 45 plants/m2. During 2011 and 2012 experimental sites were located at Coonamble and Tamworth. In 2013 the number of sites was expanded to eight with the commencement of DAN00171 to include; North Star, Moree, Edgeroi, Burren Junction (not harvested), Coonamble, Tamworth, Pine Ridge and Trangie.
Row spacing varied across sites; Trangie 33cm, Tamworth 40cm, North Star, Moree, Edgeroi, and Pine Ridge all at 50cm and Coonamble at 66cm.
Across all sites and years variety and plant density were significant as main effects but there were no significant interactions between variety and plant density. In this paper only yield responses to plant density will be reported.
Effect of plant density on yield in contrasting environments – Coonamble and Tamworth
Experiments were conducted at Coonamble and Tamworth from 2011-2013. The differences between these locations is best characterised in terms of crop season (May – November) rainfall and evapotranspiration.
In 2011, the wettest of the three crop seasons, Tamworth received 499mm compared to Coonamble with 381mm. Both 2012 and 2013 were drier years in both environments with Tamworth (262 and 268mm) receiving, on average, 130mm more in-crop rainfall in each year than Coonamble (132 and 139mm). Crop season evapotranspiration totals in Coonamble were 846, 918 and 1043mm, compared to Tamworth with 725, 818 and 872mm, for 2011, 2012 and 2013, respectively.
The response of yield to plant density at Coonamble and Tamworth are shown in Figures 1 and 2, respectively.
Figure 1. The effect of plant density on grain yield at Coonamble in 2011 ( ), 2012 (
 ) and 2013 (
 ).
).
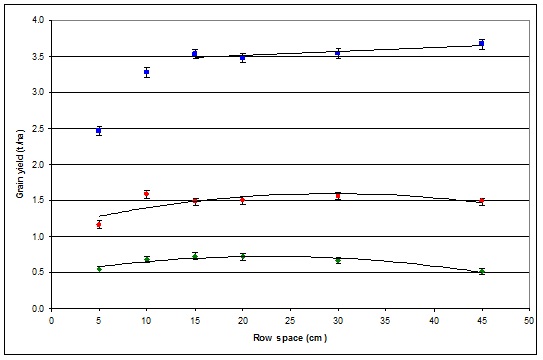
Figure 1 text description: 2011 had the highest grain yields that increased with row space ranging from approximately 2.5t/ha at a row space of 5cms to approximately 3.65t/ha at a row space of 45cms. 2012 had a consistent yield across row space with a minimum yield of approximately 1.15t/ha at a row space of 5cm and a maximum yield of 1.6t/h at a row space of 10cm. 2013 had the lowest yield of the three years but a consistent yield through the different row spaces. 2013 had a minimum yield of approximately 0.55t/ha at row space 45cm and a maximum yield of approximately 0.75t/ha at row space 15cm.
At Coonamble (see Fig. 1), in the two drier seasons, yield was ≤ 1.5 t/ha and was not significantly different at densities ranging from 15 to 45 plants/m2. In the wetter year, 2011, grain yield reached over 3.5 t/ha ad there was a marginal but significant increase in yield between 15 (3.53 t/ha) and 45 plants/m2 (3.89 t/ha).
At Tamworth, the wetter of the two locations, yields were more responsive across the range of plant densities over all years (see Fig. 2).
Figure 2. The effect of plant density on grain yield at Tamworth in 2011 (), 2012 () and 2013 ().
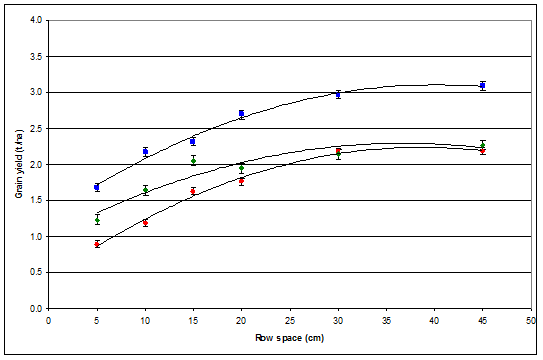
Figure 2 text description: 2011 had the highest grain yields that increased with row space ranging from approximately 1.7t/ha at a row space of 5cms to approximately 3.1t/ha at a row space of 45cms. 2013 had a increasing yield across row space ranging from approximately 1.25t/ha at a row space of 5cms to approximately 2.25t/ha at a row space of 45cms. 2012 had the lowest yield of the three years that increased with row space from approximately 0.85t/ha at a row space of 5cms to approximately 2.2t/ha at a row space of 45cms.
At Tamworth, the optimum plant density was 30 plants/m2 with yields of 2.97, 2.18 and 2.15 t/ha in 2011, 2012 and 2013, respectively.
The linear response of yield to plant density, from 15 to 45 plants/m2, was derived for each year at both locations. Coonamble had a flatter response across all years with slopes of 5.35, 0.18 and -7.35 kg/ha/plant/m2, compared to Tamworth with, 23.51, 19.26, and 9.08 kg/ha/plant/m2 for 2011, 2012 and 2013, respectively.
Effect of plant density on yield across sites - 2013
In 2013 the number of locations was expanded and sites have been grouped into northern (North Star, Moree, Edgeroi, Coonamble) and southern locations (Tamworth, Pine Ridge, Trangie). The May to November rainfall for the northern sites was; Coonamble = 139, Moree = 173, North Star = 205 and Edgeroi = 226mm, while for the southern sites it was; Trangie = 214, Tamworth = 266 and Pine Ridge = 306mm.
The plot of grain yield versus plant density for the northern sites is in Figure 3 while the same relationship for the southern sites is shown in Figure 4. For the northern sites the response of yield to plant density was flat from 15 to 45 plants/m2 (see Fig. 3) with slopes of; Coonamble = -7.35, Edgeroi = -1.27, North Star = 1.6 and Moree = 3.93 kg/ha/plant/m2. For the southern sites, the slope of yield to plant densities, from 15 to 45 plants/m2 (see Fig. 4) were; Trangie = 5.31, Tamworth = 9.09 and Pine Ridge = 16.31 kg/ha/plant/m2.
Figure 3. Effect of plant density (plants/m2) on grain yield (t/ha) for the 2013 northern sites; North Star ( ), Edgeroi (
 ), Moree (
 ) and Coonamble (
 ).
).
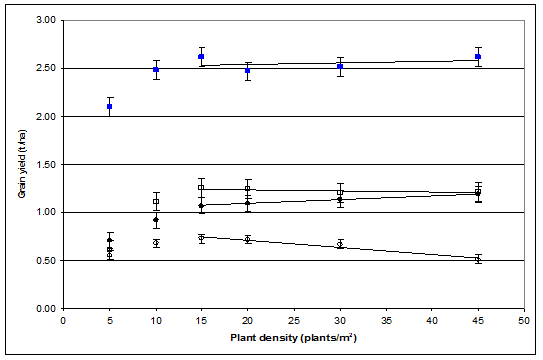
Figure 3 text description: North Star had the highest grain yields with the minimum yield at 5plant/m2 with approximately 2.1t/ha and the maximum yield at 45plant/m2 with approximately 2.65t/ha. Edgeroi had a minimum yield of approximately 0.6t/ha at 5 plants/m2 and a maximum yield of approximately 1.25t/ha at 15plants/m2. Moree had a minimum yield of approximately 0.75t/ha at 5plants/m2 and a maximum yield of approximately 1.2t/ha at 45plants/m2. Coonamble had the lowest yields of the four northern locations with a minimum of approximately 0.5t/ha at 45plants/m2 and a maximum of approximately 0.75t/ha at 15plants/m2.
Figure 4. Effect of plant density (plants/m2) on grain yield (t/ha) for the 2013 southern sites; Tamworth (), Edgeroi () and Trangie ().
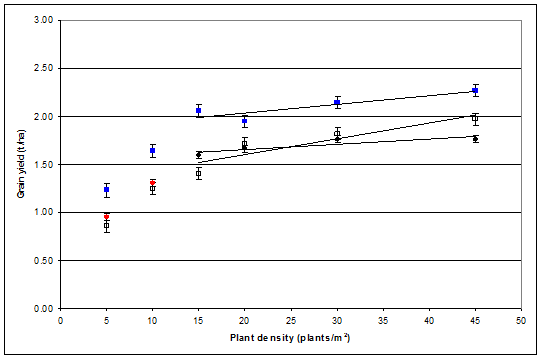
Figure 4 text description: Tamworth had the highest grain yields with a minimum yield of approximately 1.25t/ha at 5plants/m2 and a maximum yield of approximately 2.25t/ha at 45plants/m2. Pine Ridge had a minimum yield of approximately 0.8t/ha at 5plants/m2 and a maximum yield of approximately 2.0t/ha at 45plants/m2. Triangie had a minimum yield of approximately 0.9t/ha at 5plants/m2 and a maximum yield of approximately 1.75t/ha at 45plants/m2.
The southern sites, which on average received more in-crop rain, gave greater yield responses as plant density increased from 15 to 45 plants/m2. Optimum yield was achieved around 30 plants/m2. With the exception of North Star, the northern sites yielded less than 1.5 t/ha at optimum densities of about 20 plants/m2. Even North Star had a flat yield response above 15 plants/m2.
Conclusion
- When sowing within the optimum sowing window mid May – mid June;
- yield potential ≥ 1.5 t/ha sow at ≥ 30 plants/m2
- yield potential ≤ 1.5 t/ha sow at ≥ 20 plants/m2
- When sowing very late sow at high plant density
- To reduce losses due to virus, DO NOT sow below 20 plants/m2
Acknowledgements
Thanks to Michael Nowland and Paul Nash for their assistance in the trial program.
References
D.F. Beech and G.J. Leach (1989). Comparative growth, water use and yield of chickpea, safflower and wheat in south-eastern Queensland. Australian Journal of Experimental Agriculture 29, 655–662.
R.B., Brinsmead, P.R. Thompson, and W.D. Martin (1996) CHICKPEA CULTIVAR X POPULATION X ROW SPACE STUDY IN SOUTHERN QUEENSLAND Australian Agronomy Conference, Poster.
J. P. M. Whish, P. Castor, and P. S. Carberry (2007). Managing production constraints to the reliability of chickpea (Cicer arietinum L.) within marginal areas of the northern grains region of Australia. Australian Journal of Agricultural Research, 58, 396–405
G. Cumming and L. Jenkins (2011). Chickpea: Effective Crop Establishment Sowing Window, Row Spacing, Seeding Depth & Rate. Australian Pulse Bulletin PA 2011 #07
Contact details
Dr Andrew Verrell
NSW Department Primary Industries
Mb: 0429 422 150![]()
Email: andrew.verrell@dpi.nsw.gov.au
GRDC Project Code: DAN00171,
Was this page helpful?
YOUR FEEDBACK