Beyond 8t/ha: Varieties and agronomy for maximising irrigated wheat yields in the northern region
Author: Allan Peake (CSIRO), Matt Gardner (Formerly NSW DPI), Nick Poole (FAR) & Kerry Bell (DAFFQ) | Date: 05 Mar 2014
Allan Peake (CSIRO), Matt Gardner (Formerly NSW DPI), Nick Poole (FAR) & Kerry Bell (DAFFQ)
GRDC code: CSA00039
Take home messages
Several varieties demonstrated high yield and low levels of lodging across a number of experiments, and will now be tested in more detailed experiments in 2014 and 2015 to see if optimal agronomy x variety combinations can yield > 10 t/ha.
The application of plant growth regulators generally increased yield and decreased lodging although the response was not observed for all varieties at all locations. The yield response was more consistent across varieties in experiments which had high levels of N at sowing.
Durum varieties had higher yield on average than bread wheats of similar maturity, but this yield advantage was accompanied by increased lodging risk.
Delayed N application decreased yield at two locations in 2013 due to delayed and/or poor incorporation of in-season N. Timely incorporation of N is necessary for successful in-season N application, especially in a warm growing season.
Wheat can use 6-8mm of water per day during average to warm spring conditions, and can require up to 550mm of evapotranspiration water use through the season to achieve maximum yields, not including irrigation water lost during distribution or application.
Introduction
In response to increased interest in irrigated grains production, GRDC has funded the ‘Better Irrigated Wheat Agronomy’ project from 2012-2016. The project aims to improve agronomic recommendations to increase yield and decrease lodging risk in irrigated wheat, although project results are also relevant to dryland growers in high yielding districts. This paper reports on some of the key project findings from the first two years of experimentation, and also discusses some of the learnings from case study farms, and simulation studies on irrigation scheduling.
Trial program, 2012-2013
The primary objective of the first two years of experimentation was to screen a wide range of varieties in a number of environments, under different agronomic management such as varied timing of N application, and Plant Growth Regulators (PGRs). The results from these trials will be used to update lodging ratings in the QLD and NSW variety guides, and determine the highest yielding varieties for more detailed agronomic trials over the remainder of the project.
Trials were conducted at Breeza, Narrabri, Emerald, Brookstead, Kingsthorpe and Gatton, although only the trials that exhibited significant levels of lodging are reported in this paper. Management details of the trials are included in Table 1. All trials were managed to be disease-free through regular application of preventative fungicide applications, and insecticides (for aphids) where appropriate. PGR applications consisted of 1L/ha of chlormequat chloride mixed with 200 mL/ha of a Syngenta experimental product, applied at approximately GS31.
Results & discussion points
Variety comparison for yield potential and lodging
Yield and lodging risk of longer season cultivars are included in Table 2, while quick maturing cultivars are included in Tables 3 and 4. As we attempted to sow varieties at the most appropriate sowing date for their local maturity classification, there is some cross-over between tables for varieties which change their maturity classification across the Northern Region.
Lodging ratings can be difficult to statistically analyse depending on when the lodging occurs. Lodging at Breeza occurred shortly prior to harvest in both years, and the number of zero’s in the data and the round numbers of the scores (integers) meant that a different analysis was used in each year at Breeza, and a third analysis was used at other sites where lodging ratings where averaged over the grainfilling period. Brief notes on the interpretation of these analyses are included with each table.
Cautionary notes: The performance of agronomic treatments and varieties varies between locations and years. New agronomy or varieties should be tested on a small scale to ensure they are suitable for different locations and farming practices, as varietal performance in these trials may not be repeated at different locations or in different years. Additionally, some of the varieties that performed well are not on the recommended list for the Northern Region so it is important to ensure such varieties can be marketed before choosing to plant them. Finally - fungicides were used to control diseases in all trials as the aim was to test for yield potential in the absence of disease pressures. The performance of some varieties in these trials could be quite different in an environment/year with high disease pressure if fungicides were not used.
Shaded cells mark the best performing varieties at each site. Unfortunately due to lack of irrigation water at Kingsthorpe (2012) and Brookstead (2013) we did not generate lodging data for the Darling Downs – although the yield data from these trials is available on the NVT website for growers who are interested.
Durums vs bread wheats
Figure 1 plots the yield of the five Durum cultivars tested (Hyperno![]() , Bellaroi
, Bellaroi![]() , Caparoi
, Caparoi![]() , Jandaroi
, Jandaroi![]() , Tjilkuri
, Tjilkuri![]() ) against five bread wheat cultivars of similar maturity (Kennedy
) against five bread wheat cultivars of similar maturity (Kennedy![]() , LRPB Crusader
, LRPB Crusader![]() , Livingston
, Livingston![]() , Merinda
, Merinda![]() , GBA Ruby
, GBA Ruby![]() ). A number or growers and agronomists have suggested in past meetings that Durums are more lodging resistant and have higher yield potential than bread wheats. The results from these trials suggest that Durums do possess greater yield potential than bread wheats of similar (quick) maturity, but also have a higher lodging risk on average. Crown rot was noticeable at Narrabri in 2013, which may explain the poorer relative performance of Durums at this location. For growers interested in growing Durum varieties, we did identify significant variation for yield potential and lodging resistance among Durum varieties, and their results are listed separately at the bottom of Table 3 and 4.
). A number or growers and agronomists have suggested in past meetings that Durums are more lodging resistant and have higher yield potential than bread wheats. The results from these trials suggest that Durums do possess greater yield potential than bread wheats of similar (quick) maturity, but also have a higher lodging risk on average. Crown rot was noticeable at Narrabri in 2013, which may explain the poorer relative performance of Durums at this location. For growers interested in growing Durum varieties, we did identify significant variation for yield potential and lodging resistance among Durum varieties, and their results are listed separately at the bottom of Table 3 and 4.
Table 1. Trial locations and management regimes
|
Location & Year |
Trial type |
Maturity |
Sowing Date |
Soil N prior to sowing (kg N/ha)* |
N regime |
PGR comparison? |
|
Breeza 2012 |
Sowing N |
Longs Quicks |
23 - May 14 - June |
65 |
Pre-sowing: 150 kg/ha N GS39: 75 kg/ha N |
Yes No |
|
Breeza 2012 |
Delayed N |
Longs Quicks |
23 - May 14 - June |
65 |
GS31: 150 kg/ha N GS39: 75 kg/ha N |
Yes No |
|
Gatton 2012 |
Sowing N |
Quicks |
19-June |
300 |
No N Treatments |
Yes |
|
Emerald 2012 |
Sowing N |
Longs |
19-may |
120 |
GS32: 120 kg/ha N GS50: 50 kg/ha N |
No |
|
Breeza 2013 |
Sowing N |
Longs Quicks |
20 – May 19– June |
95 |
Pre-sowing: 220 kg/ha N GS39: 35 kg/ha |
Yes Yes |
|
Breeza 2013 |
Delayed N |
Longs Quicks |
20 – May 19– June |
95 |
GS31: 220 kg/ha N GS39: 35 kg/ha N |
Yes Yes |
|
Gatton 2013 |
Sowing N |
Quicks |
28th May |
300 |
No N Treatments |
Yes |
|
Emerald 2013 |
Sowing N |
Quicks |
28th May |
100 |
Sowing: 100kg/ha N GS31: 100 kg/ha N |
Yes |
|
Emerald 2013 |
Delayed N |
Quicks |
28th May |
100 |
GS31: 100 kg/ha N GS39: 100 kg/ha N |
Yes |
|
Narrabri 2013 |
Delayed N |
Longs Quicks |
21st May 29th May |
110 |
GS31: 150 kg/ha N |
Yes |
|
*Soil N measured for 0-120cm depth at Breeza & Emerald, 0-180cm at Gatton, and 0-90cm at Narrabri |
||||||
Table 2. long season varieties - Yield (t/ha) & % lodged - for full details of this paper please see the attached document.
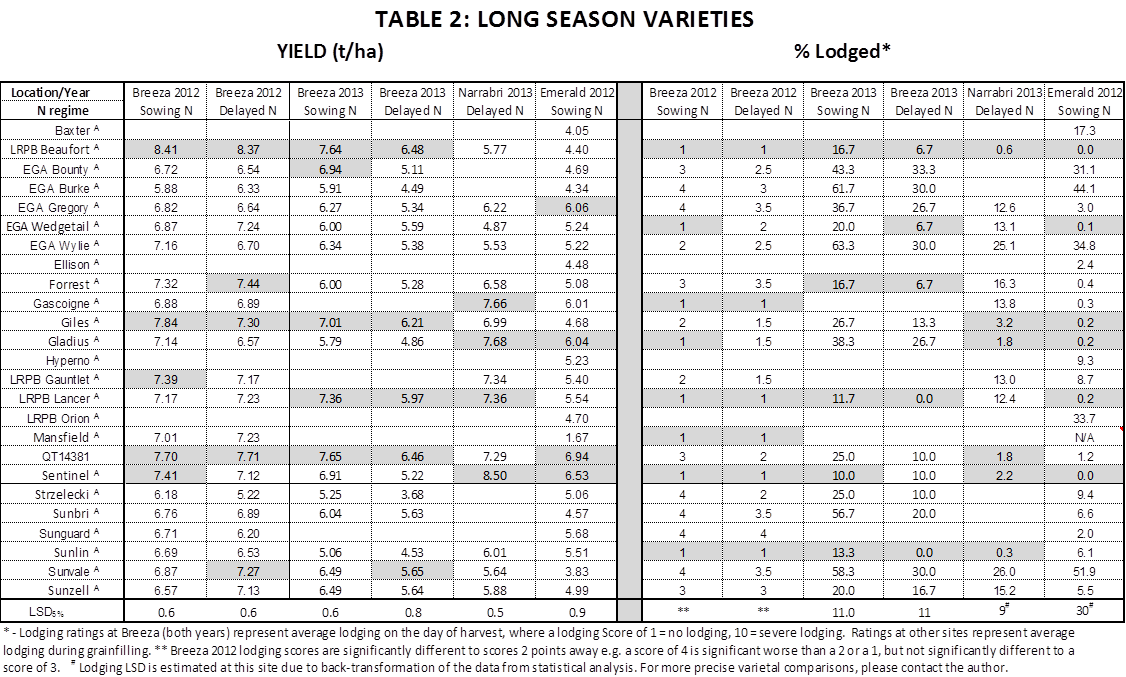
Table 3. Quick varieties - Yield (t/ha) - for full details of this paper please see the attached document.
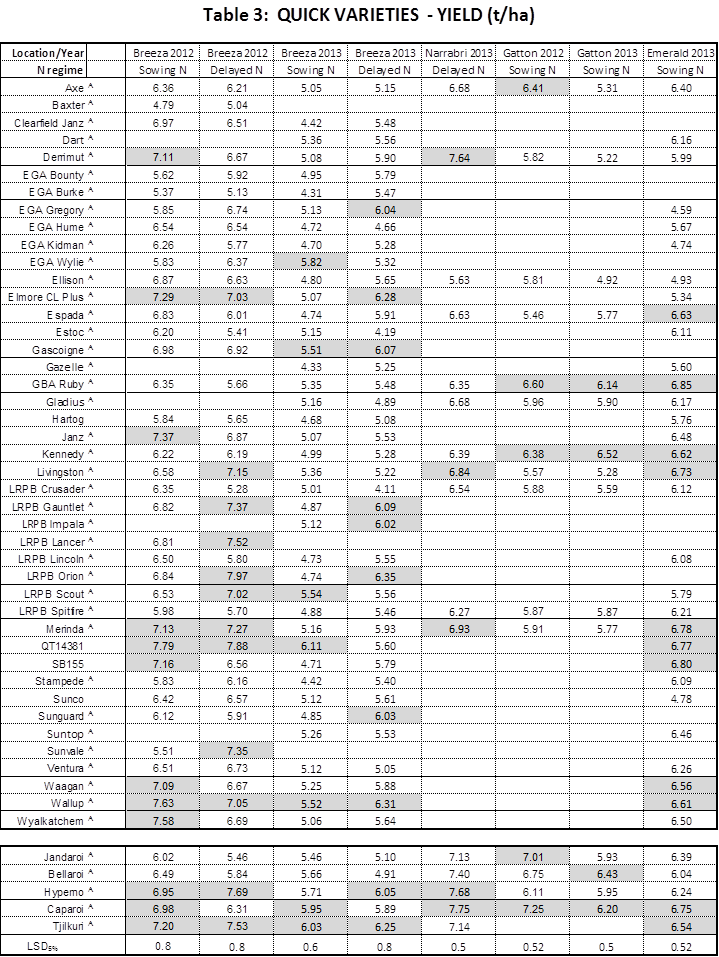
Table 4. Quick varieties - % lodged (for full details of this paper please see the attached document.)
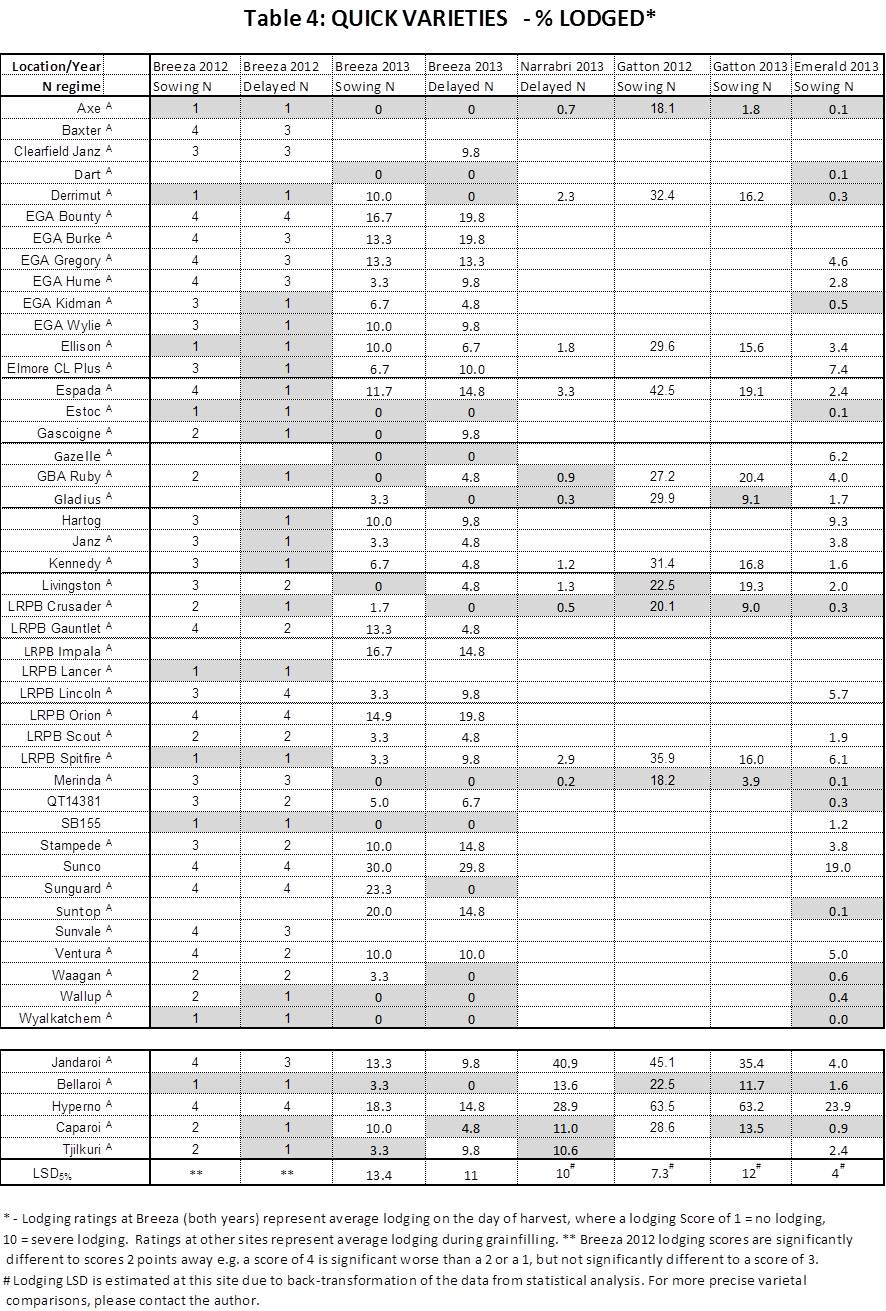
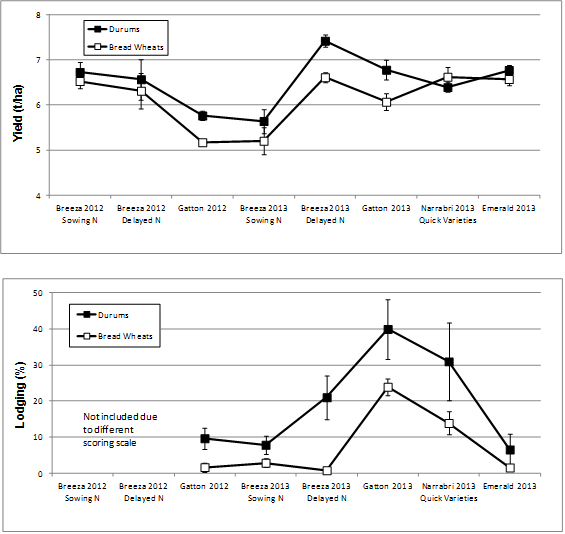
Figure 1. Comparative yields (a) and lodging (b) for 5 durum varieties vs 5 bread wheat varieties of similar maturity. Durum varieties were Hyperno![]() , Bellaroi
, Bellaroi![]() , Caparoi
, Caparoi![]() , Jandaroi
, Jandaroi![]() , Tjilkuri
, Tjilkuri![]() . Bread wheat varieties were Kennedy
. Bread wheat varieties were Kennedy![]() , LRPB Crusader
, LRPB Crusader![]() , Livingston
, Livingston![]() , Merinda
, Merinda![]() , GBA Ruby
, GBA Ruby![]()
Performance of plant growth regulators
The plant growth regulator mix was applied to a subset of varieties in most of our trials. The results for yield and lodging are summarised in Figure 2. At three locations (Breeza sowing N 2012 and 2013, plus Gatton 2013) the PGRs significantly increased yield across all varieties by approximately 0.5 t/ha on average – these trials all had high levels of N at sowing. At three other locations (each of which were delayed N trials), the PGRs increased yield of a small number of varieties (<3) but not others. Lodging was significantly reduced by the application of PGRs across all varieties in two experiments, and in some varieties (between 1 and 9 varieties) in three other experiments.
One variety at Emerald 2013 had significantly decreased yield in response to application of the PGRs, and another at Narrabri in 2013 had significantly worse lodging in response to PGR application. These were isolated occurrences and the varieties are not named because the results may have just been due to random, localised effects within the fields.
Protein results are only available for the three PGR experiments in 2012 – but it is interesting to note that protein was significantly higher in the ‘+PGR’ treatment at Breeza 2012, when yield was also higher (Figure 3).
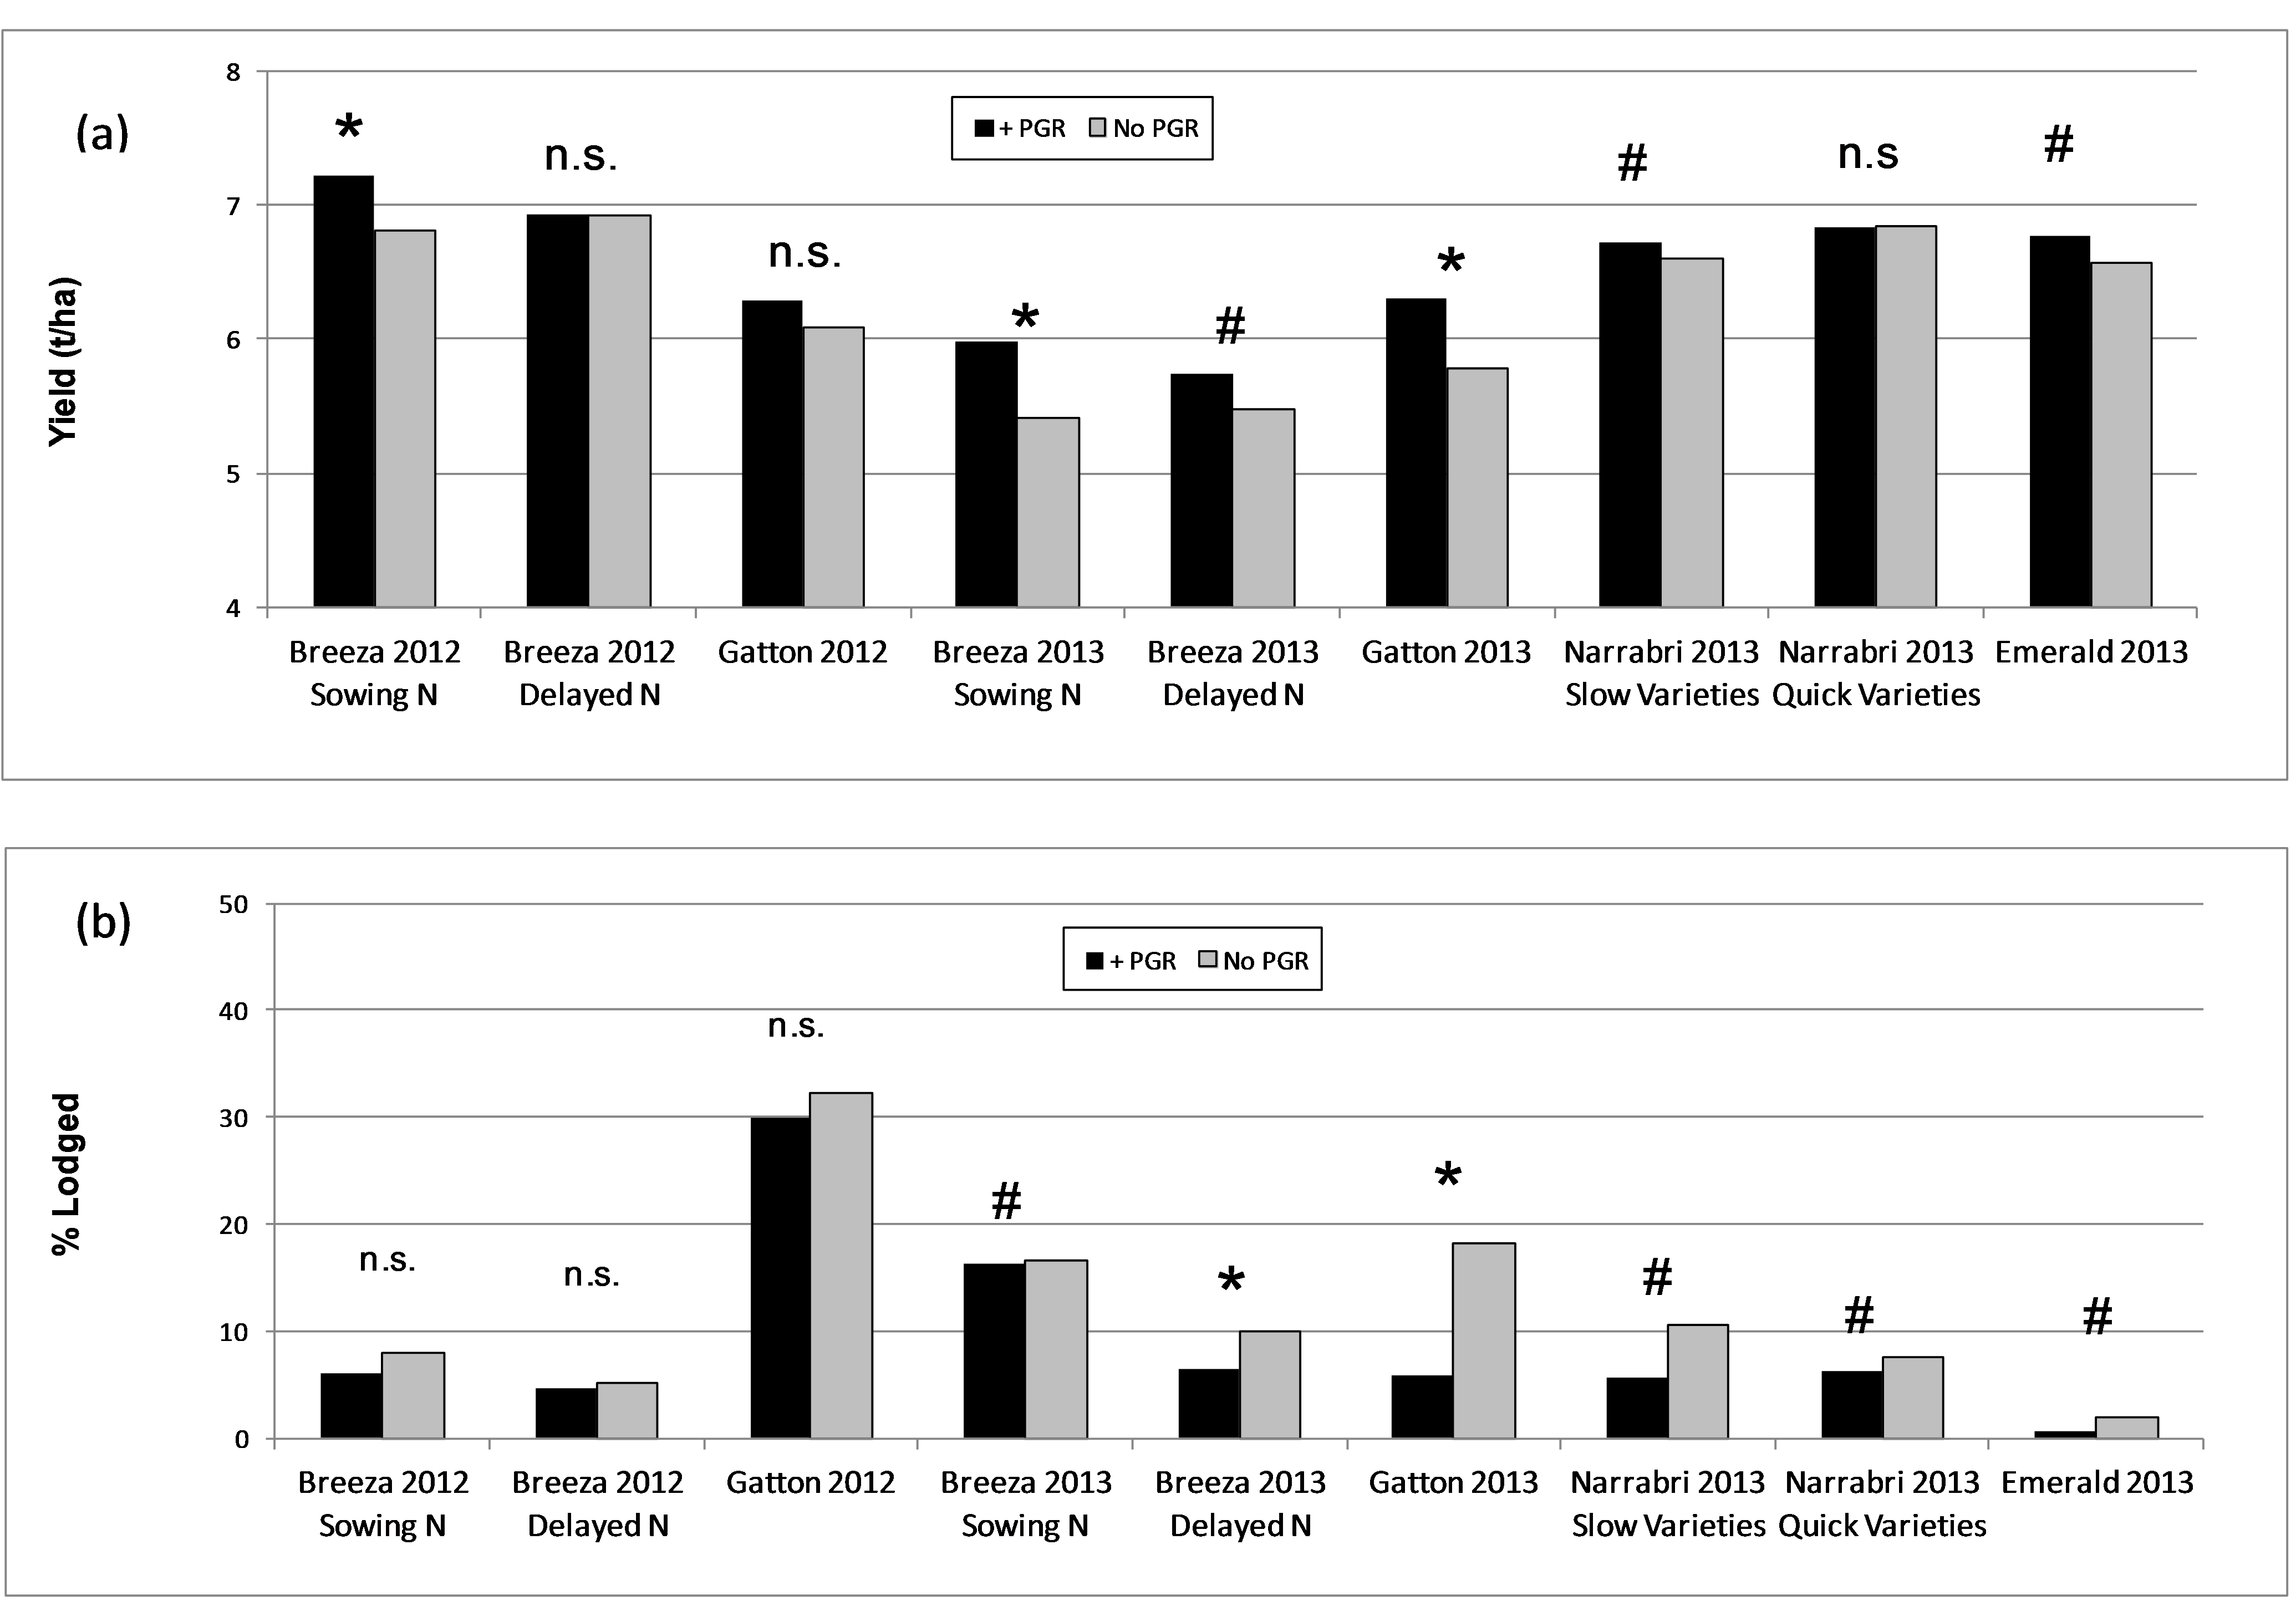
Figure 2. Plant Growth Regulator effect on (a) Yield and (b) Lodging
* = Significantly ‘statistically’ different, with 95% certainty, on average across all varieties.
n.s. = not significantly different.
# = significant interaction occurred, meaning a significant response was observed in some varieties but not others
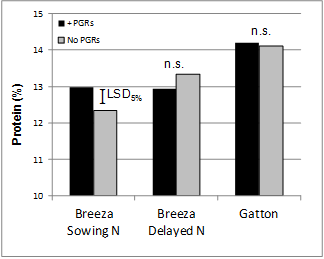
Figure 3. Effect of PGRs on protein at Breeza and Gatton in 2012
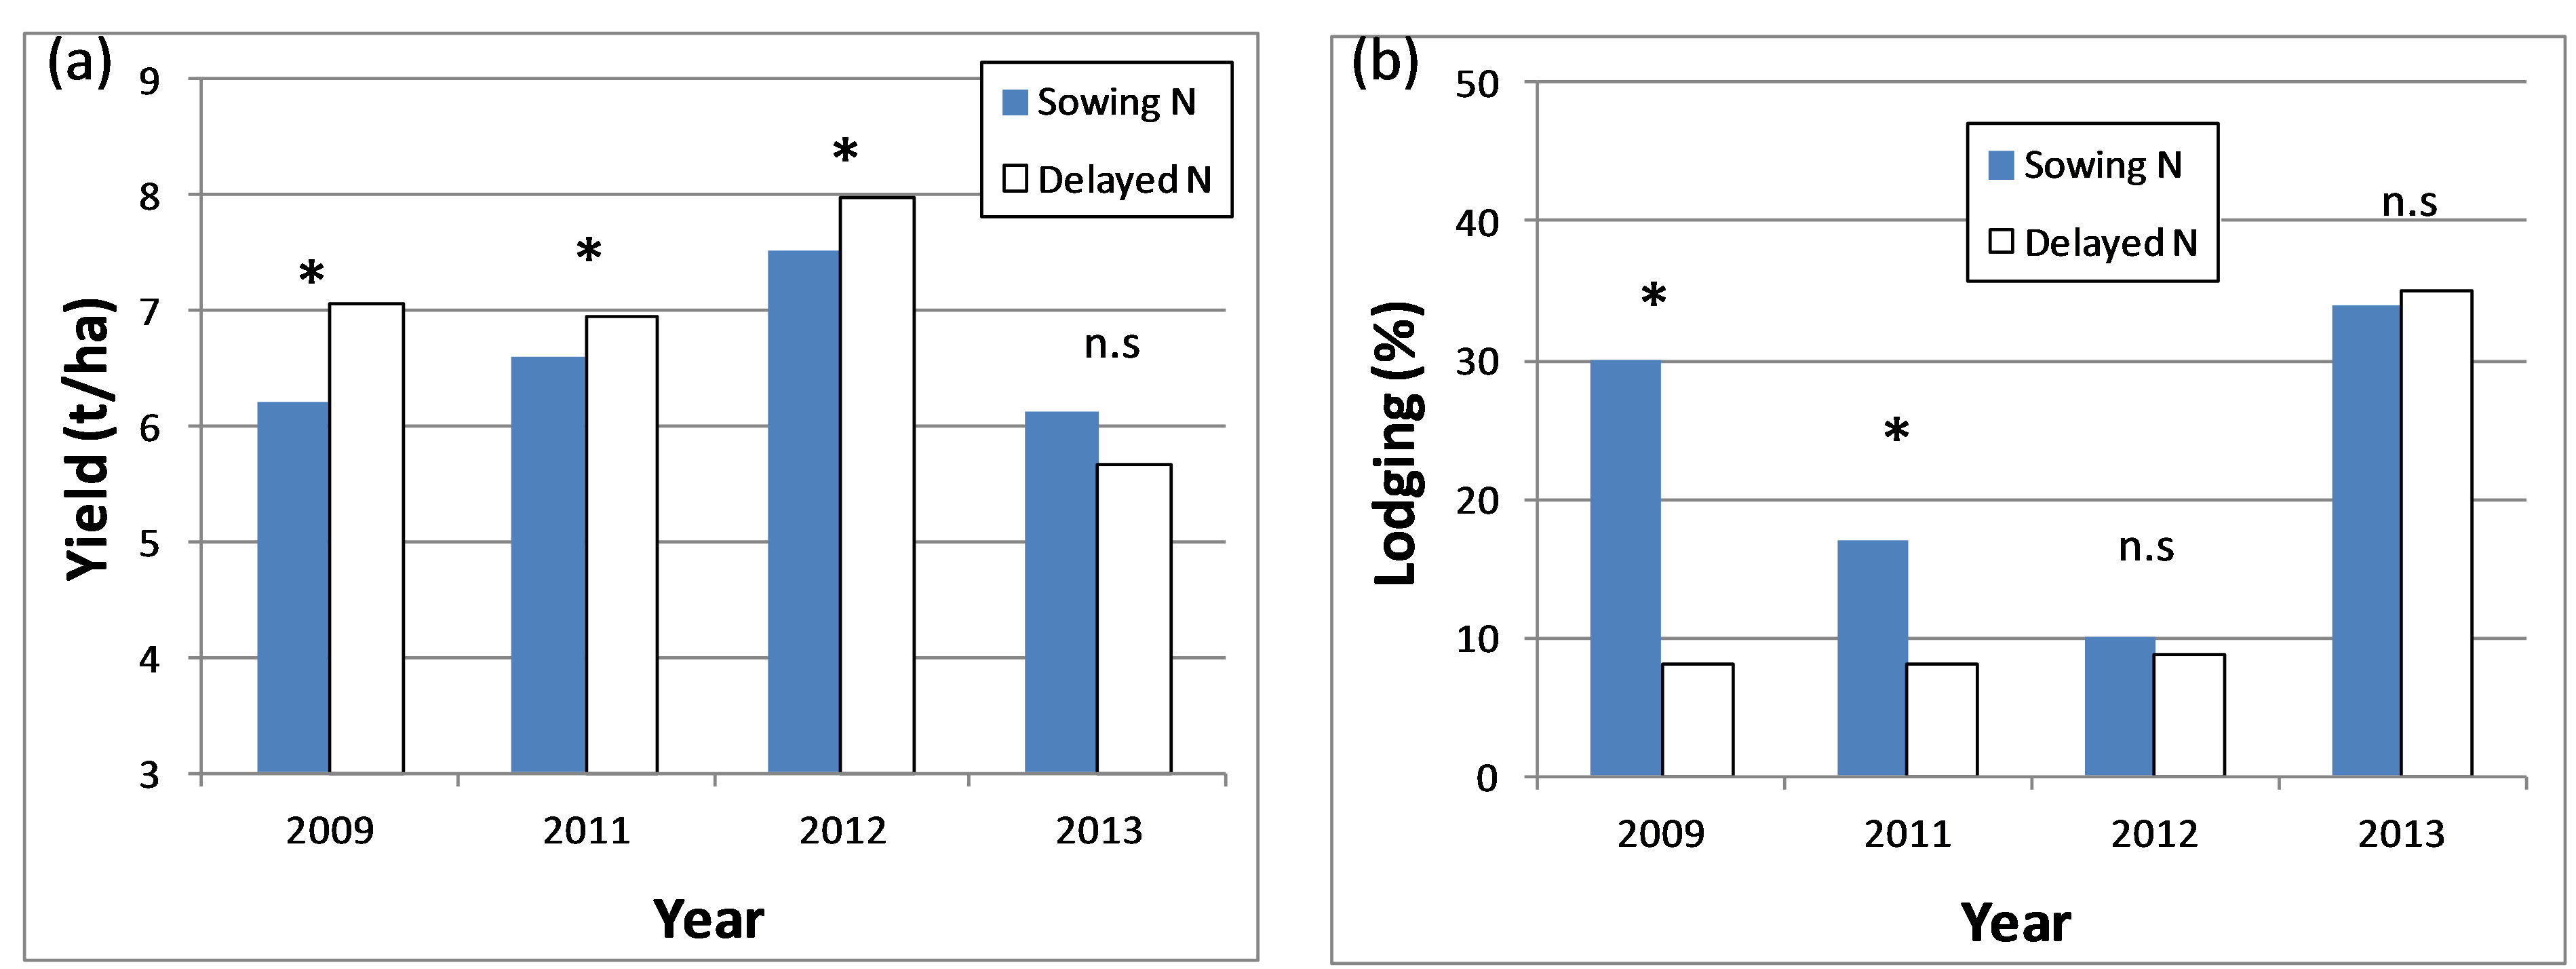
Figure 4. Effect of delayed N application on Kennedy![]() at Gatton (2009-2013) for
at Gatton (2009-2013) for
Yield and (b) Lodging
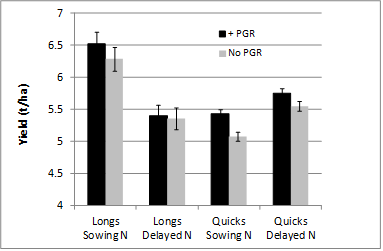
Figure 5. Interaction of N application timing, variety maturity group and PGRs at Breeza in 2013
Delayed N application
The in-season application of N is used worldwide to reduce lodging risk and increase yield in high yielding wheat production areas, and has previously been used successfully in the northern region. However in 2013 we observed some instances where it was associated with decreased yield. Figure 4 shows the effect of delayed N application on the yield and lodging of Kennedy![]() at Gatton across seasons of experiments. Unlike previous years, in 2013 Kennedy had a non-significant yield decrease associated with the delayed N treatment and no lodging benefit. Unusually warm weather during stem elongation at Gatton did cause an earlier than normal flowering response, and we suspect that this meant the delayed N application (at GS32) was not fully available for the critical growth period between flag-leaf and flowering which occurred sooner than in previous years.
at Gatton across seasons of experiments. Unlike previous years, in 2013 Kennedy had a non-significant yield decrease associated with the delayed N treatment and no lodging benefit. Unusually warm weather during stem elongation at Gatton did cause an earlier than normal flowering response, and we suspect that this meant the delayed N application (at GS32) was not fully available for the critical growth period between flag-leaf and flowering which occurred sooner than in previous years.
Figure 5 shows that a lower yield was achieved in the delayed N treatments in the long season varieties at Breeza in 2013. The long season varieties were subjected to prolonged water logging soon after sowing, probably experiencing N losses through de-nitrification. Subsequent lack of rainfall then seemed to delay the incorporation of in-season N application at GS31 (surface applied granular urea) which we suspect was not effectively incorporated by wetting the beds using the furrow irrigation. However the quick varieties still managed to yield better in the delayed N field – and it is uncertain as to why this occurred! We suspect that when rainfall finally incorporated the urea, quick varieties (sown later than ideal) were less advanced and better positioned to utilise the in-season N application than the long season varieties. Protein analysis (once completed) may shed some light on this trend.
Seasonal yield potential
The warm and dry conditions for 2012 and 2013 have made it more difficult for growers to achieve high yields in irrigation fields. Simulations using the APSIM model suggest that yield potential in 2013 was 1 t/ha lower than the long term average in QLD, due to the warm conditions experienced (Figure 6). Nevertheless, high yields have still been possible, with a paddock yield of 9 t/ha achieved in 2013 from a well irrigated commercial crop of Bellaroi at Quirindi.
A reminder on wheat water requirement
Along with lodging, insufficient irrigation water is another major limitation to achieving high wheat yields. Crop simulation studies have shown that the evapotranspiration water requirement of an 8 t/ha crop is approximately 5-600 mm/year, and this does not include storage, distribution or application of irrigation water. Much of this water use occurs in spring when the temperatures increase and the crop is fully developed, and wheat crops can use 6-8mm per day depending on whether spring temperatures are average, or above average (Figure 7).
Summary
Screening trials have been conducted to identify promising agronomy and variety combinations for achieving high yields under irrigation in the northern region. Detailed testing will now occur in order to optimise agronomic management for these varieties. 2013 was a challenging year in which to maximise yields due to the warm temperatures, although an impressive 9 t/ha was nevertheless achieved in a well irrigated crop of Bellaroi at Quirindi. Growers and agronomists are reminded that wheat requires substantial volumes of water to achieve maximum yields, with potential water use of 6-8mm per day in spring, and a season requirement of up to 550 mm of evapotranspiration water use.
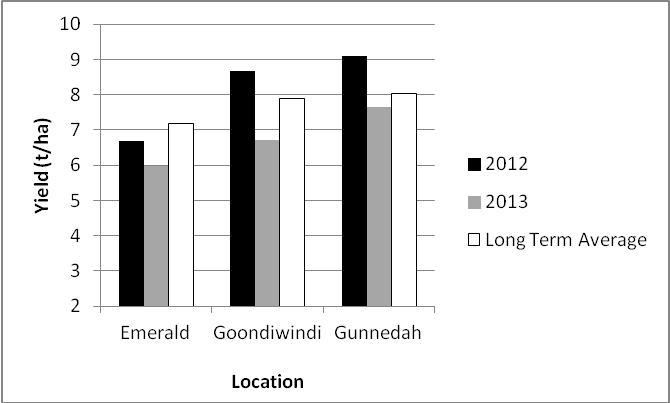
Figure 6. Simulated fully-irrigated wheat yield for Emerald, Goondiwindi
and Gunnedah in 2012 and 2013, compared to the long term average.
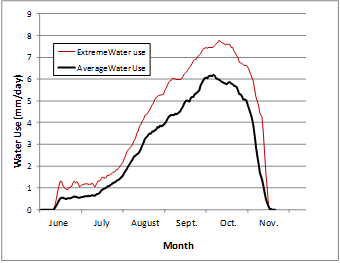
Figure 7. Simulated daily water use (evapotranspiration) for a fully irrigated, quick maturing wheat crop sown on June 8th at Wee Waa, based on long term climate data. The graph shows both average (all years) and extreme (top 10% of years) daily water use.
Contact details
Allan Peake
CSIRO Ecosystem Sciences and CSIRO Sustainable Agriculture Flagship
Ph: 07 4688 1137
Fx: 07 4688 1193
Email: allan.peake@csiro.au
Reviewed by
Dr James Hunt, CSIRO Plant Industry
![]() or A Varieties displaying this symbol beside them are protected under the Plant Breeders Rights act, 1994.
or A Varieties displaying this symbol beside them are protected under the Plant Breeders Rights act, 1994.
Was this page helpful?
YOUR FEEDBACK