Barley cultivars differ in their protein concentration
Author: Blakely Paynter and Andrew van Burgel - Department of Agriculture and Food WA | Date: 06 May 2014
Blakely Paynter and Andrew van Burgel, Department of Agriculture and Food Western Australia
Key messages
- Barley cultivars differ in their grain protein concentration and this can be independent of their grain yield.
- Buloke and Commander have a low grain concentration for their grain yield.
- Bass, Flinders and Wimmera have a high grain protein concentration for their grain yield.
Background and Aims
In Western Australia, malt barley receival standards require a grain protein concentration (GPC) between 9.5 – 12.5% (dry basis) for delivery as Malt1 and between 9.0 – 12.8% (dry bass) for delivery as Malt2. A question growers often ask is do barley cultivars differ in their GPC? The answer is yes. GPC is under genetic control (Emebiri et al. 2003, 2007; Moralejo 2004) and is influenced by management and the environment. Unlike hectolitre weight, grain plumpness and grain brightness, it is more difficult to say a cultivar is a low or high protein cultivar by just looking at the results of a couple of trials. This is because cultivars with a low GPC may be higher yielding and the differences observed may in fact be due to yield dilution rather than due to genetic differences in their GPC.
Monaghan et al. (2001) and Oury and Godin (2007) proposed that the deviation from the regression line between grain yield (GY) and GPC could be used to identify cultivars having a lower or higher GPC than expected from their GY. This deviation was called the grain protein deviation (GPD) and is illustrated in Figure 1.
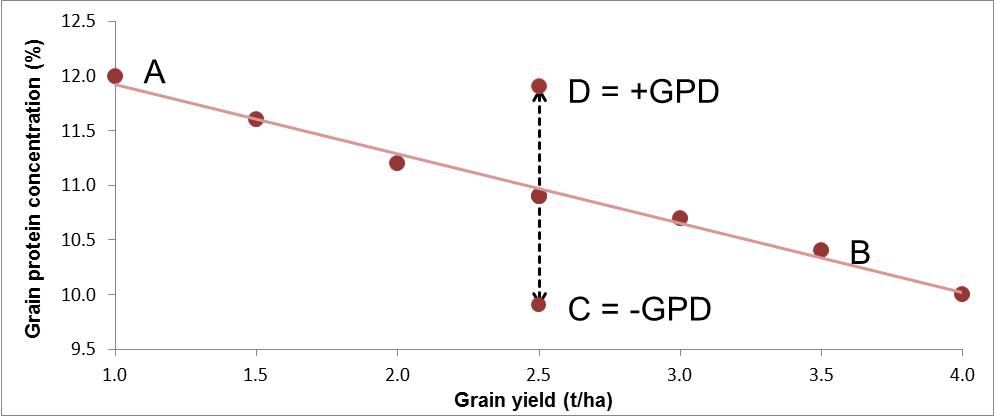
Figure 1 Example relationship between grain yield and grain protein concentration (A to B), with two cultivars having a negative (C) or a positive (D) grain protein deviation.
Using the South Australian NVT database (2010-2012) and by determining GPD as per Oury and Godin (2007), Porker and Wheeler (2013) found that Commander, Buloke and Scope consistently had a lower GPC than Schooner and Flagship, whilst Flinders consistently had a higher GPC than Schooner and Flagship. The question is, do those observations also hold true in Western Australia?
The aim of this paper was to use the CVT, NVT and barley agronomy databases (2005-2012) from Western Australia to compare barley cultivars for their inherent GPC or GPD. Cultivars inherently low in grain protein will require a different rotation and nitrogen management plan to a cultivar inherently high in grain protein.
Method
Data from variety trials (CVT (2005), NVT (2006-2012) and DAFWA-GRDC funded (DAW00148 and DAW00190) barley agronomy time of sowing trials (2006-2011)) were combined to analyse the relationship between GY and GPC in commercially available barley (malt, food and feed) cultivars grown under similar management and environmental conditions in Western Australia. Eight different datasets were developed and each dataset contained a differing set of cultivars and sites. For each dataset each site had the same set of cultivars. The number of cultivars common to a dataset ranged from 11 to 17 and the number of sites in each dataset ranged from 43 to 119.
To measure the extent that cultivars differed in their relationship between GY and GPC, residuals were derived from the linear regression of GPC on GY for each site in the dataset using GenStat for Windows (2013) 16th edition. The deviation used in the analysis of variance (ANOVA) was the percent residual (percent residual = actual grain protein – fitted grain protein) / fitted grain protein) rather than the standardised residual as used by Oury and Godin (2007) and Porker and Wheeler (2013). Percent residual normalises the variance in the dataset as GPC increases. Cultivar deviations were compared by ANOVA. A cultivar was considered to have a low or high GPD (p = 0.05) if its mean deviation was greater than 2 times the standard error of the ANOVA. Box plots of GPD (using raw residuals rather than percent residuals) were drawn using R (2013) version 3.0.2.
Results
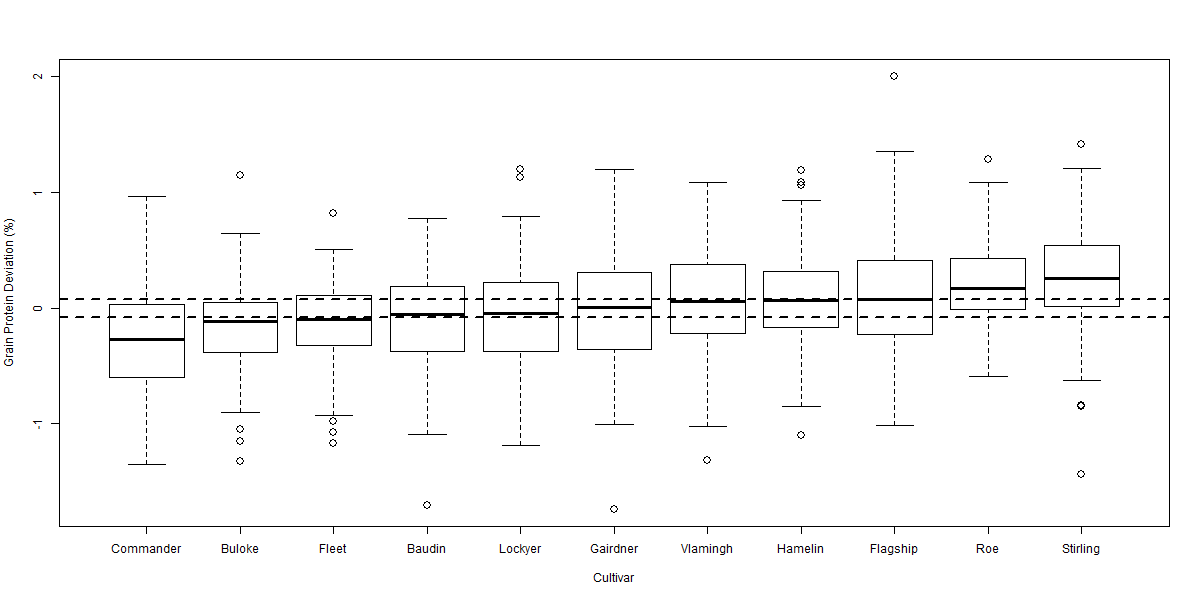
Figure 2 Boxplot of grain protein deviation comparing 11 cultivars over 114 sites from 2005-2009. Horizontal dotted lines highlight LSD (p = 0.05) of 0.08% relative to 0% (no grain protein deviation). LSD (p = 0.05) relative to another cultivar is 0.11%.
There was significant variability in the relationship between GY and GPC across the eight datasets. Despite this variability the ANOVA for each dataset indicated significant (p < 0.001) differences between cultivars in their GPD away from the GPC / GY regression. The box plot diagrams (Figures 2 to 5) show the distribution of GPD from the GPC / GY regression for four of the eight datasets analysed. The median GPD for a cultivar is depicted by the solid line within each cultivar’s box plot. Cultivars whose median GPD is below or above the horizontal dotted line has a GPD significantly different from 0% (p = 0.05).
GPD varied significantly among cultivars over the eight datasets from -0.57% in Commander to +0.48% in Bass. Commander, Buloke and Scope all consistently recorded significant negative deviations from the fitted regression line (Figures 2 to 5). Bass, Flinders and Wimmera all consistently recorded significant positive deviations from the regression line. Many cultivars (i.e. Baudin and Hindmarsh) did not consistently differ from the regression line indicating that their GPC could be explained by the average inverse relationship between GY and GPC. Some cultivars (i.e. Gairdner and Vlamingh) were variable in their deviation across the eight datasets. Table 1 tabulates the likely GPD expected for different malt, food and feed cultivars (summarised over the eight datasets) when grown in Western Australia once the influence of yield was removed.
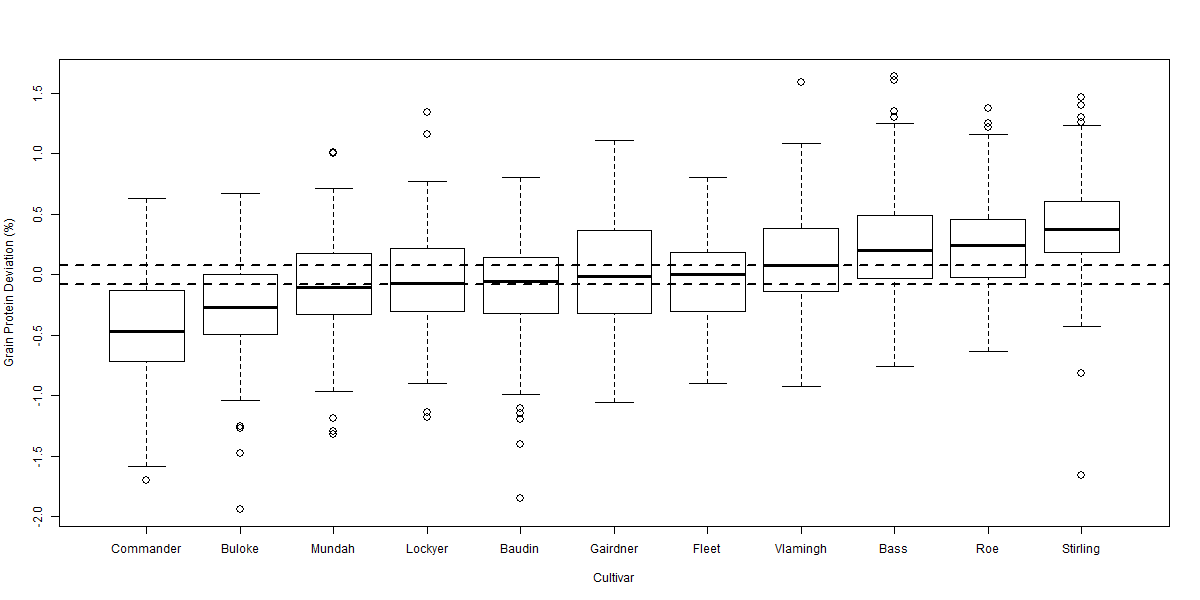
Figure 3 Boxplot of grain protein deviation comparing 11 cultivars over 119 sites from 2006-2012. Horizontal dotted lines highlight LSD (p = 0.05) of 0.08% relative to 0% (no grain protein deviation). LSD (p = 0.05) relative to another cultivar is 0.11%.
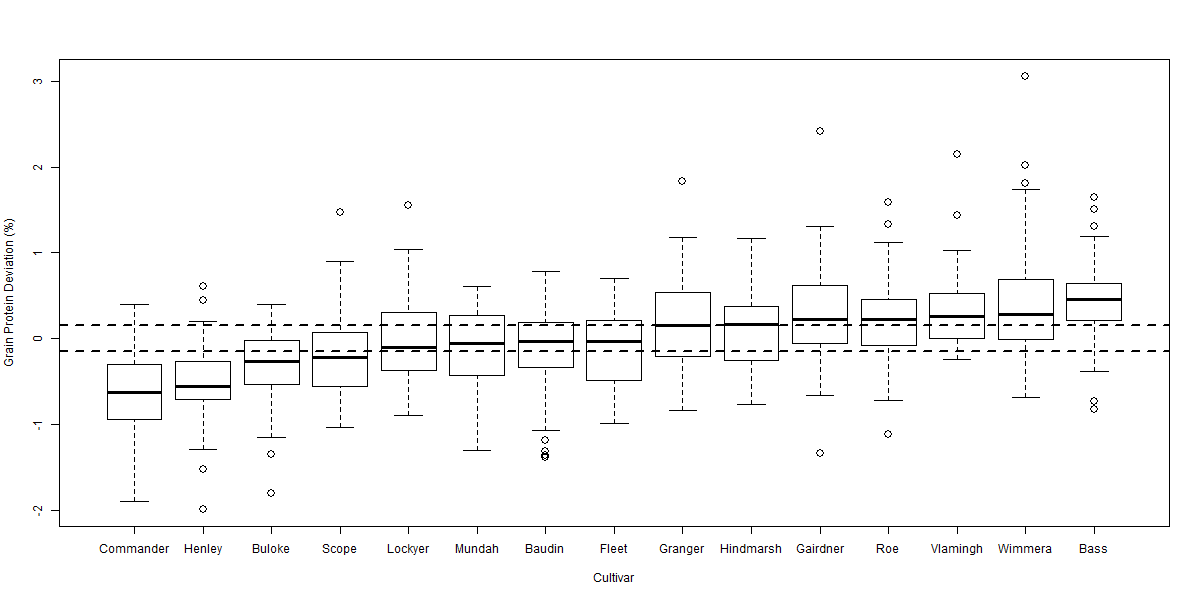
Figure 4 Boxplot of grain protein deviation comparing 15 cultivars over 45 sites from 2009-2012. Horizontal dotted lines highlight LSD (p = 0.05) of 0.14% relative to 0% (no grain protein deviation). LSD (p = 0.05) relative to another cultivar is 0.20%.
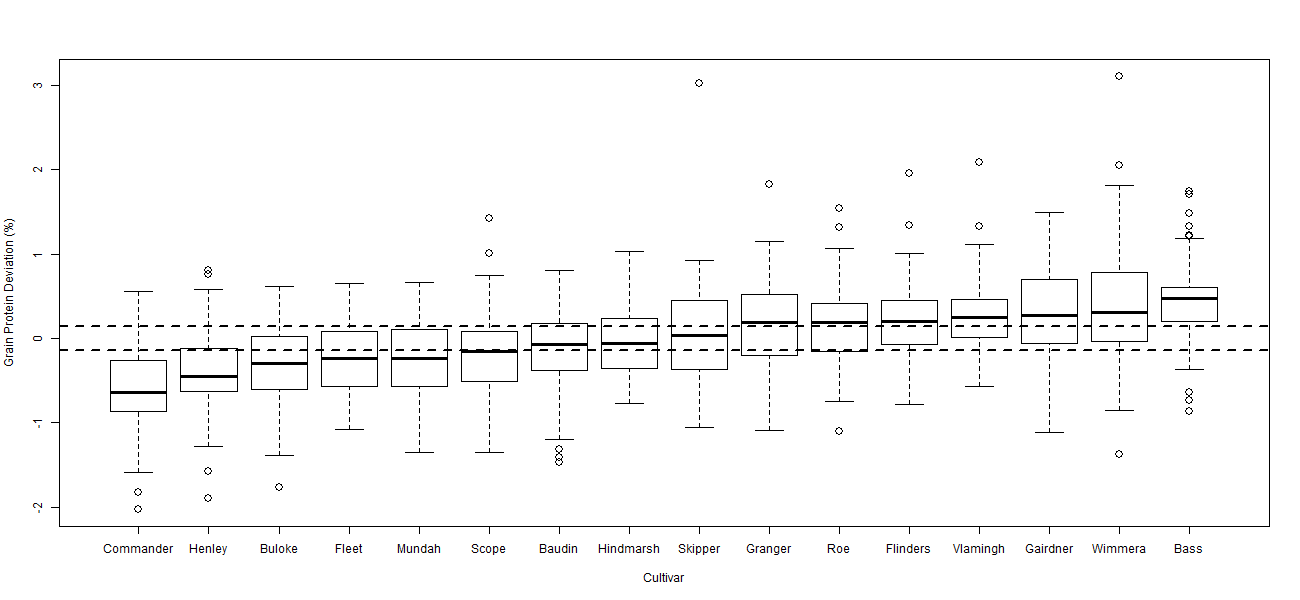
Figure 5 Boxplot of grain protein deviation comparing 16 cultivars over 53 sites from 2010-2012. Horizontal dotted lines highlight LSD (p = 0.05) of 0.14% relative to 0% (no grain protein deviation). LSD (p = 0.05) relative to another cultivar is 0.19%.
Table 1 Expected grain protein deviation (%, dry basis) for barley cultivars when grown in Western Australia after removing the influence of grain yield.
|
Ranking of grain protein deviation - Western Australia |
|||||||||||||||||||
|
Commander |
Oxford |
Henley |
Buloke |
Scope |
Fleet |
Mundah |
Lockyer |
Hindmarsh |
Gairdner |
Flagship |
Baudin |
Vlamingh |
Hamelin |
Granger |
Roe |
Flinders |
Wimmera |
Bass |
Stirling |
|
-0.6 to -0.3% |
-0.2 to |
No data |
+0.1 to |
+0.2 to +0.5% |
|||||||||||||||
|
-0.1% |
No data |
+0.2% |
|||||||||||||||||
|
lower protein |
No data |
No data |
normal |
|
No data |
|
higher protein |
||||||||||||
Conclusion
The results from this study concur with the South Australian observations of Porker and Wheeler (2013) indicating that for some cultivars differences in their GPC is not explained by differences in their GY alone. Different nitrogen management strategies may be required for some varieties (i.e. Bass and Commander) in order to maximise their chances of meeting industry standards for grain protein on receival.
REFERENCES
Emebiri LC, Moody DB, Black C, van Ginkel M, Hernandez E (2007). Improvements in malting barley grain yield by manipulation of genes influencing grain protein content. Euphytica 156: 185-194.
Emebiri LC, Moody DB, Panozzo JF, Chalmers, KJ, Kreteschmer JM, Ablett GA (2003). Identification of QTLs associated with variations in grain protein concentration in two-row barley. Australian Journal of Agricultural Research 54: 1211-1221.
Monaghan J, Snape J, Chojecki A, Kettlewell P (2001). The use of grain protein deviation for identifying wheat cultivars with high grain protein concentration and yield. Euphytica 122: 309–317.
Moralejo M, Swanston JS, Munoz P, Prada D, Elia M, Russell JR, Ramsay L, Cistue L, Codesal P, Casas AM, Romagosa I, Powell W, Molina-Cano JL (2004). Use of new EST markers to elucidate the genetic differences in grain protein content between European and North American two-rowed malting barleys. Theoretical & Applied Genetics 110: 116–125.
Oury FX, Godin C (2007). Yield and grain protein concentration in bread wheat: how to use the negative relationship between the two characters to identify favourable genotypes? Euphytica 157: 45–57.
Porker K, Wheeler R (2013). Managing grain protein; Cultivar specific responses to nitrogen. 16th Australian Barley Technical Symposium, Melbourne.
Key Words
grain protein concentration, grain protein deviation
acknowledgments
The authors acknowledge the support of CVT and NVT for access to their database, Andrea Hills for access to her time of sowing data and the technical support of Sue Cartledge, Teagan Gates, Aidon Sinnott and DAFWA Research Support Units.
GRDC Project No.: DAW00224
Paper reviewed by: Rick Graham, NSW Department of Primary Industries.
Was this page helpful?
YOUR FEEDBACK