Role of stubble managment on the severity and duration of frost
Author: Rebecca Jenkinson, Living Farm and Ben Biddulph, DAFWA | Date: 07 May 2014
Role of stubble management on the severity and duration of frost and its impact on grain yield.
Rebecca Jenkinson, Living Farm, and Ben Biddulph, DAFWA.
Key messages
- Increasing standing stubble biomass can increase the severity and duration of frost events.
- Greater frost severity and decreased yield is associated with more stubble in frost prone parts of the landscape.
- The exact amount or orientation of stubble which increases the severity of frost has not been well quantified and requires further research
Aims
To quantify the impact of stubble on the extent, severity and duration of frost and determine its effect on canopy temperature and grain yield.
Method
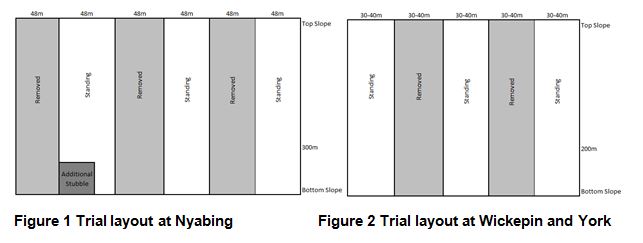
Precision Agriculture (PA) large scale field trials were conducted in wheat paddocks at Nyabing, Wickepin and York during 2013. Paddocks with a history of frost events over the last ten years were identified prior to seeding. Trials were sown using farmers’ broad acre seeding equipment, standard cultivar, rotation and agronomic management. Stubble treatments were replicated three times on plots 200m in length and 30-48m in width down the paddocks natural slope (Figure 1 & 2).
Nyabing
The Nyabing experiment was sown on the 23rd May with Yitpi wheat at 70kg/ha into stubble residue from a 0.8 t/ha canola crop on a site with a slope of 1m in 100m (Google Maps). Replicated treatments either had stubble removed or retained and left standing. In addition, an area 30m x 30m in the lowest part of the landscape was used to increase the stubble load was by adding mixed canola and barely stubble previously removed from the paddock (Figure 1). Stubble density during late tillering (mid-August) was 0.5t/ha for removed stubble treatments, 2.6t/ha for standing stubble treatments and 3.5t/ha in the additional stubble plot.
Wickepin
The Wickepin experiment (Figure 2) was sown on the 31st May with Mace wheat at 65kg/ha into standing (three replicates) and removed stubble (two replicates) residue treatments remaining after a 1.0-1.5t/ha wheat crop on a site with a falling slope of 1.7m in 100m (Google maps). Stubble density at sowing was approximately 4t/ha for standing stubble and <0.1t/ha for removed stubble.
York
The York experiment (Figure 2) was sown on the 20th May with Mace wheat at 75kg/ha into stubble (three replicates) and removed residue treatments remaining after a 1.9 t/ha wheat crop on a site with a falling slope of 4m in 100m (Google maps). Stubble density prior to sowing was approximately 2.2t/ha for standing stubble and <0.1t/ha for removed stubble.
Trial measurements
All sites were soil sampled for nutrition prior to sowing to a depth of 10 cm. Data loggers were installed along the slope in each plot to measure canopy temperature at a height of 600mm every 3 minutes from July until harvest using unshielded Tiny Tag Temperature loggers (TGP-4017). At Nyabing these were placed high and low in the landscape, while at York and Wickepin they were placed high, mid and low in the landscape due to the larger drop in slope across the trial site.
Plant counts were conducted six weeks after sowing at three randomly selected locations in each plot to assess crop emergence. From Zadok’s (Z) 40 (flag leaf sheath extending) onwards plots were assessed weekly for crop developmental stage and Normalised Difference Vegetative Index (NDVI readings. At Z65 (anthesis) biomass cuts (3 x 1m) were taken from 3 randomly selected areas of the plot to determine plant biomass. Additional biomass cuts were taken at Z89 (hard dough) for frost-induced sterility assessment, harvest index, 1000 grain weight and screenings. At crop maturity harvest cuts were taken using a small plot research header at both York and Wickepin sites. A total of six cuts per plot (harvest cut area approx. 26m2) were taken along the slope. At Nyabing an area of 60m x 288m was divided up into a checkerboard pattern of 6m long x 1.72m wide plots totalling 1656 plots. These were harvested with a small plot combine harvester and the results used to create a detailed spatial yield map.
Results
Crop establishment and development
Across the three sites there was no visible effect of stubble treatment on crop emergence or plant biomass measured at anthesis or maturity (data not presented). Standing stubble treatments generally flowered one-two days later than removed stubble treatments across all three sites due to lower canopy temperatures. While yield estimates based on the number of tillers and head numbers/m2 in October indicated a yield potential of 4t/ha at Nyabing, with the rainfall limited yield potential of 3.24t/ha, actual yields were lower at 2.5t/ha. This can mainly be attributed to frost damage as there were clear symptoms of frost damage and adequate grain filling rainfall. The yield potential at Wickepin and York was 4 and 5t/ha respectively, which was achieved and reflected the low levels of frost at these sites.
Nyabing
There were 6 frost events (hourly canopy temperature below 0°C) in September prior to and during flowering on the 20th-25th September, and then a further 9 frost events after flowering during grain development in October.
Low in the landscape the additional stubble treatment (3.5 t/ha) increased the severity (minimum temperature) of the frost (Table 1) and was on average 0.4 and 0.6°C colder than standing and removed treatments respectively . Low in the landscape also increased the duration of hours the canopy temperature was below -1 to -2 °C (Table 2). Standing stubble low in the landscape did not increase the duration of the frost event. By comparison, no differences in the severity or duration of frost events were evident with stubble treatments high in the landscape (Table 1). Temperature data from Nyabing demonstrated that 3.5 t/ha stubble increased the severity and duration of the frost in contrast to standing stubble at 2.6t/ha which itself increased the severity of the frost compared to 0.5 t/ha, but did not increase the duration of the frost.
Low in the landscape more visible signs of head frost such as aborted florets, rat-tailed heads, and stained heads and stems were evident on the additional stubble treatments from mid-October onwards. Yield data supported these differences, with this treatment yielding 0.6t/ha, standing stubble plots averaging 1.0t/ha and removed stubble plots returning 1.8t/ha (Table 3). Significant differences in yield were also evident between standing and removed stubble treatments high in the landscape (Table 3).
Assessment of frost induced sterility (FIS) and harvest index (HI) correlated with yield (FIS r2=0.717 and HI r2=0.655) and demonstrated higher sterility in the additional stubble plot (87%) when compared to standing and removed stubble treatments (Table 3).
In added stubble treatments the 1000 grain weight was very low at 16mg/grain (normally average grain weights 40mg/grain) and screenings were high (~60%). However no differences were evident in grain quality attributes between different landscape positions, or where stubble had been removed in comparison to standing stubble (Table 3).
Table 1 Minimum canopy temperature for frost events during September and October 2013 in Nyabing, recorded on Tiny Tag at 600mm height.
|
|
Low in the landscape |
High in the landscape |
|||
|
Dates |
Additional |
Stubble |
Removed |
Stubble |
Removed |
|
5th Sept |
-1.4 |
-1.1 |
-0.9 |
-0.2 |
-0.2 |
|
6th |
-2.9 |
-3.1 |
-2.9 |
-2.2 |
-2.5 |
|
9th |
-0.7 |
-0.2 |
-0.4 |
0.1 |
0.0 |
|
27th |
-1.9 |
-1.2 |
-0.9 |
-0.7 |
-0.8 |
|
28th |
-0.4 |
0.3 |
0.6 |
1.3 |
0.8 |
|
1st Oct |
-2.4 |
-2.3 |
-2.1 |
-1.5 |
-1.7 |
|
10th |
-3.1 |
-2.7 |
-2.6 |
-1.6 |
-2.0 |
|
12th |
-1.8 |
-1.8 |
-1.3 |
-0.5 |
-0.6 |
|
13th |
-5.0 |
-4.8 |
-4.4 |
-4.0 |
-4.3 |
|
14th |
-4.4 |
-4.0 |
-3.8 |
-3.1 |
-3.4 |
|
15th |
-2.5 |
-1.8 |
-1.5 |
-0.9 |
-0.9 |
|
17th |
-2.7 |
-2.0 |
-1.8 |
-1.3 |
-1.3 |
|
18th |
-1.2 |
-0.8 |
-0.8 |
0.6 |
0.4 |
|
21st |
-3.5 |
-2.7 |
-2.6 |
-2.1 |
-2.2 |
|
22nd |
-2.4 |
-1.9 |
-1.9 |
-0.7 |
-0.9 |
|
(LSD 0.17) AVG |
-2.4 |
-2.0 |
-1.8 |
-1.1 |
-1.3 |
Table 2 Number of hours below different temperature thresholds for frost events during September and October 2013 in Nyabing, recorded on Tiny Tag (TGP-4017) at 600mm height.
Within each temperature threshold, different letters represent significant differences (p<0.05).
|
Temp. threshold below |
Low in the landscape |
High in the landscape |
|||
|
Additional |
Standing |
Removed |
Standing |
Removed |
|
|
0°C |
58 a |
52 b |
58 a |
48 b |
50 b |
|
-1°C |
45 a |
33 b |
32 b |
22 c |
24 c |
|
-2°C |
27 a |
18 b |
16 b |
11 c |
11 c |
|
-3°C |
10 a |
8 a |
7 a |
2 b |
3 b |
|
-4°C |
2 a |
1 a |
1 a |
0 a |
0 a |
Table 3 Yield and quality data for Yitpi wheat at Nyabing in 2013.
Frost induced sterility (FIS), harvest index (HI), 1000 grain weight (1000GW) and screening <2mm were measured. Values are the predicted means (n=3) estimated using linear mixed models.
|
Position |
Low landscape |
High landscape |
|
|||
|
Stubble |
Additional* |
Standing |
Removed |
Standing |
Removed |
LSD0.05 |
|
Yield (t/ha)** |
|
|
|
1.9 |
2.5 |
0.40 |
|
Yield (t/ha) –map*** |
0.6 |
1.0 |
1.8 |
|
|
0.30 |
|
FIS (%) |
87 |
33 |
35 |
20 |
13 |
4.0 |
|
HI |
0.02 |
0.26 |
0.24 |
0.28 |
0.32 |
0.10 |
|
1000GW (mg) |
16 |
46 |
45 |
43 |
44 |
3.0 |
|
Screenings (%) <2mm |
56 |
9 |
9 |
13 |
13 |
5.5 |
*Additional stubble plot was un-replicated and was only located low in the landscape
**Yield estimated from small plot trial harvester cuts with 2 replicates per plot.
***Yield estimated from small plot trials harvester with 276 replicates per plot.
Wickepin and York
Insufficient frost events occurred at Wickepin and York trial sites to cause frost damage. Only one minor frost event was recorded at Wickepin and York with a minimum canopy temperature of -0.5°C. Frost-induced sterility for both sites was <10% indicating that both sites experienced only minor levels of frost damage. The Wickepin trial yielded 4t/ha and York 4.6t/ha, with no effect of stubble treatments.
Conclusion
- The severity and duration of frost increased at positions lower in the landscape and was more severe where stubble loads increased.
- Removing stubble (to <0.5t/ha) decreased frost damage and gave a yield advantage of 0.6-0.8t/ha with a greater response in the more frost prone, lower parts of the landscape.
- Increasing stubble loads can increase the severity and duration of frost in prone low lying areas of the landscape; however this is unclear higher in the landscape.
- Strategically decreasing stubble loads in the high frost-prone environments lower in the landscape may reduce the economic losses due to frost.
Key words
Frost, stubble, burning, grain sterility.
Acknowledgments
Rebecca O’Leary, DAFWA Statistician, Julianne Hill GRDC’s RCSN for funding, Albany and Kwinana port zones. Peter Hanson, The weather logger for installation maintenance and data acquisition of onsite weather stations. The following people are acknowledged for their significant contribution for the successful completion of the trials; Sarah Hyde, Facey Group, Fiona Martin, Nyabing Farm Improvement Group, Steve Curtin, ConsultAg, Gary Lang, Wyoming Downs, John Seabrook, Seabourne, Richard Devlin and Rebecca Clarke, Living Farm, Nathan Height and Mike Baker, DAFWA.
GRDC Project No.: DAW00234, SDI00019
Paper reviewed by: Richard Devlin, Frances Hoyle
Was this page helpful?
YOUR FEEDBACK