Smart no-till furrow sowing to optimise whole farm profit
Author: Paul Blackwell, James Hagan, Stephen Davies, Derk Bakker, David Hall - Department of Agriculture and Food WA - Margaret Roper, Phil Ward - CSIRO and Andrew Matthews - Conquest Ag | Date: 13 May 2014
Key messages
- Mitigation (annual management) of soil water repellency by no-till furrow sowing can be improved by wings on points or boots, sowing close to the previous row and banded wetter with knife points, and using better formulations on dry soil. Yield benefits can be about 5-20% (approx. $40-115/ha) and costs can be less than $10/ha.
- The optimal mix between amelioration and mitigation by smart no-till furrow sowing will differ between farms, depending on the severity and size of water repellent area as well as the cost and expected yield benefit of different treatment options.
- For general responses and costs, if 80% of the farm is affected by repellence, and 80% dry sown then modelling suggests the best distribution of $20 000/annum investment is about 40% to amelioration and 60% to mitigation. If 20% of the farm or less is repellent all investment should generally be in amelioration.
Aims
To improve the understanding of yield responses to improved no-till furrow sowing; overcoming problems from knife points, as outlined previously (Davies et al. 2012).
To use whole farm economic modelling to estimate optimum investment proportions in amelioration and mitigation for managing water repellent soils.
Methods and results
Field trials from 2011 to 2013 compared knife point sowing in dry repellent soil with winged points or boots, as well as some use of banded wetter formulations and sowing near or between previous rows. Table 1 shows the yield responses to modified points/boots or knife points with banded wetter for all trials. Most trials showed improved establishment and some crop growth and yield improvement. Most results come from the northern agricultural region, thus may be difficult to apply to dry sown crops in other regions. There is more data for banded wetting agents than for modified points or boots, because air seeders travelling at realistic seeding speeds are required to adequately assess modified point or boot performance. The data for winged boots may be skewed by a very high response in a very grass weedy site; a more realistic mean excludes this. Negative or nil response to banded wetter is often shown when the soil is mostly wet or there is much rain soon after seeding, a more realistic mean excludes these conditions. The data gives confidence of yield increases of about 5, 20 and 10% (approx. 140, 410 and 230 kg/ha; $40,$115 or $76/ha with wheat at $280/t) using smarter furrow sowing with winged points, winged boots or banded wetter with knife points respectively. Local testing is advised, due to unexplained variations in response for some soil types and rain patterns.
Using winged boot systems employing paired rows and sowing near the old row may be the most cost effective (costs are approx. $250/row) and least complex. Further investigation is needed to clarify the benefits of banded wetters with modified boots and points. Over three seasons (2011-2013) at Binnu on moderately repellent yellow sand, winged points and winged points with banded wetter have provided the best gross margins ($123 and $114/ha respectively, compared to the next best of spading $95/ha); wheat/lupins/canola rotation with $300, $200 and $500/t for wheat lupins and canola respectively, wet/dry/dry sown, costs of $1/ha (points), $10/ha/year (weak penetrant wetter) and $150/ha (spading).
Table 1 Yield responses to winged points, boots or banded wetters. GSR= growing season rainfall. Bold change = 95% confidence, italic change = 90% confidence. Mean values of each group are also calculated with values <90% confidence of response =0.
|
site soil crop & year
(sown into drysoil or soil with dry patch; *= wet when sown)
|
GSR mm | knife point t/ha | change kg/ha | change % |
|---|---|---|---|---|
|
Grain yield responses to winged points |
||||
|
Badgingarra deep sand wheat 2012 |
325 |
1.17 |
-20 |
-2 |
|
Binnu deep sand lupin 2012 |
98 |
1.54 |
70 |
5 |
|
Badgingarra sandy gravel wheat 2012 |
325 |
1.76 |
250 |
14 |
|
Binnu deep sand wheat 2011 |
308 |
2.68 |
370 |
14 |
|
Binnu deep sand canola 2013 |
112 |
0.92 |
110 |
12 |
|
Esperance sand wheat 2012 |
265 |
1.01 |
0 |
0 |
|
Esperance sand canola 2013 |
376 |
2.08 |
70 |
3 |
|
Means (P<90%=0) |
|
|
142 |
6 |
|
Grain yield responses to winged boots with twin rows |
||||
|
Badgingarra sandy gravel wheat 2011 |
485 |
3.89 |
290 |
7 |
|
Badgingarra sandy gravel wheat 2012 |
325 |
1.76 |
400 |
23 |
|
Badgingarra deep sand wheat 2011 |
485 |
2.91 |
570 |
20 |
|
Badgingarra pale deep sand wheat 2012 |
325 |
1.17 |
890 |
76 |
|
Esperance sand canola 2013 |
376 |
2.08 |
70 |
3 |
|
Mean with very high value |
|
|
538 |
30 |
|
Mean without very high value (P<90%=0) |
|
|
415 |
19 |
|
Grain yield responses to banded wetter (penetrant or with retaining chemistry) |
||||
|
Binnu sand lupin 2011 |
308 |
2.3 |
190 |
8 |
|
Binnu sand lupin 2012 |
98 |
1.54 |
174 |
11 |
|
Binnu sand canola 2013 |
112 |
0.92 |
15 |
2 |
|
Mingenew sand wheat 2013 |
304 |
1.76 |
58 |
3 |
|
Badgingarra sand wheat 2012 |
325 |
1.10 |
350 |
32 |
|
Badgingarra sandy gravel wheat 2012 |
325 |
1.51 |
430 |
28 |
|
Badgingarra sand canola 2012 |
325 |
0.56 |
150 |
27 |
|
Badgingarra sand lupin 2012 |
325 |
2.11 |
260 |
12 |
|
Badgingarra sandy gravel lupin 2012 |
325 |
2.07 |
100 |
5 |
|
Badgingarra sandy gravel canola 2012 |
372 |
1.40 |
-10 |
-1 |
|
Warradarge sand barley 2012 |
372 |
1.65 |
-170 |
-10 |
|
Cordering loamy gravel, barley 2012 |
322 |
4.65 |
-160 |
-3 |
|
Nyabing loam barley 2012 |
222 |
2.76 |
-110 |
-4 |
|
Cranbrook loamy sand barley 2012 |
291 |
2.39 |
450 |
19 |
|
Frankland gravelly loam wheat 2012 |
295 |
2.76 |
490 |
18 |
|
Frankland sand wheat 2012 |
295 |
1.06 |
-340 |
-32 |
|
South Stirlings sand barley 2012 |
236 |
2.36 |
550 |
23 |
|
Esperance sand wheat 2012* |
252 |
1.01 |
70 |
7 |
|
Esperance sand canola 2013 |
376 |
2.08 |
0 |
0 |
|
all sites mean |
|
|
131 |
8 |
|
means (P<90%=0) |
|
|
227 |
10 |
Growers cropping water repellent soil often observe that sowing on or close to rows of previous crop can enable considerably better establishment in some seasons. Field trials and observations have shown similar effects (Roper et al. 2013 and Davies et al. 2012). Fig. 1 shows some of the extreme benefits that have been observed and can be captured with sufficient matching of row spacing between seasons and accurate steering systems to place seed in the wetter soil among the dead roots of the crop in the old row. Preceding rain is not essential for this method to be effective, post-seeding rain is diverted to the seed zone by remnant root systems from the old row when the root system remains sufficiently intact.
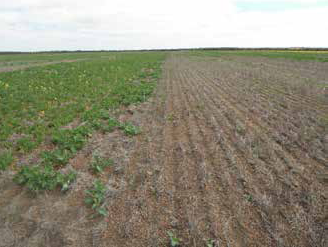
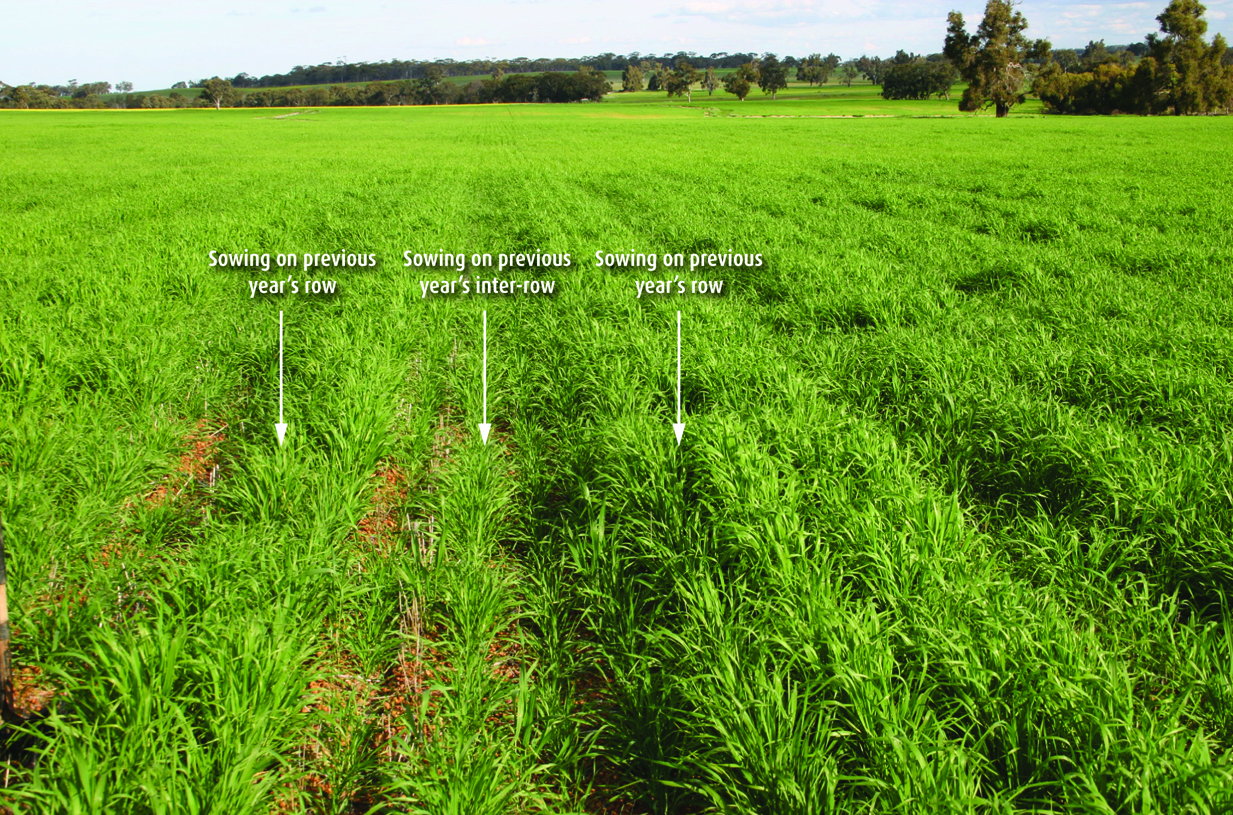
Figure 1 Extreme benefits observed for on-row seeding in water repellent soil. (A) Canola crop sown into old furrows (left of photo) and between the old rows (right of photo). Source: Paul Hislop and Derk Bakker. (B) Barley crop where seeder width was not matched to previous year’s row width. Source: Margaret Roper.
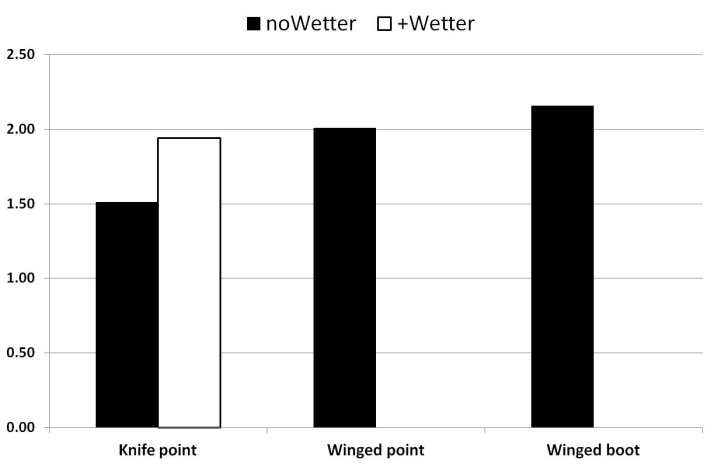
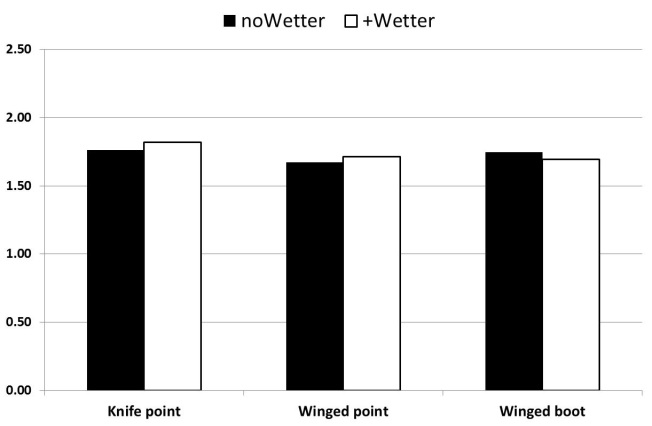
Figure 2 Extreme comparisons of wheat yield (t/ha) for winged points, boots or banded wetters when dry sowing severely repellent soil, left in 2012 at Badgingarra on gravelly sand with much weed competition and right in 2013 at Mingenew into pasture on sand when very heavy rain (2 x 20mm in 20 minutes) at emergence caused much furrow fill and some erosion. Winged boot was also twin row sowing. Badgingarra 95% Lsd = 0.435 t/ha Mingenew 95% Lsd = 0.119 t/ha.
The most extreme yield response contrast (Fig. 2) emphasised the risks of furrow fill after very heavy rain on dry sown pasture. Knife point furrows filled less and avoided small (~90 kg/ha) yield penalties in wheat. At Badgingarra without erosion and with a brome grass burden, smarter furrow sowing provided about 500 kg/ha wheat yield benefit. Part of the yield response with a winged boot came from better weed competition by paired rows.
Some evidence has been collected for increased knife point seeding speed grading more repellent material from the seed zone and a wheat yield increase of 244 kg/ha (16%) benefit from a 5 to 8 km/h speed change after dry sowing. Opposite effects have been seen for canola, presumably due to different seed depths. Water and nutrient retention chemistry in experimental banded wetter has increased wheat yield by 100-300 kg/ha in 3 trials; 2012 at Badgingarra (2) and 2013 at Mingenew when sown dry into severely non-wetting sand.
Whole farm profit calculations
To estimate the effect of having a fixed annual investment in better management of non-wetting and varying the proportion in mitigation or amelioration, we used a simple spreadsheet model and an annual investment of $20 000. The farm had 5 000 ha 75% cropped, an annual wheat yield of 2 t/ha @$280/t, 600 kg/ha reliable annual benefit from amelioration @ $150/ha and 10% yield benefit from mitigation by smarter furrow sowing @ $5/ha (including any costs of steering systems, points, boots, or banding kit or wetter). The amelioration benefit was assumed to last 10 years and mitigation one year.
Results of the whole farm analysis are shown in Fig. 3 for different proportions of repellent soil and different proportions of dry sowing.
- The peaking of the function is due to larger areas being dry sown than areas being ameliorated in early years (large area x small benefit>small area x large benefit)
- If 80% of the farm is repellent, and 80% dry sown then modelling suggests the best distribution of investment is around 40% to amelioration, and 60% to mitigation.
- A small per cent of repellent hectares is less likely to benefit from investing in mitigation in conjunction with amelioration, not only due to the lesser hectares to spread cost over, but due to amelioration further reducing the area which is able to benefit from mitigation treatments.
- The consequences of not getting the mix of options right for dealing with water repellent soils could be forgone profits of up to about $900 000 over 10 years.
- Progressive farm amelioration will shift investment proportion in progressive years in the same way as less on-farm repellency. 100% investment in amelioration will be most profitable.
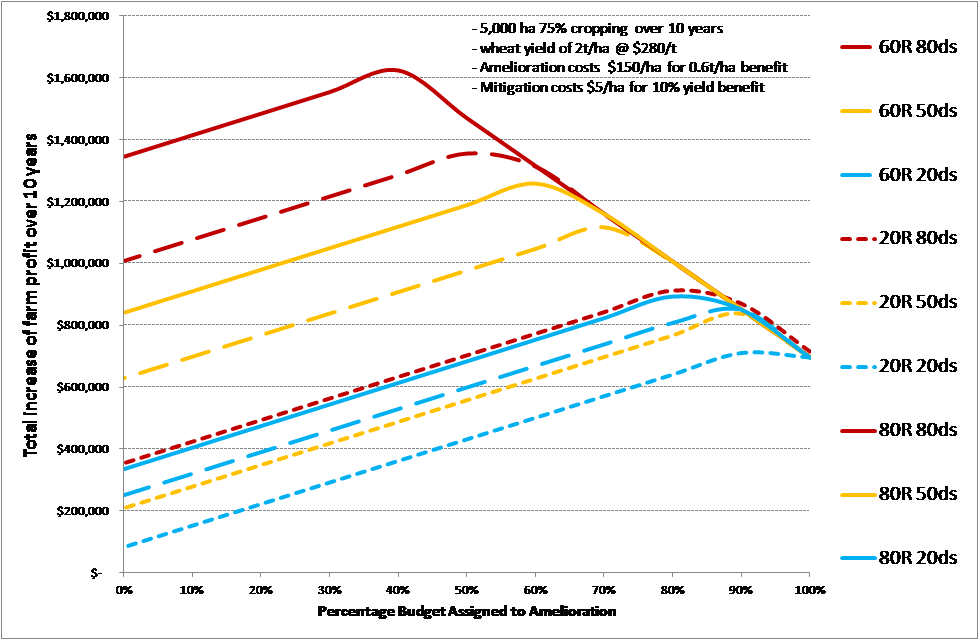
Figure 3 Summary of modelled estimate of whole farm profit increase over ten years influenced by the distribution of $20 000 per year investment in amelioration and mitigation. Profit is calculated for 20, 60 or 80% of the cropped area repellent (20R, 60R, 80R) and for each case 20, 50 or 80% of the cropping program dry sown (20ds, 50ds, 80ds). Costs of amelioration are amortised over 10 years.
- Reducing mitigation benefit and increasing amelioration benefit and annual investment level will remove the optimum peaks and investment in 100% amelioration will be most profitable.
-
The analysis is very sensitive to the % area repellent and the % area dry sown, thus
- Large cropping programs reliant on dry sowing need more investment in mitigation.
- Cropping in relatively wet growing seasons and relatively small repellent area need investment priority in amelioration
-
Other priorities can over-ride this general analysis
- Herbicide resistant weed control and drought stress reduction from buried topsoil can prioritise amelioration with inversion ploughing.
- Need for early establishment in warm conditions can prioritise smart improved dry furrow sowing, banded wetters and sowing near the previous row.
- Low confidence in the profitability or farming in future seasons will tend to prioritise investment in mitigation.
- Cropping leased land will encourage investment in only mitigation.
- As a general rule the more hectares that are repellent the more money should be assigned to mitigation, due to mitigation options largely having a fixed cost; such as different points on the seeding bar. The more hectares the cost is spread over, the more attractive the investment.
- Local variation is revealed in two contrasting farm cases. For one farm near Mullewa, overriding herbicide resistance priority maximises inversion ploughing investment. For the other farm near Lake Grace, high frequency of hay cutting maximises smart furrow sowing with on-row sowing and banded wetter.
- The purpose of this modelling is not to give specific advice other than determining what the best mix of options are for your situation.
- As with all farm based solutions, the best method of evaluating the usefulness of any solutions is to trial it on your farm, this analysis has used average yield responses for both Amelioration (600 kg/ha) and Mitigation (10%) based on a number of trials across the wheatbelt, however the range of these results for Amelioration goes from -0.3 t to +2 t/ha with a large proportion of results between 200 kg/ha and 700 kg/ha, mitigation results also vary however to a lesser degree (table 1).
Conclusions
- No-till furrow sowing can be smarter by wings on points or boots, sowing close to the previous row and banded wetter with better formulations on dry soil. Yield benefits can be 10-20% (approx. 150-420 kg/ha) and costs can be less than $10/ha. Sowing close to the old row can also be very effective. Benefits of smarter furrow sowing tend to be less reliable in cooler wetter and longer growing seasons.
- The optimal mix between amelioration and mitigation will differ between farms, depending on the severity and size of water repellent area as well as the cost and expected yield benefit of different treatment options. Much profit can be forgone if a sub-optimal investment mix is used.
Key words
Non-wetting soil, furrow sowing, on-row sowing, whole farm profit, amelioration, mitigation
References
Roper MM, Ward PR, Keulen AF, Hill JR (2013) Under no-tillage and stubble retention, soil water content and crop growth are poorly related to soil water repellency. Soil & Tillage Research 126, 143–150.
Davies S, Blackwell P, Bakker D, Scanlan C, Roper M, Ward P (2012) Developing and assessing agronomic strategies for water repellent soils. In 'Agribusiness Crop Updates'. (Department of Agriculture and Food and the Grains Research and Development Corporation: Perth, W. Aust.)
Acknowledgments
Host farms for trial sites & Tuncoat, Primary Sales, Sacoa, SST, Chemsol, Nutrian and DAFWA RSUs
GRDC Project No (DAW00204)
Paper reviewed by: Glen Riethmuller
Was this page helpful?
YOUR FEEDBACK