Alternative phosphorus fertiliser trial
Author: Colin McMaster | Date: 29 Jul 2014
Take home messages
- High-analysis granular fertiliser (MAP) was the most profitable phosphorus (P) source.
- Liquid forms of P performed well, but high purchase price reduced profitability.
- Rock phosphate did not have a positive effect on grain yield (averaged over three years) or residual soil P.
- Additional biological inoculants applied to rock phosphate did not significantly improve response greater than MAP.
- Consider long term implication of P fertiliser source and application rate. If P rates are reduced the residual soil P benefit will also be reduced.
- Growing season rainfall will impact crop response to freshly applied P.
- Growers must consider fertiliser effectiveness and cost ($) per unit of P when considering P fertiliser source.
Background
Due to the combination of drought and highly volatile fertiliser prices many growers within southern NSW have started to explore the use of alternative P sources and nutritional programs.
Traditionally in southern NSW, growers have banded all their granular high-analysis fertiliser at sowing with fungicide treated seed. It is generally accepted that approximately 20-30 per cent of fertiliser P banded at sowing is available in the first year and the residual amount becomes available in subsequent crops (Price, 2006).
The exact ratio of how much P gets locked up will vary depending on soil characteristics such as soil texture, soil acidity/alkalinity and availability of aluminium, iron and calcium.
The potential of a soil to lock up P is estimated by the phosphorus buffer index (PBI). The majority of soil types within Southern NSW have low PBI values indicating that much of the applied P will become plant available over time.
The combination of paddock history, crop type (root morphology and Vesicular Arbuscular Mycorrhizal, VAM), sowing date (early or late sown) and soil test results have proven to be beneficial tools in predicting individual paddock responsiveness to freshly applied fertiliser P.
Growers and advisers are now being challenged by a new hypothesis which claims further fertiliser efficiencies can be gained for southern NSW.
Some biological advocates promote the use of rock phosphate products in conjunction with “microbe friendly” seed treatments and “biological inoculants”. It is claimed that the improved biological health of the soil will unlock some of the tied up P and enhance the effectiveness of applied P fertiliser.
Conventional understanding of rock phosphate suggests it is only appropriate for slow growing grass or tree crops and only successful on acidic soils (White, 1979) with high rainfall (Bolland 2007).
Interest in liquid P fertilisers is also developing due to the increased efficiencies of liquid P over granular P on the alkaline calcareous soils of South Australia (McBeath, 2005). These efficiencies are yet to be proven in the common soil types of Southern NSW, as the presence of topsoil limestone is not considered regionally significant.
Trial aim
Evaluate the effectiveness, profitability and residual benefit of various phosphate fertiliser sources over a four year period.
Treatments
From 2009 to 2011 a range of phosphorus fertilisers products (Table 1) were applied over the same plot (1.8m x 20m) for three consecutive winter crop seasons. The fourth season relied on residual P with no fertiliser P applied in 2012.
Rates: 0, 5, 10 and 20 kg/ha P
Table 1. Fertiliser source/product details.
|
Phosphorus Source |
P% |
$/tonne |
$/kgP |
|---|---|---|---|
|
Hi – analysis – MAP (granular) |
22 |
$950 |
$4.32 |
|
Rock phosphate (granular) |
12 |
$775 |
$6.46 |
|
Phosphoric acid (liquid) |
16 |
$2,231 |
$13.94 |
|
Polyphosphate (liquid) |
23 |
$3,214 |
$13.98 |
(Notes: *Basal applications of nitrogen applied as urea to balance all treatments. * Fertiliser costs derived from 2009 prices)
An additional “systems” trial was conducted to evaluate the impact of “microbe friendly” seed treatments and “biological” inoculants to rock phosphate fertiliser (Table 2).
Table 2. Additional products used in “Systems” trial.
|
Fertiliser treatment |
Additional product applied |
Application details |
$/ha |
Key aim of product |
|
|
Seed/Foliar |
Rate |
||||
|
Rock phosphate |
Broad spectrum inoculum of compost microbes |
Seed |
5lt/t |
0.91 |
Re-inoculate the rhizosphere with a broad spectrum inoculum to improve the soils natural organic cycle with beneficial fungi and bacteria |
|
Broad spectrum inoculum of compost microbes |
Foliar |
% lt/ha |
18.49 |
Re-inoculate the phyllosphere (leaf surface) with a broad spectrum inoculum to maximise flower boom, flower retention and harvest yield |
|
|
Hi-analysis granular (MAP) |
Raxill |
Seed |
1 lt/ha |
1.58 |
Control bunts and smuts |
Site details
The trial site was located 35km north west of Forbes, central NSW. The trial design was a randomised complete block (four replicates) and laid out as a single row.
Table 3. Trial site details.
|
Soil type |
Colwell P |
PBI |
Total inorganic P |
|
Grey Vertosol |
15 mg/kg |
106 mg/kg |
62 mg/kg |
|
Total P |
Organic P |
pH (CaCl2) |
Free lime present |
|
252 mg/kg |
190 mg/kg |
7.6 |
Yesa |
a Free lime present within topsoil, estimated between 1-5%.
Table 4. Monthly rainfall (mm).
|
Year |
Jan |
Feb |
Mar |
Apr |
May |
Jun |
Jul |
Aug |
Sep |
Oct |
Nov |
Dec |
|---|---|---|---|---|---|---|---|---|---|---|---|---|
|
2009 |
14 |
37 |
38 |
60 |
5 |
83 |
30 |
10 |
13 |
13 |
20 |
75 |
|
2010 |
10 |
163 |
42 |
49 |
45 |
32 |
58 |
47 |
50 |
67 |
85 |
98 |
|
2011 |
8 |
70 |
83 |
25 |
34 |
12 |
17 |
57 |
23 |
56 |
139 |
102 |
|
2012 |
35 |
179 |
128 |
37 |
60 |
44 |
43 |
15 |
33 |
7 |
18 |
14 |
Trial results
Table 5. Grain yield and Colwell P soil test results.
|
Fertiliser treatment |
2009 – Wheat yield (kg/ha) |
2010 – Wheat yield (kg/ha) |
2011 – Canola yield (kg/ha) |
2012 – Wheat yield (kg/ha) |
2011 – Colwell P (mg/kg) |
|||||||||
|
Nil P 0kgP/ha |
1652 |
a |
4153 |
100% |
a |
1378 |
100% |
a b c d e f g |
4224 |
100% |
a |
14.7 |
100% |
a b |
|
MAP 5kgP/ha |
1434 |
a |
4654 |
110% |
b c |
2027 |
147% |
a b c d e f g |
4570 |
108% |
c d e |
16.5 |
100% |
b c d |
|
MAP 10kg P/ha |
1520 |
a |
4723 |
114% |
b c d |
2175 |
158% |
a b c d e f g |
4536 |
107% |
b c d |
17.3 |
100% |
c d e |
|
MAP 20kgP/ha |
1504 |
a |
5058 |
122% |
d |
2368 |
172% |
a b c d e f g |
4798 |
114% |
e |
20.9 |
100% |
f g |
|
RP 5kgP/ha |
1533 |
a |
3991 |
96% |
a |
1557 |
113% |
a b c d e f g |
4149 |
98% |
a |
15.5 |
100% |
a b c |
|
RP 10kg P/ha |
1637 |
a |
4093 |
99% |
a |
1726 |
125% |
a b c d e f g |
4314 |
102% |
a b |
13.4 |
100% |
a |
|
RP 20kgP/ha |
1576 |
a |
4165 |
100% |
a |
1872 |
136% |
a b c d e f g |
4213 |
100% |
a |
15.0 |
100% |
a b |
|
Ezy NP 5kgP/ha |
1681 |
a |
4333 |
104% |
a b |
2041 |
148% |
a b c d e f g |
4200 |
99% |
a |
15.9 |
100% |
b c d |
|
Ezy NP 10kg P/ha |
1608 |
a |
4598 |
111% |
b c |
2304 |
167% |
a b c d e f g |
4323 |
102% |
a b c |
17.5 |
100% |
c d e |
|
Ezy NP 20kgP/ha |
1551 |
a |
4851 |
117% |
c d |
2346 |
170% |
a b c d e f g |
4628 |
110% |
d e |
19.3 |
100% |
e f |
|
Polyphos 5kgP/ha |
1724 |
a |
4579 |
110% |
b c |
2195 |
159% |
a b c d e f g |
4337 |
103% |
a b c |
18.1 |
100% |
d e |
|
Polyphos 10kg P/ha |
1667 |
a |
4750 |
114% |
c d |
2315 |
168% |
a b c d e f g |
4612 |
109% |
d e |
18.9 |
100% |
e f |
|
Polyphos 20kgP/ha |
1517 |
a |
4785 |
115% |
c d |
2323 |
169% |
a b c d e f g |
4582 |
108% |
d e |
22.6 |
100% |
g |
|
CV% |
14% |
|
5.8% |
|
8.9% 289.1 |
|
3.8% |
|
9.4% 2.3 |
|||||
|
LSD (P=0.05) |
317.3 |
|
397.7 |
|
|
250.4 |
|
|||||||
(Notes: *All seed was treated with either Raxill® on wheat or Jockey® + Gaucho® on canola, *No fertiliser was applied in the 2012 wheat trial to measure impact of residual P)
Table 6. Fertiliser treatment gross margin.
|
Fertiliser type and rate |
Gross margin ($/ha) |
$/ha benefit over the Nil P |
||||
|
Year 1 |
Year 2 |
Year 3 |
Year 4 |
Total |
||
|
Nil P |
$90 |
$591 |
$319 |
$732 |
$1,732 |
|
|
MAP 5 |
$25 |
$651 |
$622 |
$811 |
$2,109 |
$378 |
|
MAP 10 |
$21 |
$661 |
$674 |
$803 |
$2,160 |
$428 |
|
MAP 20 |
-$26 |
$685 |
$728 |
$864 |
$2,251 |
$519 |
|
RP 5 |
$34 |
$526 |
$376 |
$714 |
$1,651 |
-$81 |
|
RP 10 |
$23 |
$514 |
$428 |
$752 |
$1,717 |
-$14 |
|
RP 20 |
-$54 |
$464 |
$437 |
$729 |
$1,576 |
-$156 |
|
Ezy NP 5 |
$27 |
$557 |
$581 |
$726 |
$1,890 |
$159 |
|
Ezy NP 10 |
-$58 |
$540 |
$643 |
$754 |
$1,879 |
$148 |
|
Ezy NP 20 |
-$209 |
$451 |
$524 |
$824 |
$1,591 |
-$140 |
|
Polyphos 5 |
$35 |
$606 |
$658 |
$758 |
$2,057 |
$325 |
|
Polyphos 10 |
-$46 |
$571 |
$648 |
$821 |
$1,993 |
$262 |
|
Polyphos 20 |
-$215 |
$438 |
$513 |
$814 |
$1,550 |
-$182 |
(Notes: * Variable costs (not including fertiliser) used for 2009 wheat = $240/ha, 2010 wheat = $240/ha, 2011 canola = $370/ha and wheat 2012 = $240/ha. *Refer to Table 1 for various fertiliser costs. * Grain price received for 2009 wheat = $200/T, 2010 wheat = $200/T, 2011 canola = $500/T and 2012 wheat = $230/T)
Grain yield response
On average, grain yield was significantly affected by fertiliser source (P<0.001) and rate (P=0.001). The average grain yield over the three year period was 2.65t/ha. The highest average yield was achieved by MAP at 20kgP/ha at 3t/ha (Figure 1).
Grain yield responded positively with increasing application of MAP and both forms of liquid (Ezy NP & Polyphos) with similar response curves (Figure 1). For example the MAP fertiliser treatment at five, 10 and 20kgP/ha increased grain yield on average by 329 kg/ha, 469kg/ha and 631kg/ha respectively.
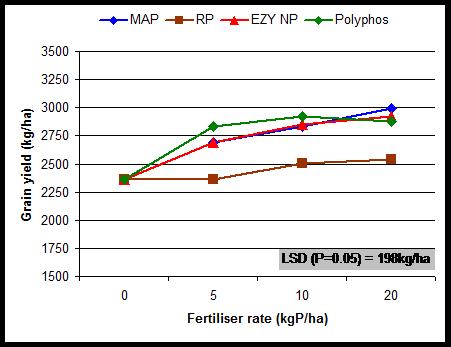
Figure 1. Averaged grain yield response of fertiliser treatments over three year period.
Averaged across three years there was no significant yield benefit from rock phosphate fertiliser, however in one season alone (2011) the 10 and 20kgP/ha rate did produce a significant yield benefit of 348kg/ha and 494kg/ha over the nil P treatment (Table 5). This grain yield benefit was not carried over into the following year (2012).
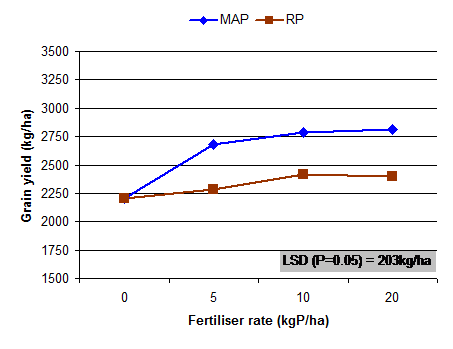
The addition of biological inoculants (Table 2) did not improve rock phosphate response greater than MAP in this trial (Figure 2).
.
Figure 2. Averaged grain yield response over 3 year period comparing MAP to Rock phosphate + biological inoculants.
Table 5 illustrates the impact of seasonal conditions on P response. Grain yield at the high P rate responded by zero % in 2009 (drought year), 22% in 2010 (high in-crop rainfall), 72% in 2011 (average in-crop rainfall) and 14% in 2012 (No P applied to any treatment).
Residual P build up
Residual P benefit was measured via soil testing after two crops following the 2010 wheat crop (Figure 3) and also by measuring grain yield in 2012 (Table 5) as no P fertiliser was applied to that wheat crop.
Residual soil P (Colwell).
Residual soil P levels ranged from 14.7mg/kg to 22.7mg/kg and differed significantly with fertiliser source (P<0.001), rate (P<0.001) and interaction between fertiliser source and rate (P=0.02).
The greatest residual benefit was from the high P rate (20kgP/ha) of Polyphos and MAP, with a respective increase of 7.9mg/kg and 6.2mg/kg over the nil P treatment (Figure 3).
Residual P levels under MAP application increased as the rate increased. The 5kgP/ha, 10kgP/ha and 20kgP/ha increased residual levels by 1.8mg/kg, 2.6mg/kg and 6.2mg/kg respectively.
Rock phosphate did not increase soil P levels.
Both liquids (Ezy NP & Polyphos) had similar residual response to the MAP treatment. However, Polyphos (20kgP/ha) did have a significant (P<0.001) residual benefit of 3.3mg/kg over the 20kgP/ha Ezy NP treatment (Figure 3).
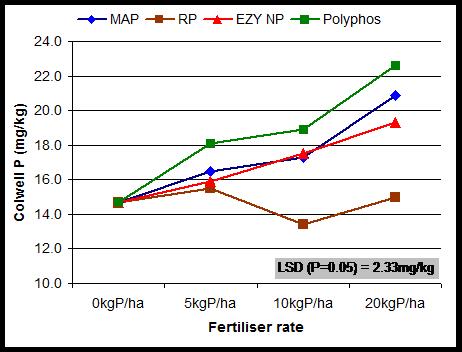
Figure 3. Residual soil phosphorus after the first 2 wheat crops.
Residual grain yield (2012).
2012 grain yield was significantly affected by the fertiliser source (P<0.001) and rate (P<0.001) for the previous three seasons.
The highest grain yield in 2012 was achieved where MAP at 20kgP/ha was applied in the 2009-2011 seasons, with an increase of 574 kg/ha over the nil P treatment.
The five, 10 and 20 kg/ha P rates of MAP produced a yield benefit of 346kg/ha, 312kg/ha and 574kg/ha respectively over nil P treatment.
There was no significant yield benefit above nil P in 2012 where rock phosphate had been applied in the previous three seasons.
Both liquid products produced similar yield response to MAP fertiliser. However, Ezy NP at 5kgP/ha did produce a yield reduction of 370kg/ha when compared to MAP at 5kgP/ha, and 137kg/ha reduction when compared to Polyphos.
Profitability
Profitability was affected by fertiliser source and application rate and ranged from -$182/ha to $519/ha (Figure 4).
Cost ($/kg P) of the various fertiliser sources was $4.32kg/P for MAP, $6.46kg/P for Rock phosphate, $13.94kg/P for Ezy NP and $13.98kg/P for Polyphos (Table 1).
The most profitable treatment over the four year period was 20kgP/ha of MAP, with a total benefit of $519/ha over the nil P treatment.
MAP produced a positive monetary return across all three rates and grain yield increased as fertiliser rate increased. The five, 10 and 20 kg/ha P rates increased profitability (over three years) by $380/ha, $430/ha and $510/ha respectively.
Rock phosphate treatments produced a negative monetary return across all three rates. The 5kgP/ha, 10kgP/ha and 20kgP/ha rate reduced profitability by -$81/ha, -$14/ha and -$156/ha respectively. It was more profitable to apply no fertiliser than apply rock phosphate.
Both forms of liquid phosphate (Ezy NP and Polyphos) produced a positive monetary return at the lower rates of 5kgP/ha and 10kgP/ha and a negative monetary return at the higher rate of 20kgP/ha (-$140/ha & -$182/ha respectively).
Polyphosphate was more profitable at 5kgP/ha and 10kgP/ha than Ezy NP, with a benefit of $166/ha and $114/ha above Ezy NP.
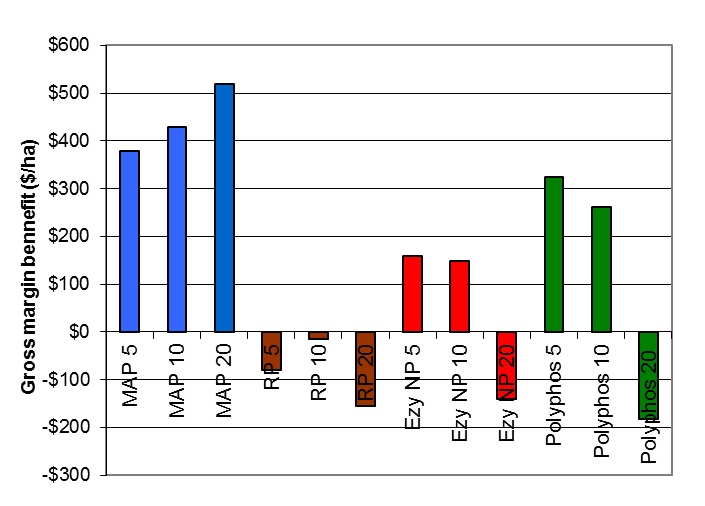
Figure 4. Gross margin benefit ($/ha) of fertiliser treatments over the nil P treatment over 4 years.
These results do not consider the additional cost associated to convert machinery for liquid P application, or the additional freight cost required for less concentrated P sources. For example rock phosphate would need approximately twice the quantity of product to provide the same quantity of P as MAP.
Discussion
These results highlight a number of important factors when making phosphate fertiliser decisions
1. Selecting a phosphate fertiliser source that is both cheap and effective
Growers must consider cost per kg of P compared to cost per tonne of product, as this greatly influenced profitability within this trial. MAP and both forms of liquids had similar response curves, however MAP was significantly more profitable due to lowers cost per unit of P.
Fertiliser source needs to become plant available to become effective. These results indicate that high-analysis granular fertiliser and both forms of liquid P respond positively and similarly, whilst rock phosphate was unresponsive and not available for plant uptake. Therefore rock phosphate fertiliser was both ineffective and expensive in the four years that it was evaluated in this trial. The addition of biological inoculants did not improve rock phosphate response greater than MAP in this trial.
Another consideration is the relationship between freight costs and the concentration of P within a fertiliser. For example MAP fertiliser at 22%P will require less tonnes/freight cost than rock phosphate at 12%P.
2. There will be long term implications
Fertiliser source and rate will impact on both the current season as well as future years.
An advantage of purchasing cheap and effective P is that you can buy more P for the same $ value, which allows greater flexibility in future years. As residual P increases, rates can safely be reduced with knowledge of the local P calibration curve.
Residual P benefit will decline if fertiliser rates are reduced to allow for more expensive forms of P to be used (ie liquids). If crop removal of P is greater than fertiliser P input, soil P will decline until crop P removal is equal to the rate of mineralisation of organic P.
Rock phosphate did not have any residual benefit in either soil P (Colwell) or grain yield (2012) at the 5kgP/ha, 10kgP/ha or 20kgP/ha rates.
3. Seasonal factors will also impact P response
The combination of a soil test result, local P calibration curve, paddock and crop rotation history and sowing date can greatly assist in determining paddock responsiveness to additional P fertiliser.
As demonstrated by this trial, seasonal factors will influence crop response to freshly applied P. Other studies (McBeath, 2012) have demonstrated that P uptake is largely from residual soil P in wetter years (crop roots can forage in nutrient rich topsoil), and from freshly applied P in more typical/average seasons. Therefore response from freshly applied P will vary from year to year.
Whilst we can’t control the season, we can control how much we invest in the crop. Selecting the appropriate fertiliser source will allow yield to be maximised when seasons allow, and reduce risk when seasonal factors produce low yields.
In this trial the high-analysis granular fertiliser, MAP maximised yield potential whilst also requiring the lowest breakeven yield to cover fertiliser cost, hence reducing financial risk in low yielding seasons.
Acknowledgement
I would like to thank the growers and advisers within the Parkes/Forbes/Peak Hill district for their support in developing and running this trial. A special thanks to Jim Cronin for allowing us to run this trial on “Duran”, Gunningbland NSW.
Also thanks to Barry Haskins (AgGrow agronomy and research), Dr Simon Speirs (NSW DPI) and Rohan Brill (NSW DPI) for reviewing this trial report and Dr Remy ven de Ven for biometrical support.
References
Price,G. 2006. Australian Soil Fertility Manual. Fertiliser Industry Federation of Australia.
McBeath, T.M., Armstrong, R.D., Lombi, E., Mclaughlin, M.J.,and Holloway, R.D. (2005). Responsiveness of wheat to liquid and granular phosphorus fertilisers in southern Australian soils. Australian Journal of Soil Research, 2005, 43, 203-212.
McBeath,T.M., McLaughlin, J.K., Kirkby, J.K., and Armstrong, R.D. (2012). The effect of soil water status on fertiliser, topsoil and subsoil phosphorus utilisation by wheat. Plant Soil 358:337-348
Bolland, M., (2007). Effectiveness of Rock Phosphates. W.A Department of Agriculture and Food, Farm note 215.
Contact details
Colin McMaster
296 Binni Creek Rd
0427940847
Was this page helpful?
YOUR FEEDBACK