Crop and pasture sequences sustain wheat productivity
Author: Martin Harries & Geoff Anderson, Western Australian Department of Agriculture and Food | Date: 24 Feb 2015
Key messages
- Overall the vast majority of paddocks were maintained in a productive state for wheat.
- There has been a shift in land use from legume break crops to canola.
- Increasing incidence of root disease in a range of crops is a concern.
Aims
The aim of the Focus Paddock project is to compile information on the suitability and productivity of crop and pasture sequences across the WA wheatbelt. This paper reports changes in the chemical and physical attributes of the soil, weed populations and incidence of root disease over five years from 184 cropping paddocks.
Method
The survey was conducted within the cropping zone of south-western WA with the same 184 paddocks surveyed each year from 2010–14. Data is reported for all 184 paddocks spread across three subregions — the Northern Agricultural Region (NAR), the Central Agricultural Region (CAR) and the Southern Agricultural Region (SAR). The number of paddocks in each region were NAR n=70, CAR n=65 and SAR n=49 and were linked to a range of grower groups.
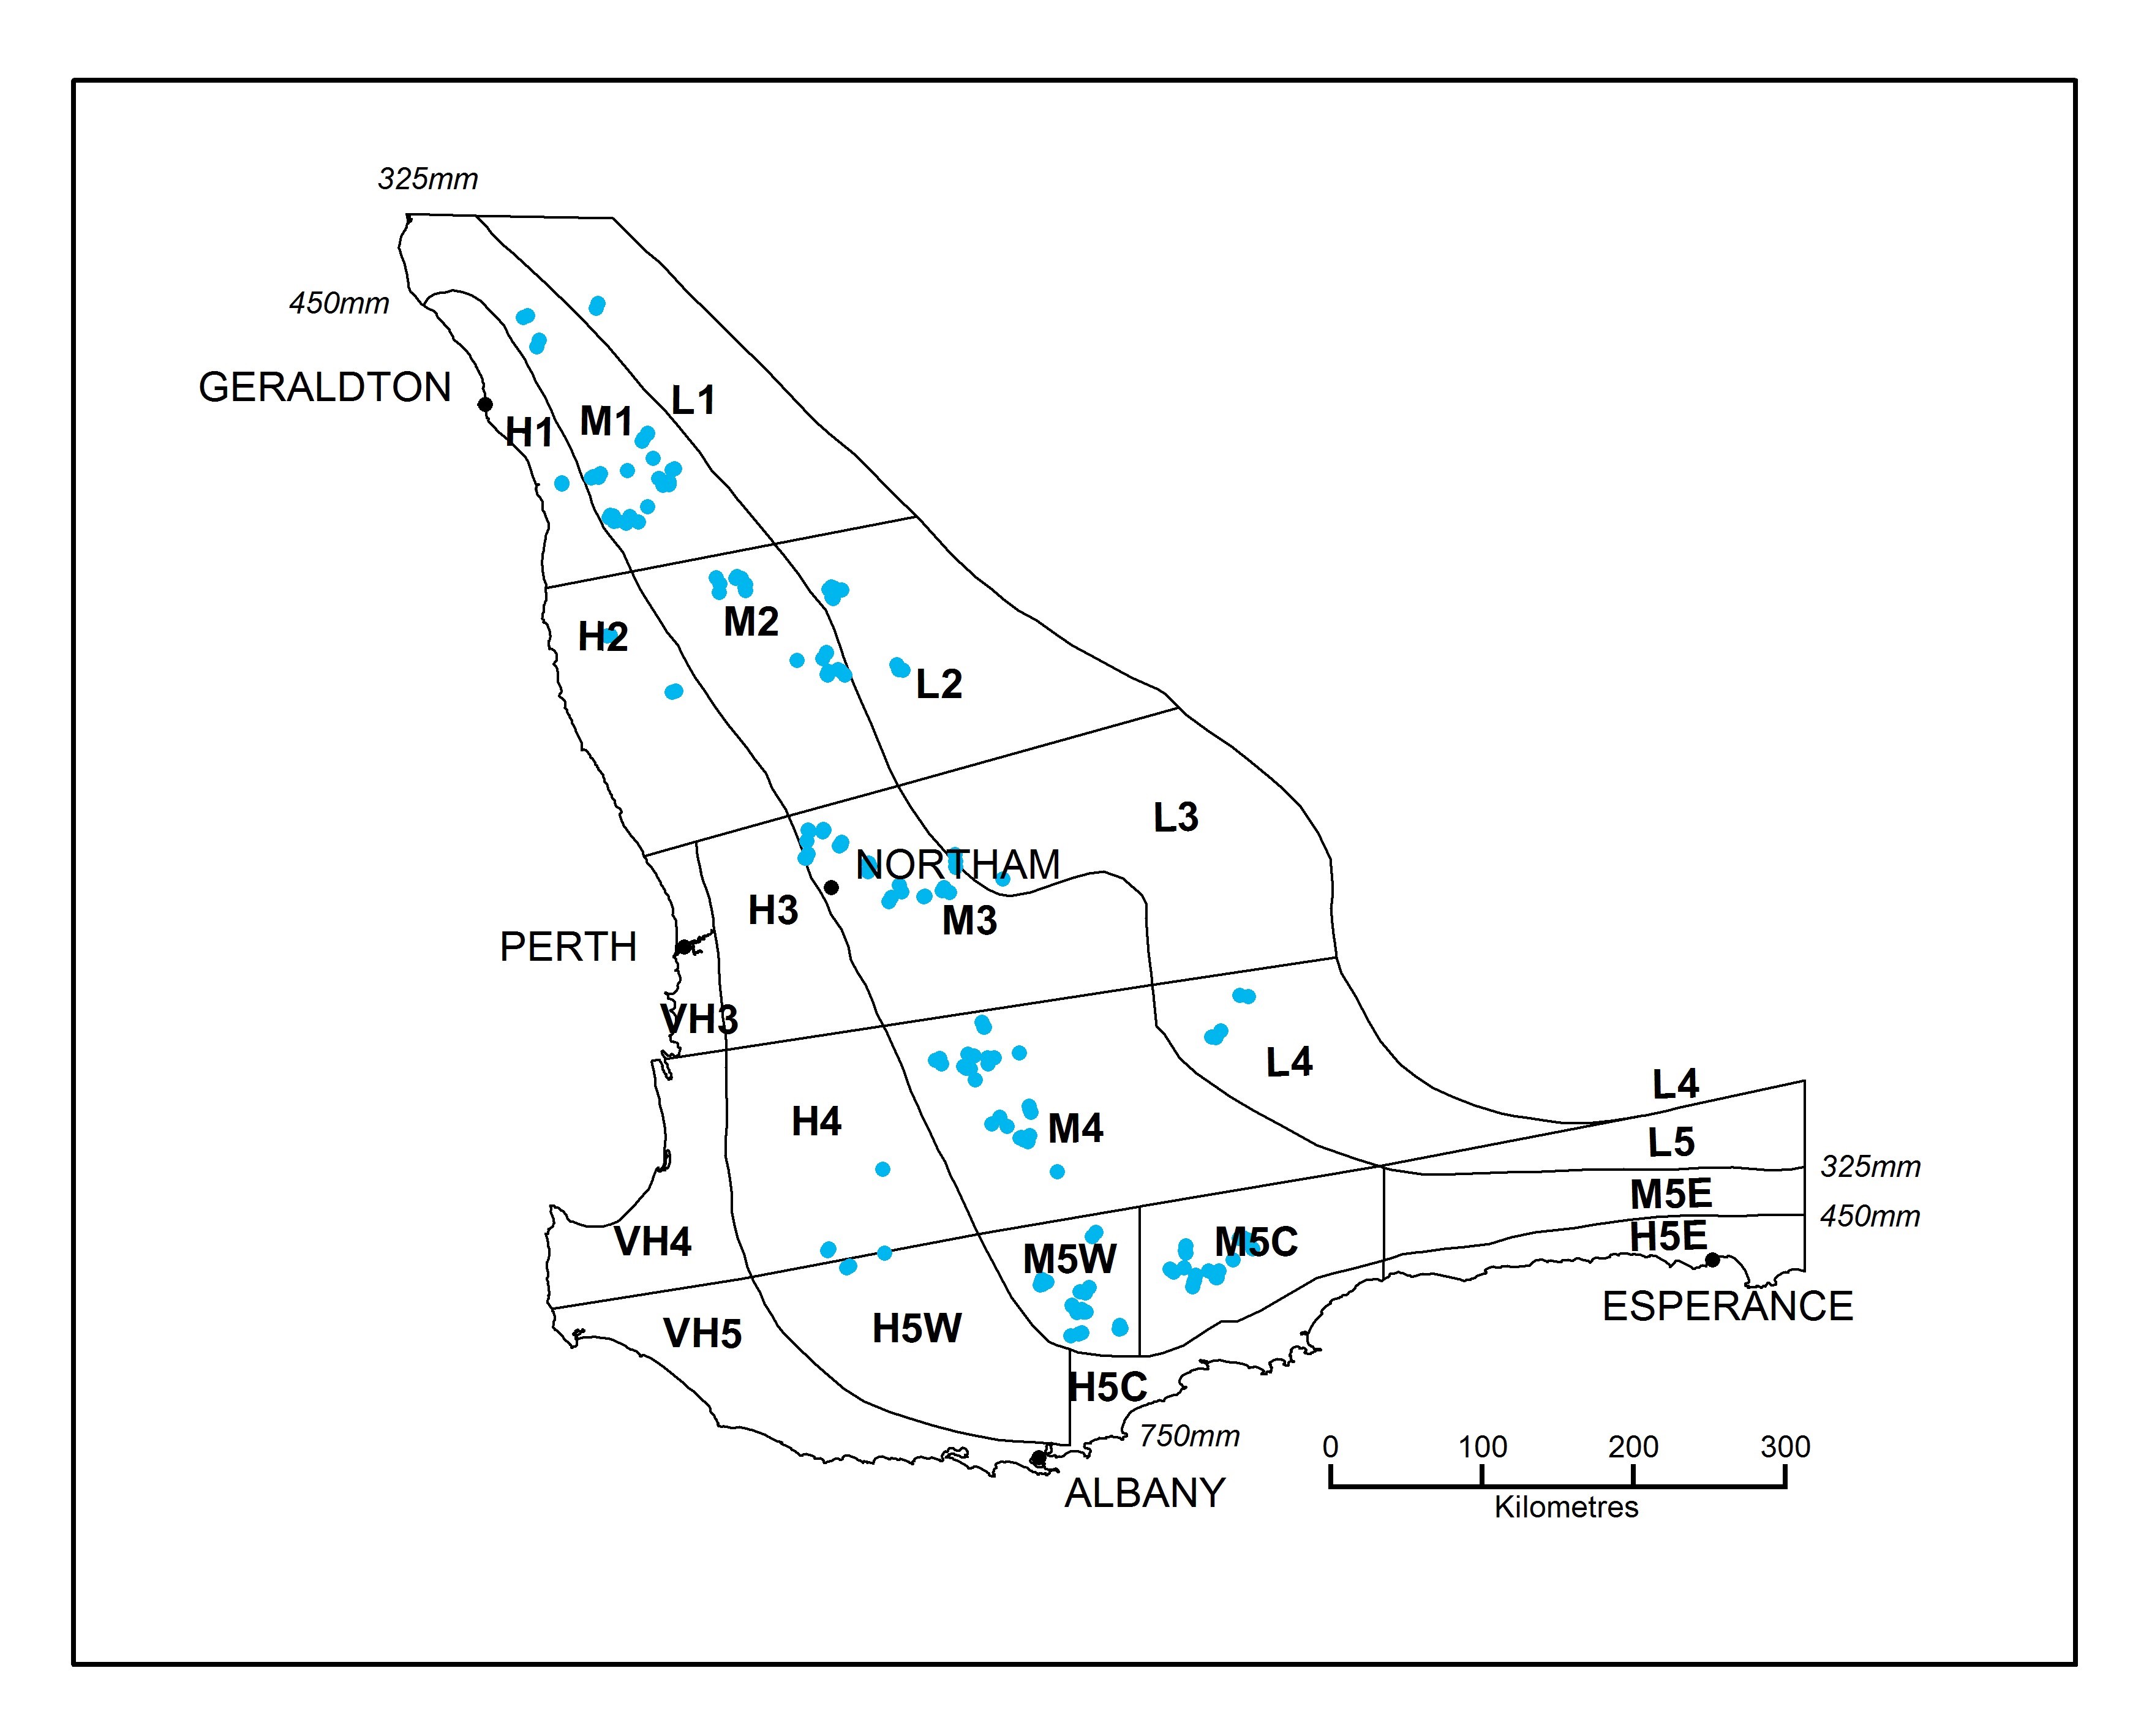
Figure 1. Paddock locations within the cropping zone of south-western Australia where the Focus Paddock survey was undertaken, 2010–14. Numbers refer to agricultural regions Northern (1 and 2), Central (3 and 4) and Southern (5).
Paddock selection
Project staff selected paddocks to encompass a range of crop and pasture sequences representative of the wider industry. The paddocks covered a broad geographical area encompassing 14 agro-ecological zones and several common soil types. It was anticipated that some growers at first might have viewed the survey as an opportunity to investigate poor-performing paddocks. To ensure this did not bias the selection of sample sites, we stipulated that paddocks typical of the farm be nominated.
Soil types
Soils were classified according to both WA and Australian soil classification schemes. Selected paddocks were categorised as duplex (46%), loam (22%), gravel (10%), sand (14%), clay (6%), stony (0.5% or one paddock) and unknown (1.6%). Sands were more common in the NAR, accounting for 30% of the paddocks sampled. Duplexes were more common in the CAR and SAR, accounting for 55% and 66% of the paddocks sampled respectively.
Sampling methods
We defined sampling sites as one-hectare areas with average paddock production, as advised by the grower. The hectare area started at least 30m from the edge of the paddock to avoid edge effects and any anomalous management. Each hectare area was divided into four pseudo replicates to ensure sampling across the entire area but samples were bulked for analysis. Samples of soil, plants and weed seed as well as measurements of weed populations were taken four times during the year: before sowing, 3-4 weeks after emergence, at anthesis, and at crop maturity.
Rainfall
Rainfall received in each Agzone was highly variable between the monitoring years. Long-term average growing season (1 April to 31 October) rainfall (GSR) across all Agzones ranged from 253 to 551mm. Growing season rainfall within the survey period was often less than the long term average. For all Agzones, GSR was less than Agzone long term average in 2010 and 2012 and in 2013 this occurred in 8 of 11 Agzones. In contrast, GSR was greater than long-term average for 8 Agzones in 2011.
Results
We present results from all 184 paddocks as frequency distributions stratified within the three regional areas (NAR, CAR and SAR). The data was benchmarked by grouping according to expected impacts on yield based on relevant literature for each of the variables. Please contact the authors for a full results summary.
Crop Choice and sequence
Wheat continues to dominate land use — used over 60% of the time. The proportion of wheat was greatest in the NAR — 68% compared to the CAR (58%) and SAR (49%). Canola was the most used break crop at around 10% for each region. Diversity of crop species was limited, with four species — wheat, canola, barley and lupin — accounting for 84% of land use. By region, wheat, canola, barley and lupin accounted for 90% of land use in the NAR, 83% in the CAR and 78% in the SAR. Pastures made up 12% of land use overall. There was also a regional difference in pasture usage — in the NAR (7%), CAR (12%) and SAR (21%).
Weeds
In a large proportion of paddocks weeds were not detected within the measurement area (Table 1.), indicating a very low weed burden and farmer intolerance of high weed seed banks. Grass weed density increased under wheat crops, from an average density of 8.5 plants/m2 at 3–4 weeks after establishment to 13.6 plants/m2 at anthesis. When canola was grown grass weed density declined from 24 plants/m2 at 3–4 weeks after crop establishment to 3 plants/m2 at maximum biomass. Regionally SAR paddocks had more paddocks with grass and broadleaf weeds at high densities. This is as expected considering pastures are used more frequently in this region.
Table 1. Distribution (%) of weed densities at the seedling and anthesis stage 2010-2013 (621 paddock/year samples).
|
Grass weeds grouping (plants/m2)
Broadleaf weeds grouping (plants/m2)
|
0 0 |
<5 <3 |
5 - 10 3 - 7 |
10 - 30 7 - 10 |
>30 >10 |
|---|---|---|---|---|---|
| Grass weeds - seedling | 48 | 22 | 8 | 13 | 10 |
| Grass weeds - anthesis | 51 | 19 | 9 | 15 | 6 |
| Broadleaf weeds - seedling | 54 | 19 | 10 | 4 | 12 |
| Broadleaf weeds - anthesis | 72 | 16 | 6 | 1 | 4 |
Nitrogen
Soil inorganic nitrogen (N) taken before sowing to 90cm depth was high, with average values ranging from 41 to 127kg N/ha over all sampling years (Table 2.). Soil N content of <60kg/ha (which we consider to be a moderate level to report against) was more frequent in 2012 (30%), 2013 (34%) and 2014 (74%) compared to 2010 (20%) and 2011 (7%). This variation was associated with rainfall within the fallow period (November to April). There were effects relating to the growth of legumes. In 2012 paddocks following legumes grown in 2011 had 14kg N/ha higher soil profile N content than paddocks following wheat or canola grown in 2011. There was no difference in 2013, while in 2014 paddocks following legumes had 5kg N/ha higher soil profile inorganic N content than paddocks following wheat or canola. It should be noted that soil profile measurements taken in autumn will underestimate the N benefits of previous legumes because these measurements only account for fallow period mineralisation and further mineralisation will occur during the growing season. Comprehensive soils tests were completed and result summaries for other nutrients are available from the authors.
Table 2. Profile nitrogen (kg N/ha) to 90cm prior to sowing, over the 5 years of the survey (combined nitrate and ammonium). n = number of paddock/year samples.
| Grower Group | AgZone | n | 2010 | 2011 | 2012 | 2013 | 2014 | 5 year average |
|---|---|---|---|---|---|---|---|---|
| Yuna (NAR) | L1 M1 | 30 | 80 | 119 | 58 | 66 | 54 | 75 |
| MIG (NAR) | M1 H1 | 141 | 66 | 103 | 57 | 61 | 41 | 66 |
| Liebe (NAR) | L2 M2 | 143 | 77 | 85 | 90 | 80 | 85 | 83 |
| WANTFA (CAR) | M3 | 142 | 108 | 104 | 105 | 108 | 50 | 95 |
| Facey (CAR) | M4 | 140 | 122 | 101 | 80 | 102 | 42 | 89 |
| Holt Rock (CAR | L4 | 20 | - | 50 | 77 | 127 | 68 | 81 |
| Southern Dirt (SAR) | H4 H5W | 29 | 88 | - | 73 | 83 | 48 | 73 |
Acidity
Paddocks with pHCa <5.5 at 0–10cm accounted for 61% of paddocks sampled over the period 2010-2014. Paddocks with pHCa <4.8 at 10–20cm accounted for 23% of paddocks sampled. The combination of pHCa <5.5 at 0–10cm or pHCa <4.8 at 10–20cm (or both) accounted for 73% of the paddocks sampled. Regional differences were observed: SAR paddocks had 88% of soils acidic in the 0–10cm layer compared to the CAR (68%) and the NAR (48%). However, the frequency of acid soil below 10cm was lower in the SAR (4%) compared to the CAR (23%) and NAR (43%). There were implications for crop selection because 17% of paddocks had a 0–10cm pHca of >5.5 and 10–20cm pHca of <4.8. In these paddocks, break crops such as canola, chickpea and field pea could be sown in error if growers relied on the topsoil pH results only. For example, in 2012 and 2013, 20% of paddocks sown to canola had a topsoil pHca of >5.5 and a subsurface pHca of <4.8.
Root Disease
PreDictaB analysis indicated there were few paddocks (<6%) that had root pathogens present at levels that are predicted to cause high levels of crop yield loss. However, the incidence and severity of paddocks with pathogen DNA detected has increased steadily over the study period for most pathogens. It should be noted that the highest DNA levels recorded for the survey were before sowing in 2014 (Figure 2.), after the dry 2013-14 summer. Hence as expected climate is a major driver of disease.
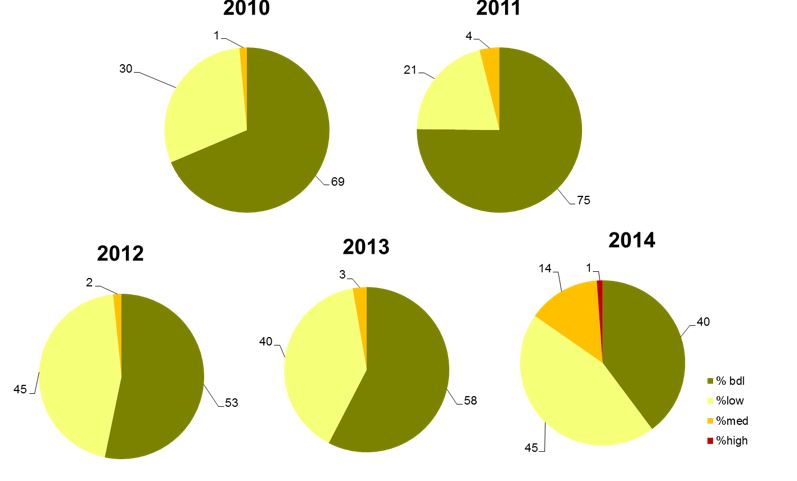
Figure 2. Root lesion nematode (P.neglectus) DNA eggs/gram of soil assessed using the PreDictaB test, taken in Autumn. *bdl = Below detectable limit
Visual ratings of root disease indicated that the majority of cropped paddocks contained some plants with root disease, 73% at the seedling stage and 83% at anthesis. Of the pathogens rated Rhizoctonia and Root lesion nematode symptoms were observed most frequently; 74% and 65% of paddocks had at least one of these pathogens at the seedling stage and anthesis respectively. For the majority of these samples less than 50% of the plants showed symptoms. Severity of disease was generally low with 91% and 85% of samples at seedling and anthesis, respectively, having less than 25% of the root area affected. There were more paddocks with plants showing 25% or more of root area affected in the SAR (21%) compared to the CAR (14%) and NAR (16%) at anthesis.
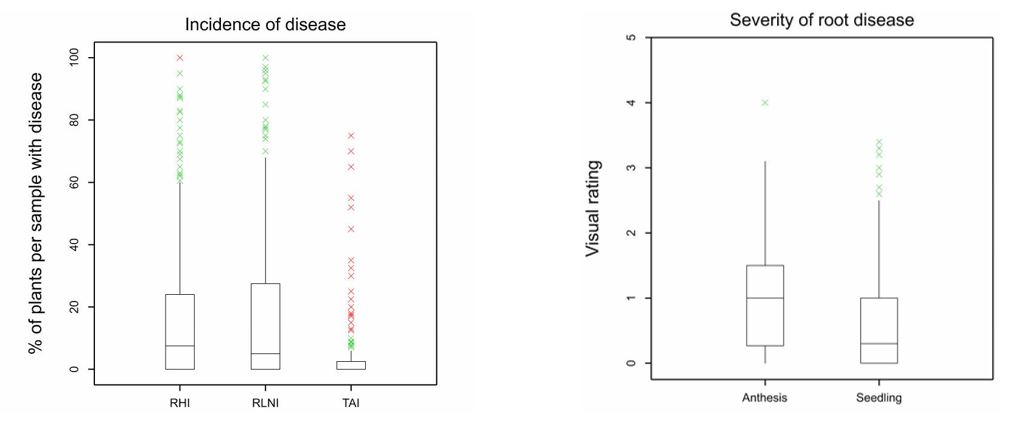
Figure 3. Visual disease observations; % of crop plants with disease = number of plants in each sample with disease (%). Visual rating of severity was area of root diseased (all pathogens combined) 0= none 1=<5% 2=5-25%, 3=25-50%, 4=50-75% 5= 75-100%. RHI = rhizoctonia, RLN = P.neglectus, TAI = take-all. Whiskers and boxes represent 25th percentiles.
Conclusion
The survey results reflect recent changes in farming systems in south-western Australia and the regional differences that would be expected. There has been a major change in land use with more area sown to canola and wheat and less grain legume and pasture (particularly in the northern region). This is reflected in soil nitrogen dynamics, incidence of root diseases and weed populations.
Overall the vast majority of paddocks monitored were maintained in a suitable condition for wheat production using a variable mix of break crops and pastures.
The benefits of a greater inclusion of canola were better weed control and suppression of root diseases other than RLN. Soil N prior to sowing was more responsive to fallow season rainfall than preceding crop type and levels were generally high.
Weaknesses in the current farming system appear to be increasing RLN levels and soil acidity. Also weaknesses with canola agronomy, such as sclerotinia, need to be monitored, given the high reliance on this break crop.
Acknowledgments
This study was financially supported by the Grain Research and Development Corporation (GRDC) through project DAW00213 Putting the Focus on Profitable Crop and Pasture Sequences in WA. Field monitoring was coordinated by Jo Walker and undertaken by DAFWA staff in conjunction with staff from the, Liebe Group, Western Australian No-tillage Farmers Association, Facey Group and Mingenew–Irwin Group. Plant disease was assessed by DAFWA plant pathologists with particular thanks to Shjajahan Miyan. We also thank Angela Stuart-Street and Dennis van Gool for soil characterisations.
GRDC Project Code: DAW002143, DAW00210 and DAW00229,
Was this page helpful?
YOUR FEEDBACK