Long term effects of claying on non-wetting and plant nutrition.
Key messages
- Claying water repellent sands resulted in significant increases (> 50%) in crop yields over 15 years.
- The increases in crop yields have not diminished with time.
- Yield increases are associated with more uniform wetting and improved availability and retention of both potassium (K) and phosphorous (P).
- Subsoil clays properties can differ substantially, which can affect crop production responses and profitability.
- Less than one third of farmers who clay their paddocks test their clays prior to application.
Aims
Water repellent sands cover approximately 3 million ha of cropped land in Western Australia. The application and incorporation of subsoil clay is one of several methods farmers can use to rectify water repellence in sands. The cost of claying soils ($500-800/ha) is expensive, requiring more than one season to pay for the operation. To justify the expense farmers need to have confidence that claying will result in major yield increases across an extended period and a range of seasons. The aim of this paper is to outline the findings from a long term (15 year) clay trial conducted on the south coast of WA and the implications that claying has on plant nutrition and on soil properties including nutrient retention.
Method
An experiment was established at Dalyup (50 km west of Esperance) in 1999 on a highly water repellent pale deep sand. The trial originally had ten treatments consisting of five subsoil clay rates (0, 50, 100, 200 300 t/ha) and two incorporation depths (8 and 13 cm) in a randomised block design with three replicates. The subsoil contained 41% clay which was extracted from a pit approximately 500 m from the trial site. Each plot was 15 m wide by 100 m long. Soil properties measured included soil strength, particle size, chemistry and degree of non-wetting as measured by the molarity of ethanol droplet (MED) test. Crop emergence, grain yields and nutrient levels were measured in cereal, lupin and canola crops. Grain yields were matched to potential yields using the modified French-Schultz equation of Oliver et al. (2009). Nutrient levels in whole plants and leaves were assessed. In 2005 the deeper incorporation treatments were subsequently deep ripped to 45 cm. A more detailed description of the experiment is given by Hall et al. (2010).
Additional soil chemical data was obtained from a clay rate trial established at Esperance Downs Research Station. Soils at this site had higher organic matter levels (>1.5%) compared to 1% at Dalyup. Relationships between MED and clay content were determined at both this and the Dalyup sites.
A survey of 30 farmers who had undertaken claying was conducted in 2013 in order to harvest information on claying practices, performance and nutrient management post claying. As a part of the survey on the south coast, clay samples were collected from the clay pits and analysed for pH, EC (electrical conductivity), macro and micro nutrients, cations, boron and phosphate retention index (PRI) .
Results
Clay rate experiment
The application of subsoil clays reduced the severity of non-wetting at these sites. However the clay rate required varied with the soil organic carbon (SOC) content of the topsoil. In sands with low SOC (< 1%), 3% clay was sufficient to convert a non-wetting soil into one which wet uniformly. However sands with higher SOC required higher clay rates. We found that highly water repellent sands from Esperance Downs Research Station with SOC contents of 1.5% required 6% clay to overcome water repellence (Figure 1). This suggests that even higher clay rates will be required where soil organic carbon levels are 2% or higher.
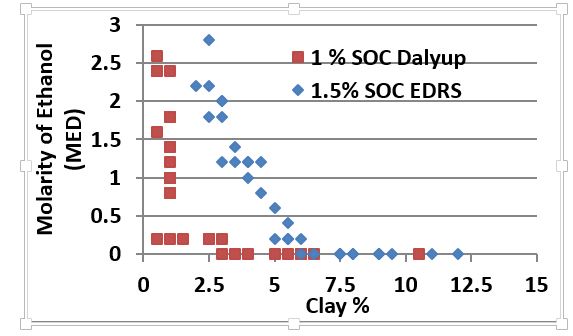
Figure 1: Relationship between water repellence as measured by the molarity of ethanol droplet (MED) test and clay content (%) for sandy soils (0-10 cm) at Dalyup (■) and Esperance (♦) with differing background soil organic carbon (SOC) content.
Crop grain yields were significantly increased at Dalyup where the applied subsoil material resulted in more than 3% clay within the topsoil. Over the fifteen years the average yield increase over the control for the 50, 100, 200 and 300 t/ha treatments was 4%, 11%, 43% and 53% respectively. The long term trends show that the yield response to clay has not diminished over time (Figure 2). Clay was still evident on the surface indicating negligible levels of clay movement deeper into the profile. This suggests that claying can provide a long term solution to water repellence.
Figure 2: Effect of clay rates on crop yields between 1999 and 2015 at Dalyup. Yields presented as % increase over the control (Clay 0). Missing years were either in pasture or were not measured.
The increased yields associated with claying are attributed to increased crop emergence, nutrient availability and nutrient retention. While significant increases in crop emergence were found in most years, grain yields were also found to be higher as a result of claying in years were there were no crop emergence differences (i.e. 2007).
Soil chemical properties indicated improved available nutrient levels (P, K), increased nutrient retention as measured by cation exchange capacity (CEC) and increased pH (Table 1). As a result, claying elevated P and K levels from deficient to sufficient through increased retention and direct application respectively. Leaf tissue analysis also showed significantly higher K levels in canola and barley when measured in 2004, 2005 and 2013.
SOC levels were also found to be significantly increased at Dalyup, as a result of increased biomass production and/or through the protection of carbon. The increase in SOC is equivalent to an additional 3 t/ha of sequestered carbon measured 7 years after implementation representing an annual rate of increase of 0.43 t carbon/ha/yr.
Table 1. Effect of clay rate on soil chemical properties measured in 2007 at Dalyup 7 years after treatments were implemented. Values that are significantly (P<0.01) different to the control (0 t/ha) are highlighted in bold italics. Chemical properties of the subsoil used to clay the paddock are also given.
| Clay t/ha | Clay % | EC mS/m | pHca | SOC % | SON % | P ppm | K ppm | S ppm | CEC | MED |
|---|---|---|---|---|---|---|---|---|---|---|
| 0 | 0.8 | 6.3 | 5 | 0.9 | 0.07 | 9.7 | 17.2 | 9.3 | 2.7 | 2.2 |
| 50 | 0.9 | 6.8 | 5 | 1 | 0.07 | 8.8 | 21.8 | 10.5 | 2.9 | 1 |
| 100 | 1 | 6.8 | 5 | 1 | 0.07 | 10.5 | 23.3 | 9.8 | 2.9 | 0.8 |
| 200 | 3.1 | 8.8 | 5.3 | 1.1 | 0.08 | 14.3 | 37.7 | 11.5 | 3.6 | 0.1 |
| 300 | 6.6 | 10.8 | 5.6 | 1.1 | 0.08 | 22.3 | 64.5 | 14.2 | 4.4 | 0 |
| Subsoil Clay | 41 | 143 | 6.1 | 0.2 | n/a | 2 | 352 | 72.9 | 9.9 | 0 |
While significant improvements in crop growth and soil fertility were found, absolute yields for cereals with the highest clay rates were approximately 66% of the calculated rainfall limited yield potential. This suggests that factors other than water repellence were limiting crop growth. Deep ripping treatments imposed at the Dalyup site in 2005 resulted in yield increases of 22%, 16% and 20% in 2005, 2006 and 2007 respectively. The effects of claying and deep ripping on crop yields were additive, with the combination of claying and ripping achieving their rainfall limited yield potential in the initial year. The impact of ripping treatments diminished with time and when measured in 2013, no significant ripping effects were evident. There may be opportunities for further optimisation of crop nutrition on clayed sands due to their higher yields.
Clay properties and claying practices.
A survey of thirty growers and their claying practices found that:
- 87% of respondents achieved yield increases of between 0.25 and 3 t/ha for their cereals.
- 70% of respondents noted premature haying off in some clayed soils.
- 13% of respondents found subsoil clays had negative chemical properties with acidity being the main limitation.
- Less than 30% of growers test their clays before applying.
In addition, a survey of 82 clays from within clayed paddocks was conducted in the south coast region to determine the variation in clay properties and potential management issues. Considerable variation was found among the samples, with clay percentages ranging from 10 to 75% (Table 2). Applying a ‘standard rate’ of 150 – 300 t/ha would result in no benefit when the subsoil contains only 10% clay; and severe over application would result in hardsetting and crusting from the 75% clay.
In lower rainfall or poorly drained sites, salinity (determined from EC) and boron levels were found to be high in the clay samples but dilution during clay incorporation often resulted in no short or long term limitations to crop production. Indeed in one case, clay beneath a salt scald was successfully used to ameliorate non wetting despite an EC of 2 dS/m. Clays with high phosphate retention indices (PRI) were used in some fields which had the potential to limit the availability of P to plants even when diluted during incorporation. Clays with PRI values in excess of 1000 have been subsequently found at other sites. High PRI subsoils were not always associated with any particular soil colour or presence of gravels.
Table 2. Properties of clays collected from pits within clayed paddocks located from Esperance to the South Stirlings. Sample size = 82.| Clay (%) | EC (dS/m | pHca | P (ppm) | K (ppm) | S (ppm) | CEC (cmol+/kg) | Boron (ppm) | PRI | |
|---|---|---|---|---|---|---|---|---|---|
| Mean | 40 | 0.4 | 6.8 | 3 | 320 | 51 | 11 | 4 | 94 |
| Maximum | 75 | 2.3 | 8.7 | 13 | 1090 | 337 | 28 | 20 | 502 |
| Minimum | 10 | 0 | 4.7 | 1 | 19 | 3 | 3 | 0 | 7 |
Most subsoil used for claying had high levels of K and S and low levels of P relative to the sands they were being applied to. In most situations the pH of the clay was higher than the sands they were being applied to.
Conclusions
- Claying at the Dalyup trial site provided a long term solution to water repellent sands with average yield increases of more than 50% found over 15 years for the highest rate of clay.
- Clay rates resulting in 3% clay within the topsoil will amend non wetting in sands with 1% SOC. Higher clay percentages (> 5%) are required in sands with more than 1.5% SOC. Clay rates resulting in >10% clay are likely to cause hardsetting and crusting.
- Crop responses to clay application occurred as a result of more even wetting as evidenced by improved germination; and improved crop nutrition associated with added K and increased retention of nutrients.
- The properties of materials used for claying vary considerably among paddocks, farms and regions. Knowing the clay percentage, K, S, EC, pH, CEC, Boron and PRI of the materials being applied can help growers better manage the claying program and subsequent fertilizer decision making.
Reference
Hall D.J.M., Jones, H., Crabtree, W. and Daniels T. (2010) Claying and deep ripping can increase cop yield and profits on water repellent sands with marginal fertility in southern Western Australia. Aust. J. Soil Res. 48:178-187.
Oliver, Y, Robertson M., Stone, P., and Whitbread, A. (2009) Improving estimates of water-limited yield of wheat by accounting for soil type and within season rainfall. Crop and Pasture Science. 60:1137-1146
Acknowledgments
John and Peter Luberda for their long commitment to this experimental research. Bill Crabtree for establishing the trial while at WANTFA. Technical support from Tania Daniels, Ron Pryde and Chris Matthews (Esperance RSU).
Was this page helpful?
YOUR FEEDBACK