MET analysis of NVT barley trials 2005 - 2014
Author: Blakely Paynter1 and Chris Lisle2, 1Department of Agriculture and Food Western Australia, Northam, WA; 2Charles Sturt University, Wagga Wagga, NSW | Date: 24 Feb 2015
Key messages
- Production Value - PLUS (PV-PLUS) unlocks the multi-environment trial (MET) analysis used in publications such as annual variety sowing guides and allows growers / consultants to see the variability (and complexity) in the grain yield performance of barley varieties over different locations and seasons.
- PV-PLUS graphically displays variety performance for a specific location by combining single site analyses over years.
- PV-PLUS helps growers / consultants identify varieties with variable yield, stable yield, and those which yield either higher or lower than the site mean. Local knowledge, in conjunction with some of the available site characteristics, is important to help retrospectively understand potential causes of varietal instability across seasons at a location.
- Grain yield results from MET analyses need to be used in conjunction with agronomic, disease, grain quality, segregation and market information when deciding on which barley variety to sow.
Background and aims
The National Variety Trial (NVT) program was established by the Grains Research and Development Corporation (GRDC) in 2005 to provide a nationally independent means of assessing varietal performance to enable growers to select the best variety for their environment. In Western Australia there have been 172 barley trials sown and 95 lines / varieties tested (in one or more trials). About 50% of the lines / varieties tested have not become commercial varieties in Western Australia (as of 01 January 2015).
In Western Australia, typically the results of NVT trials are available as individual site reports (available at nvtonline.com.au) or as multi-environment (MET) summaries covering our six Agzones published in the annual barley variety sowing guide (i.e. Bulletin 4860, Paynter et al 2014). The main problem with single site analyses is that they only represent varietal performance under one specific set of seasonal and site conditions. The main problem with MET results based on Agzones is that they average varietal performance and mask variety by environment (G x E) interactions across the locations (and seasons) within the Agzone.
NVT has been exploring new ways of presenting their data to improve the knowledge that growers have when selecting new varieties. The Production Value – PLUS (PV-PLUS) system is a new method of results presentation for NVT trials developed by Statistics for the Australian Grains Industry (SAGI). PV-PLUS was developed to improve grower skills in selecting the best variety for their environment.
The aim of this paper is to introduce PV-PLUS for barley and provide a snapshot of varietal performance using the traditional Agzone reporting methodology and the new PV-PLUS method. Five varieties (Baudin, Buloke, Gairdner, Mundah and Stirling) representing the diversity in the barley phenotype commonly grown in Western Australia over the last 10 years were selected to contrast the different methods of presenting data from NVT barley trials. NVT data for the period 2005-2014 is presented for each Agzone and one location within each Agzone.
Method
Ten years of NVT data (2005-2014) was analysed. The data was taken as the varietal means and weights from the NVT single site analyses (Smith et al 2001b). All barley trials since 2005 were included in the analysis, except if the site mean yield was less than 0.3 t/ha or if there was no genetic variance (Lisle 2015). Five trials were removed from the data set for those reasons. Varieties that occurred in less than four experiments were also removed, with two varieties excluded. This resulted in a dataset with 167 barley trials and 93 unique lines / varieties. Table 1 list the target number of trials sown in an Agzone, the number of unique locations in the database for each Agzone and the total number of sites in each Agzone.
The varietal means from the single site analysis were modelled in the MET analysis as a linear mixed model, following the two-stage approach of Smith et al (2001b), with a factor analytic (FA) model for the environment (trial) by genotype effects (Smith et al 2001a). The best fitting model was determined using the Akaike Information Criterion. All linear mixed models were fitted using the linear mixed modelling software ASReml-R (Butler et al 2009) bundled as an R package for use in the R statistical computing environment (R Core Team 2013). A detailed description of the methods is described by Smith et al (2015). The outputs from the barley MET analysis for 2005-2014 are reported by Lisle (2015).
PV-PLUS data is presented graphically. Variety production values, also known as predicted genetic value and best linear unbiased prediction (BLUP), are presented as production values (PV) on the y-axis against years on the x-axis. PVs are positive or negative differences relative to a base-line (PV = 0). The base line reflects the average yield of all the varieties in the current NVT dataset (site or trial mean yield), if grown in that particular environment. In a PV-PLUS graph two varieties are statistically different in their grain yield if there is no cross-over of their standard error (s.e.) bars. There is no PV displayed for years where there was no trial. A missing year could be due to a change in location of the trial, the trial was aborted or the site mean yield was below 0.3 t /ha. It is important to note that not all varieties have been sown / harvested in each year and in all sites. PV-PLUS however estimates the grain yield of varieties missing from sites based on their performance at other sites and the correlation of the site with missing data to other sites in the dataset. As a consequence there is more certainty in the estimated PV for varieties sown in more sites. In the PV-PLUS graphs, dotted lines represent if there is an estimated PV for a variety.
Five barley varieties – Baudin, Buloke, Gairdner, Mundah and Stirling – were selected to visualise the response of barley varieties to locations and seasons since 2005. They were chosen because they were physically present in more than 90% of the barley NVT trials since 2005, for the differences in their phenotype (phenology and height genes) and due to their popularity with growers during the period 2005-2015. Mundah is the earliest flowering variety and Gairdner the latest variety, with a difference in their duration to awn peep of around 15 days (if sown in late May at Northam) (Paynter 2015). Buloke, Mundah and Stirling are tall varieties whist Baudin and Gairdner are semi-dwarf varieties. The varieties also differ in many other agronomic characteristics (Paynter et al 2014).
Table 1. Annual target number of barley NVT sites within an Agzone, the number of unique locations in the database for the period 2005-2014 for each Agzone and the total number of sites in each Agzone.
| Agzone | Target number of sites in an Agzone per year | Unique locations within an Agzone | Total number of sites in database |
|---|---|---|---|
| Agzone 1 | 1 | 5 | 11 |
| Agzone 2 | 5 | 13 | 39 |
| Agzone 3 | 5 | 12 | 42 |
| Agzone 4 | 2 | 3 | 13 |
| Agzone 5 | 4 | 8 | 42 |
| Agzone 6 | 2 | 6 | 20 |
Table 2. NVT MET grain yield of five barley varieties expressed as a per cent of the site mean yield (2005–2014) for each Western Australian Agzone (Source: NVT Online, nvtonline.com.au).
| Agzone | Agzone 1 | Agzone 2 | Agzone 3 | Agzone 4 | Agzone 5 | Agzone 6 | |||||||
|---|---|---|---|---|---|---|---|---|---|---|---|---|---|
| Variety | (%) | (no. obs) | (%) | (no. obs) | (%) | (no. obs) | (%) | (no. obs) | (%) | (no. obs) | (%) | (no. obs) | |
| Baudin | 94 | 11 | 96 | 37 | 87 | 39 | 100 | 12 | 98 | 39 | 92 | 20 | |
| Buloke | 102 | 11 | 101 | 37 | 104 | 39 | 107 | 12 | 102 | 37 | 99 | 20 | |
| Gairdner | 94 | 6 | 98 | 34 | 94 | 39 | 95 | 12 | 98 | 32 | 95 | 20 | |
| Mundah | 91 | 11 | 96 | 34 | 95 | 39 | 108 | 12 | 95 | 39 | 86 | 20 | |
| Stirling | 88 | 11 | 91 | 34 | 87 | 31 | 100 | 12 | 92 | 39 | 82 | 20 | |
| Site mean yield (t/ha) | 2.65 | 11 | 2.61 | 37 | 3.83 | 39 | 1.89 | 12 | 2.74 | 39 | 3.03 | 20 | |
Table 3. Average grain yield (± s.e.) of five barley varieties expressed as a per cent of site mean yield (2005– 2014) for one location within each Agzone.
| Agzone | Agzone 1 Mingenew | Agzone 2 Wongan Hills | Agzone 3 Frankland | Agzone 4 Merredin | Agzone 5 Jerramungup | Agzone 6 Munglinup | ||||||
|---|---|---|---|---|---|---|---|---|---|---|---|---|
| Variety | (%) | (no. obs) | (%) | (no. obs) | (%) | (no. obs) | (%) | (no. obs) | (%) | (no. obs) | (%) | (no. obs) |
| Baudin | 96 ± 3 | 5 | 98 ± 2 | 9 | 85 ± 4 | 7 | 97 ± 2 | 7 | 96 ± 5 | 9 | 105 ± 5 | 5 |
| Buloke | 102 ± 2 | 5 | 103 ± 1 | 9 | 106 ± 4 | 7 | 108 ± 3 | 7 | 102 ± 2 | 8 | 97 ± 3 | 5 |
| Gairdner | 99 ± 3 | 4 | 97 ± 2 | 8 | 90 ± 3 | 7 | 94 ± 2 | 7 | 97 ± 3 | 8 | 98 ± 2 | 5 |
| Mundah | 95 ± 7 | 5 | 101 ± 2 | 8 | 94 ± 9 | 7 | 108 ± 4 | 7 | 93 ± 4 | 9 | 85 ± 6 | 5 |
| Stirling | 89 ± 6 | 5 | 97 ± 1 | 8 | 90 ± 8 | 5 | 98 ± 2 | 7 | 89 ± 3 | 9 | 87 ± 3 | 5 |
| Site mean yield (t/ha) | 2.23 | 5 | 2.64 | 9 | 4.41 | 7 | 2 | 7 | 2.66 | 9 | 2.84 | 5 |
Results
The MET analysis indicates that there was G x E present across Agzones in barley variety performance (Table 2). The genetic variation in an Agzone ranged from 10% to 17%, averaging 14 ± 1%. Buloke was generally the highest ranked variety in each Agzone (except Agzone 4 where it was equal to Mundah) and Stirling the lowest ranked variety. Baudin and Gairdner were generally similar to each other except in Agzones 3 and 4.
A single location was chosen from each Agzone – Mingenew (Agzone 1), Wongan Hills (Agzone 2), Frankland (Agzone 3), Merredin (Agzone 4), Jerramungup (Agzone 5) and Munglinup (Agzone 6) – where there was at least 5 years of data (Table 3). The correlation of a single location to the MET varies as the number of locations within an Agzone is different for each Agzone (Table 1).
As with the MET analysis there was G x E present across the six locations chosen (Table 3). The G x E ranged from 6% to 21% across locations, averaging 15 ± 2%. The ranking of varieties however changed relative to the MET analysis. Buloke was the highest yielding variety at Mingenew and Frankland, as it was for Agzones 1 and 3. At Wongan Hills (Agzone 2) and Merredin (Agzone 4), however, it was similar to Mundah and at Jerramungup (Agzone 5) similar to Gairdner. Mundah performed better at Wongan Hills than it did across Agzone 2. Baudin was the highest yielding variety at Munglinup, but not the highest in Agzone 6. The standard error data suggests that some varieties were more variable than others across locations (Table 3).
Mingenew
For Agzone 1 (2005-2014) and at the Mingenew NVT sites (2010-2014) Buloke had the highest yield and Stirling the lowest of those selected for this paper (Tables 2 and 3). PV-PLUS indicates that Buloke was the most stable variety (Figure 1), but not always the highest yielding variety in every year. Stirling was generally lower yielding than the other varieties except in 2014. In the two high yielding years 2010 and 2011, Mundah went from equal highest yielding (2010, PV = +0.15 t/ha) to equal lowest yielding (2011, -1.00 t/ha). The yield advantage of Buloke increased as site mean yield increased, whereas the yield deficit of Stirling increased as site mean yield increased.
Why did Mundah and Stirling do so poorly in 2011? This is where local knowledge and use of the limited site characteristics (i.e. soil type, pH, growing season rainfall and trial notes available at NVT Online, nvtonline.com.au) will be useful in helping to understand the variability. The site information indicates that lodging and head loss was present at the site, but Mundah and Stirling were not significantly different from Buloke. Rainfall patterns may have been important as Mundah and Stirling both flower at least 10 days earlier than Baudin, Buloke and Gairdner with April planting (Paynter 2015). Across years the varietal yield difference ranged between 0.05 to 1.01 t/ha, but in most years the differences were less than 0.5 t/ha. The average varietal range was 0.41 ± 0.17 t/ha.
At this location the recommendation of Buloke based on the MET would have delivered the highest average grain yield over the period of 2010-2014 and the best or equal best grain yield in four out of the five years relative to sowing Baudin, Mundah, Gairdner or Stirling. To determine if this resulted in the highest profit the grain quality data available at NVT Online needs to be assessed.
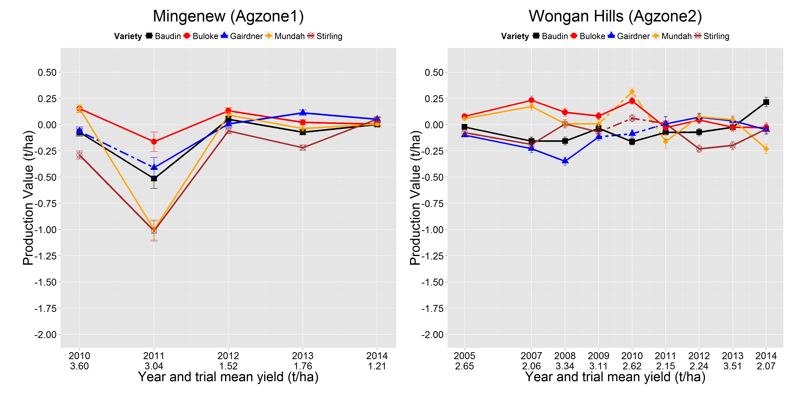
Figure 1. PV-PLUS graphs for (L) Mingenew (Agzone 1) for 2010-2014 (5 years) and (R) Wongan Hills (Agzone 2) for 2005-2014 (9 years).
Wongan Hills
For Agzone 2 (2005-2014) and at the Wongan Hills NVT sites (2005-2014) Buloke had the highest yield (Tables 2 and 3). PV-PLUS indicates that Buloke was one of the more stable varieties (Figure 1), but not always the highest yielding variety in every year. Baudin was also very stable and the highest yielding variety in 2014. For 2005-2009, Gairdner was one of the lower yielding varieties, but for 2011-2013 it was the equal highest yielding variety. This observation was not related to site mean yield. Mundah tracked closely with the performance of Buloke across years except for 2014. Whilst lodging and head loss was present at the site and with both Buloke and Mundah susceptible, the field notes do not assist in determining if this was a cause of the differences observed in 2014. Across years the varietal yield difference ranged between 0.17 to 0.47 t/ha, with a low average varietal range of 0.33 ± 0.04 t/ha.
At this location the recommendation of Buloke would have delivered the highest average grain yield over the period of 2005-2014. Only in 2014 would have selecting another variety resulted in a grain yield improvement over Buloke.
Frankland
For Agzone 3 (2005-2014) and at the Frankland NVT sites (2008-2014) Buloke had the highest yield (Tables 2 and 3). PV-PLUS indicates that Buloke was one of the more stable varieties (Figure 2), except 2008 and the highest yielding variety from 2011-2014 at that location. Gairdner was also a relatively stable variety but lower yielding than Buloke. Baudin, Mundah and Stirling were variable in their yield performance and their relative performance versus Buloke and Gairdner decreased as site mean yield increased. Leaf disease may have contributed to their poor performance before 2013, as all three varieties are susceptible to powdery mildew (Paynter et al 2014). Mundah and Stirling were only good in years with a low yield potential. This location had the largest G x E across years of the six locations presented (Figures 1, 2 and 3), with yield differences between varieties of 0.58 to 2.08 t/ha. The average varietal range was 1.28 ± 0.24 t/ha.
At this location the recommendation of Buloke based on the MET averaged on Agzones would have delivered the highest average grain yield over the period of 2008-2014. It is only in 2008 and 2009 (a dry year) would have selecting another variety resulted in a yield improvement over Buloke.
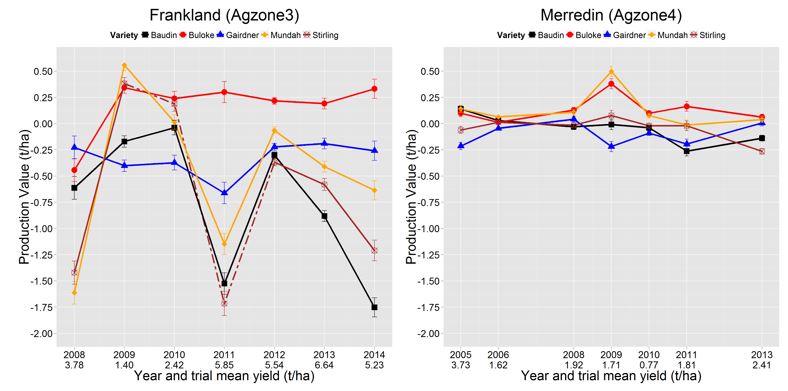
Figure 2. PV-PLUS graphs for (L) Frankland (Agzone 3) for 2008-2014 (7 years) and (R) Merredin (Agzone 4) for 2005-2013 (7 years).
Merredin
For Agzone 4 (2005-2014) and at the Merredin NVT sites (2005-2013) Buloke and Mundah had the highest yield and Gairdner the lowest (Tables 2 and 3). PV-PLUS indicates Buloke and Mundah were the highest yielding varieties in three of the seven years trials and equal best in three years. Most varieties were also relatively stable in their yield relative to the site mean yield, except for 2009 (Figure 2). In 2009 Buloke and Mundah were clearly higher yielding than the other varieties. Across years the varietal yield difference ranged between 0.11 to 0.72 t/ha, with a low average varietal range of 0.33 ± 0.08 t/ha.
At this location Buloke was as good as Mundah from 2005–2013 and the decision to recommend one or the other only made a difference in 2009 and 2011. This does not take into account the potential integrated weed management advantages of Mundah for later sowing opportunities or the likelihood of Buloke meeting malt barley specifications.
Jerramungup
For Agzone 5 (2005-2014) and at the Jerramungup NVT sites (2005-2014) Buloke had the highest yield and Stirling the lowest (Tables 2 and 3). PV-PLUS, however, indicates that Buloke was only the highest yielding variety in 2011 and equal highest in 2005 and 2010 (estimated) (Figure 3). Baudin and Gairdner out yielded Buloke in four (2007, 2008, 2013 and 2014) and two (2006 and 2007) of the nine years of data respectively, but their yield was generally more variable than Buloke. Selecting Baudin instead of Buloke would have resulted in a yield advantage of 0.33 t/ha in four seasons, a yield disadvantage of 0.55 t/ha in four seasons and the same yield in one season. Selecting Gairdner instead of Buloke would have resulted in a yield advantage of 0.29 t/ha in two seasons, a yield disadvantage of 0.32 t/ha in four seasons and the same yield in three seasons. Baudin did better in the good seasons and was worse in the poorer seasons relative to Buloke and Gairdner. Baudin would have benefited from the implementation of a full disease control program in barley NVT from the 2013 season, as both 2013 and 2014 were high yielding trials. Mundah and Stirling were more competitive in the lower yielding years, but were less suited to the higher yielding years. Across years the varietal yield difference ranged between 0.29 to 0.98 t/ha, with an average varietal range of 0.66 ± 0.09 t/ha.
At this location the recommendation of sowing Buloke based on the MET averaged on Agzones would not have resulted in growers maximising their yield in each year. Baudin, Buloke and Gairdner each shone in different seasons.
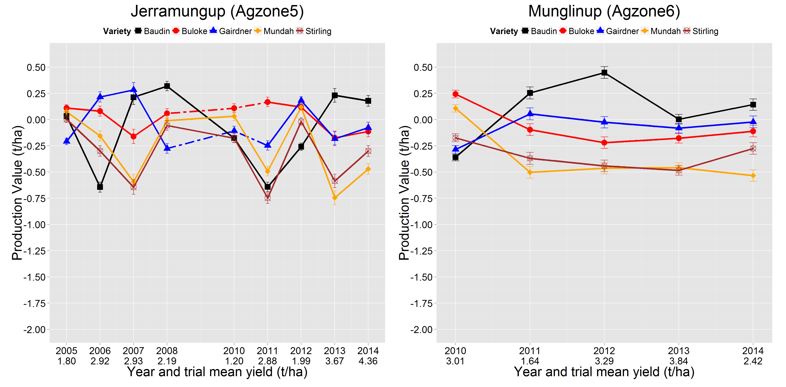
Figure 3. PV-PLUS graphs for (L) Jerramungup (Agzone 5) for 2006-2014 (9 years) and (R) Munglinup (Agzone 6) for 2010-2014 (5 years).
Munglinup
For Agzone 6 (2005-2014) Buloke had the highest yield and Stirling the lowest (Table 2). At the Munglinup NVT sites (2010-2014) Baudin was the highest yielding variety and Stirling the lowest (Table 3). PV-PLUS indicates that Baudin was better than Gairdner and Gairdner better than Buloke in all years except 2010 (Figure 3). Powdery mildew was present in 2010 at the site and may have been one of the reasons for the change in ranking, as both Baudin and Gairdner are more susceptible than Buloke (Paynter et al 2014). Mundah and Stirling were similar to each other except in 2010 and 2014. Across years the varietal yield difference ranged between 0.49 to 0.91 t/ha, with an average varietal range of 0.69 ± 0.07 t/ha.
At this location the recommendation of sowing Buloke based on the MET averaged on Agzones would not have resulted in growers maximising their grain yield. Baudin would have delivered the highest grain yield over the period of 2011-2014, but not in 2010. Using the MET averaged on Agzones recommendations for this location would have resulted in an average yield penalty of 0.36 t/ha over four years and a yield gain of 0.60 t/ha in one year.
Conclusion
For Baudin, Buloke, Gairdner, Mundah and Stirling, the MET results (averaged on Agzones) suggested that Buloke was the highest yielding variety in each Agzone. In looking at one location from each Agzone (42 trials in total), recommending Buloke would have been the best choice in 26% of trials and the equal best choice in 36% of trials. So in nearly two thirds of trials Buloke was a suitable recommendation based on the MET results averaged on Agzones. But in one third of trials, there were higher yielding choices than Buloke. Munglinup (Agzone 6) is one example where the MET results averaged on Agzones and PV-PLUS do not agree and demonstrates the value of PV-PLUS in improving grower knowledge of varietal performance in their local area.
The grain yield comparison of five varieties, differing in their phenotype for the period 2005-2014, clearly indicates that those varieties that yield well in the MET results averaged on Agzones are also likely to do well at individual locations within an Agzone. G x E exists and whilst a variety may have a high average yield there will be years and locations when it is not the highest yielding variety. PV-PLUS displays the seasonal variation. Only local knowledge combined with use of the site characteristics provided by NVT can retrospectively help pinpoint why there may have been large varietal instability across seasons at a location. Yield potential may explain some of the differences observed. Head loss and lodging could have been factors. In some seasons, frost may have had a large impact, whilst leaf disease pressure (pre-2013) may have influenced some of the comparisons between varieties. The impact of leaf disease on varietal performance should be reduced as a factor as all barley NVT are now being managed (since 2013) to keep leaf disease below 5% leaf area infected. The ability to be able to predict the type of season or even manage each variety’s weaknesses (i.e. disease resistance, lodging, head loss) is the key to selecting the right variety for a location using historical knowledge and data.
The MET analysis is a retrospective analysis and whilst it cannot predict what might happen, it can help growers / consultants identify those varieties with variable yield, those with stable yield and those which yield either higher or lower than other varieties. As PV-PLUS graphs only relate to the specific sowing date, soil type, seasonal conditions and management that applied at that site in that year, a change of sowing or soil type for example may have resulted in a different outcome. On-farm experience may therefore differ from published data. When selecting varieties it is advisable to look across several locations to see if the variability or yield potential present at your local site is also present at neighbouring locations. This can help provide confidence in the reliability of your preferred varieties.
The MET analysis cannot tell us what the probability of the malt barley varieties being received into premium paying malt barley grades will be, as it does not predict the quality of their grain associated with their yield at a site / location. High yield does not always result in the highest profit. Grain quality data (from a harvested sample combined over reps), however, is available for each site at NVT Online.
In conclusion, the MET analysis allows growers / consultants to see the variability (and complexity) in the grain yield performance of barley varieties over different locations and seasons. The grain yield results from NVT trials, however, needs to be balanced with knowledge of the agronomy, disease resistance, grain quality, segregation opportunities and market demand when deciding on which barley variety to sow.
References
- Butler DG, Cullis BR, Gilmour AR and Gogel BJ (2009). ASReml-R reference manual (version 3).
- Lisle C (2015). MET analysis of NVT barley trials 2005-2014. Statistics for the Australian Grains Industry Technical Report.
- Paynter BH (2015). Seasonal and genetic differences in the phenology (duration to awn emergence) of barley when sown in late April through to early July. In Proceedings of 2015 Agribusiness Crop Updates, 24-25 February 2015, Perth.
- Paynter BH, Hills AL, Gupta S, Collins S, Dhammu H, Malik R and Trainor G (2014). Bulletin 4860 – 2015 Barley variety sowing guide for Western Australia. Department of Agriculture and Food Western Australia, Perth.
- Smith A, Cullis BR and Thompson R. (2001a). Analysing variety by environment data using multiplicative mixed models and adjustments for spatial field trend. Biometrics 57, 1138-1147.
- Smith AB, Cullis BR and Gilmour A. (2001b). The analysis of crop variety evaluation data in Australia. Australian and New Zealand Journal of Statistics 43, 129-145.
- Smith AB, Ganesalingam A., Kuchel H and Cullis BR (2015). Factor analytic mixed models for the provision of grower information from national crop variety testing programs. Theoretical and Applied Genetics pages 128, 55–72.
Acknowledgments
The authors acknowledge the access to the data from the National Variety Trials (NVT) and the NVT trial co-operators for their management of barley NVT in Western Australia.
GRDC Project Code: DAW00224 and UOW00005,
Was this page helpful?
YOUR FEEDBACK