Nitrogen management in wheat 2014
Author: Richard Daniel, Rachel Norton, Anthony Mitchell and Linda Bailey - Northern Grower Alliance | Date: 25 Feb 2015
Take home messages
- Despite a generally moisture limited season, significant grain protein responses were measured at all ‘enhanced’ urea trial sites
- The rate of nitrogen applied was the critical factor in all ‘enhanced’ urea trials
- No ‘enhanced’ urea product provided any significant benefit compared to urea alone with ESN resulting in significantly reduced biomass and grain protein at two of the four sites
- Urea at 100 kg N/ha spread post sowing, and with no physical incorporation, provided at least equivalent crop responses to urea at 100 kg N/ha spread and incorporated by sowing
- A split application of urea at 50 kg N/ha incorporated by sowing followed by 50 kg N/ha spread in-crop at ~GS31 provided at least equivalent crop responses to urea at 100 kg N/ha spread and incorporated by sowing
- There was no significant impact on screenings at any site from nitrogen application at up to 200 kg N/ha
- Late foliar nitrogen application increased protein in only one of four trials
- At the responsive site, mean protein increases of 1-1.5% were obtained but net benefits were only obtained from four of fourteen treatments ($9-33/ha)
- Multiple application of low rates did not improve agronomic or economic benefits
- Foliar applications of 20 kg N/ha trended to improved efficiency of grain N recovery and economic returns compared to applications of 40 kg N/ha
NGA have been heavily involved in projects focused on nitrogen management in wheat during 2012 to 2014. The key aim in 2012 and 2013 was to evaluate the impact and fit of late nitrogen application (from awn peep onwards) to manipulate grain protein. Benchmark treatments in 2013 included the equivalent quantity of nitrogen added at sowing or split between sowing and the start of stem elongation.
In 2014 NGA conducted two distinct projects involving nitrogen management; 1) The impact and fit of ‘enhanced’ urea products applied at planting, and 2) The impact of lower or multiple rates of late application foliar nitrogen. The second project was designed to complement and conclude the 2012-2013 activity.
1. Comparison of urea and a selection of ‘enhanced’ urea products applied at sowing
This project was designed to evaluate the impact from ‘enhanced’ urea products under northern conditions. Benefits may be obtained by reducing N losses or by delaying the release of nitrogen to better match crop needs. Two of the products were polymer coated formulations that slow the N availability in an attempt to provide a canopy management benefit (ie slow the early crop growth to allow more moisture at grain fill and provide more of the N late in the crop to benefit protein levels). The other two products were nitrification inhibitors which impact on the soil bacteria Nitrosomonas to slow the conversion of ammonium to nitrate and reduce denitrification and leaching losses.
Table 1. Urea and ‘enhanced’ urea products and rates used in 2014 trials
|
Product |
Urea |
‘Enhanced’ urea products |
|||
|
ESN |
Agrocote N38 |
eNtrench |
Entec |
||
|
Rates kg N/ha as IBS |
50, 100, 200 |
50, 64*, 100 |
50, 84*, 100 |
50, 62*, 100 |
50, 89*, 100 |
|
Formulation or Active ingredient |
- |
Polymer coated urea |
Polymer coated urea |
Nitrapyrin |
DMPP |
|
Mode of action |
- |
Controlled release |
Controlled release |
Nitrification inhibitor |
Nitrification inhibitor |
|
Application |
- |
60% ESN blend with 40% Urea |
30% Agrocote blend with 70% Urea |
2.5 L/ha on urea |
Urea pretreated |
IBS = Surface spread and Incorporated By Sowing
*For each ‘enhanced’ urea product, the middle rate was an equivalent cost to a 100 kg N/ha applied as urea. All comparisons in this paper between ‘enhanced’ products and urea alone are for the 50 and 100 kg N/ha rates only.
There were two extra urea alone treatments not listed in Table 1; 100 kg N/ha spread on the soil surface immediately post sowing (PSPE) and a split application treatment of 50 kg N/ha IBS and 50 kg N/ha spread in-crop at ~GS30 was also evaluated.
Five trials were established in 2014 in paddocks nominated by agronomists as low in nitrogen or likely to be N responsive. Unfortunately the site near Moree became severely moisture stressed with grain yields below 600 kg/ha and associated high variability. Data from this site has not been presented.
All trials were established with small plot planters using row spacings of 32-36cm and plot lengths of 8-12m. EGA Gregory was evaluated in all trials with 4 replicates at all sites.
Table 2. Urea and ‘enhanced’ urea products site details 2014
|
Location |
Narrabri (AM1410) |
Gunnedah (AM1411) |
Tummaville* (LB1412) |
Biniguy (RN1415) |
|
Sowing Date |
11/6/14 |
10/6/14 |
23/7/14 |
20/5/14 |
|
Available soil nitrogen at sowing (kg N/ha) |
128 (0-60cm) |
138 (0-60cm) |
100 (0-90cm) |
42 (0-60cm) |
|
Basal starter application to all plots |
Granulock Z 80kg/ha |
Granulock Z 100kg/ha |
Granulock Z 80kg/ha |
Granulock Z Extra 40kg/ha |
|
In-crop rainfall (mm) |
111 |
164 |
138 |
144 |
|
Timing and quantity of first rain post sowing |
3DAA 26mm |
4-5DAA 23mm |
3DAA 1mm 24DAA 25mm |
1-2DAA 2mm 9DAA 5mm |
|
In-crop application – date and growth stage |
13/8/14 (GS30) |
13/8/14 (GS31) |
16/9/14 (GS30) |
22/7/14 (GS30) |
|
Timing and quantity of rain post in-crop application |
3-5DAA 32mm |
3-6DAA 31mm |
6DAA 5mm 9-10DAA 18mm |
5DAA 1mm 25DAA 54mm |
|
PreDicta B – Crown Rot |
Low |
BDL |
Not analysed |
BDL |
|
PreDicta B – RLN |
BDL |
Medium Pt (2.0/g soil) |
Medium Pt (7.1/g soil) |
Medium Pt (2.6/g soil) |
Available soil nitrogen = total soil mineral N kg/ha (to soil depth) using a bulk density of 1.3. It does NOT include any mineralisation credit. DAA= Days after application. BDL= Below detection level.
*Tummaville is a locality near Millmerran on the southern Darling Downs. It was a late planted, irrigated site that was a replacement for an intended dryland trial that failed to receive sufficient planting rain.
Results
Biomass responses
NDVI (Normalised Difference Vegetation Index) was used to provide an objective measurement of nitrogen response between treatments. Higher NDVI results indicate larger biomass and/or greener treatments.
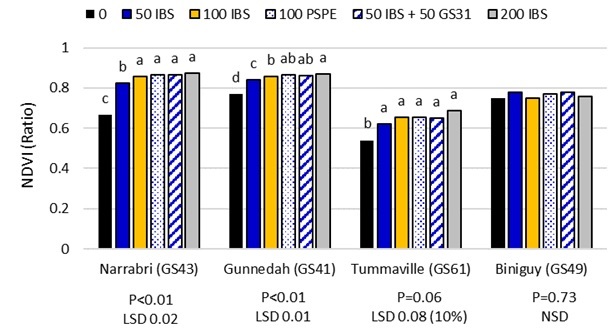
Figure 1. Effect of N rate (kg N/ha), application method and timing on NDVI from urea alone in 2014
Treatments that share the same letter within each site are not significantly different at P=0.05, except Tummaville P=0.10. The main crop growth stage at the NDVI assessment is shown in brackets for each site. NSD = No significant difference
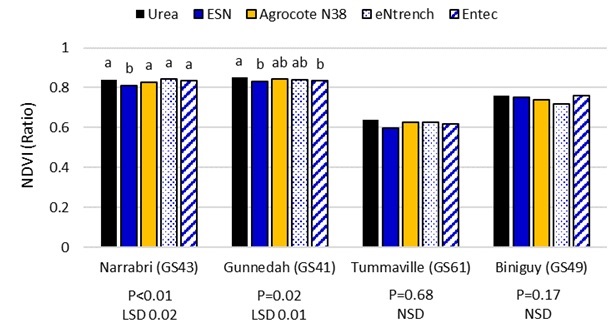
Figure 2. Mean effects from urea and ‘enhanced’ urea products on NDVI in 2014
Treatments that share the same letter within each site are not significantly different at P=0.05.
The main crop growth stage at the NDVI assessment is shown in brackets for each site. NSD = No significant difference. Means presented are from factorial analysis of all five products at both 50 and 100 kg N/ha
- Nitrogen rate was the major factor affecting NDVI results (Figure 1)
- 50 kg N/ha significantly increased NDVI compared to the untreated at 3 of the 4 sites
- 100 kg N/ha significantly increased NDVI compared to the 50 kg N/ha rate at both Narrabri and Gunnedah
- There was no significant difference in NDVI, at any site, between the 100 kg N/ha treatments applied IBS, PSPE or split between IBS and GS31
- There was no significant difference in NDVI between urea alone and eNtrench or Agrocote N38 at any site
- Both ESN and Entec significantly reduced NDVI at Gunnedah and ESN also resulted in significantly reduced NDVI at Narrabri compared to urea alone
Key points:
Significant crop growth responses to nitrogen were recorded at 3 of the 4 sites with nitrogen rate the main factor. Conditions for incorporation of nitrogen spread after planting or at GS31 were sufficient to provide equivalent results to the IBS application. ESN provided the most consistent ‘canopy management’ difference to urea alone and significantly reduced NDVI results at 2 of the 4 sites.
Yield
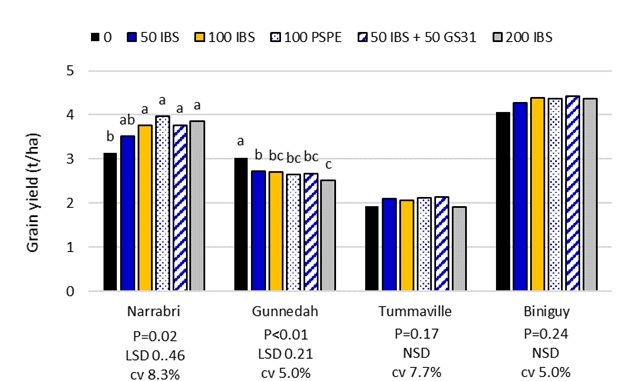
Figure 3. Effect of N rate (kg N/ha), application method and timing on yield from urea alone in 2014
Treatments that share the same letter within each site are not significantly different at P=0.05. NSD = No significant difference
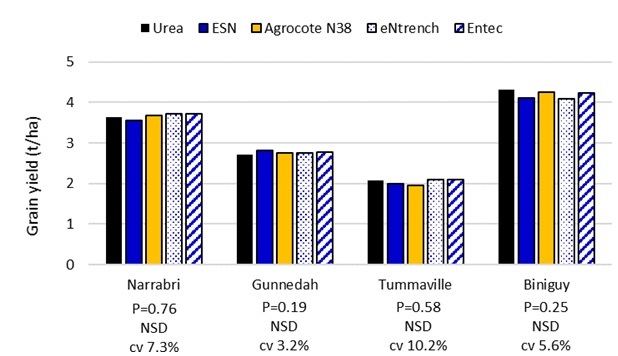
Figure 4. Mean effects from urea and ‘enhanced’ urea products on yield in 2014
Treatments that share the same letter within each site are not significantly different at P=0.05.
NSD = No significant difference. Means presented are from factorial analysis of all five products at both 50 and 100 kg N/ha
- At Narrabri there were significant yield increases compared to the untreated from 100 or 200 kg N/ha
- At Gunnedah, all nitrogen rates and timings resulted in significant yield decreases
- At both Tummaville and Biniguy there was no significant impact on yield from any nitrogen treatment
- At the two responsive sites, there was no significant difference between the 100 kg N/ha treatments applied IBS, PSPE or split between IBS and GS31
- There was no significant difference in yield between any ‘enhanced’ urea product and urea alone at any site
Key points:
Although the addition of nitrogen produced significant crop growth benefits at 3 of the 4 sites, yield benefits were only recorded at Narrabri. Nitrogen rate was the key factor affecting yield with no significant difference between the ‘enhanced’ urea products and urea alone at any site. The most likely explanation for the negative yield response at Gunnedah is a combination of planting date, low to moderate starting soil moisture (following canola in 2013) and extreme temperatures during grain fill in late October. Yields were disappointing at the Tummaville site, despite frequent irrigations. The late planting resulted in flowering just prior to the late October heat extremes.
Grain protein
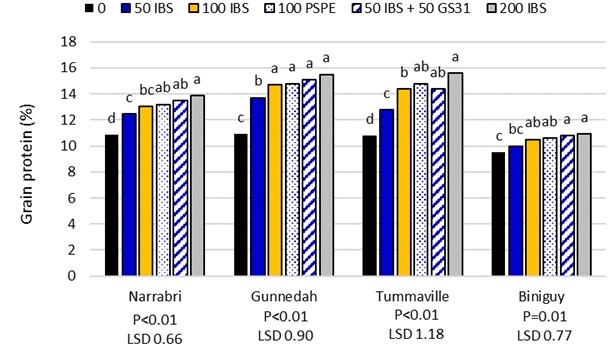
Figure 5. Effect of N rate (kg N/ha), application method and timing on grain protein from urea alone in 2014
Treatments that share the same letter within each site are not significantly different at P=0.05.
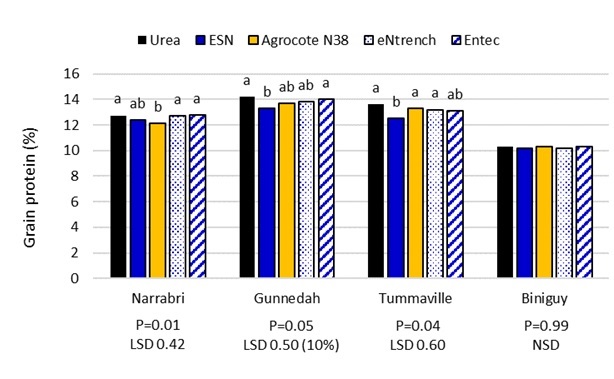
Figure 6. Mean effects from urea and ‘enhanced’ urea products on grain protein in 2014
Treatments that share the same letter within each site are not significantly different at P=0.05, except Gunnedah P=0.10.
NSD = No significant difference. Means presented are from factorial analysis of all five products at both 50 and 100 kg N/ha
- Untreated grain protein levels ranged from 9.5 to 10.9%
- All urea rates and timings resulted in significant protein increases at all sites except the 50 kg N/ha urea treatment at Biniguy
- All treatments of 100 kg N/ha or more, resulted in protein levels >13% at Narrabri, Gunnedah and Tummaville
- Although the Biniguy site recorded significant protein increases, the maximum protein recorded was <11%
- There was no significant difference in protein level between the 100 kg N/ha treatments applied IBS, PSPE or split between IBS and GS31. However the split application trended to increased protein compared to the IBS application at Narrabri, Tummaville and Biniguy
- No ‘enhanced’ urea product provided any significant increase in grain protein compared to urea alone at any site
- Agrocote N38 (at Narrabri) and ESN (at Gunnedah and Tummaville) resulted in significantly lower protein levels than urea alone
Key points:
Despite the mixed yield results from the additional nitrogen, all sites recorded significant protein responses with the highest protein achieved at 200 kg N/ha in all trials. The split application of urea (50 kg N/ha IBS + 50kg N/ha ~GS30) had significantly higher protein than 50 kg N/ha IBS and resulted in at least equivalent protein levels to 100 kg N/ha IBS at all sites. This indicated that the in-crop application had been effective at all sites.
The addition of nitrogen improved grain receival grades at all sites. The largest improvements were at Narrabri and Tummaville where the untreated was APW grade and grain from the 100 kg N/ha IBS treatment was APH2 or APH1 at the two sites respectively. At Gunnedah application of nitrogen improved the receival grade from GP to AUH2 and at Biniguy the change was from ASW to APW.
Screenings
Screening levels were <2% from all treatments at Narrabri, Tummaville and Biniguy with no significant difference between product or nitrogen rate. At Gunnedah, screenings levels were between 6 and 8% with no significant difference between any nitrogen rate or product and the untreated.
Grain nitrogen recovery
The grain nitrogen recovery (yield kg/ha x protein/100 x 0.175) was calculated to assess the efficiency of fertiliser use. Even at 50 kg N/ha, the recovery levels at Gunnedah, Tummaville and Biniguy were low and varied between 13 and 22%. The Narrabri site had the highest grain N recovery of 34%. Soil and stubble testing is being conducted to determine the fate of the remaining nitrogen.
Economics
The maximum spread in receival grade prices at the end of October 2014 was only ~$25/t. As a result, yield was the main driver of economic benefit. Figure 7 shows the net benefit/loss across all sites for urea alone.
At Narrabri there was no significant difference in yield or grain receival grade between urea and the ‘enhanced’ urea products. However there was a significant benefit in both yield and grain protein by applying 100 kg N/ha compared to the 50 kg N/ha rate.
All rates of urea - except the 200 kg N/ha rate – provided a net benefit ranging from $46-151/ha. All rates of Agrocote N38, eNtrench and Entec also provided a net benefit with a range from $12-123/ha (Figure 8). All ESN rates however resulted in a net loss of between $9 and 40/ha.
Despite significant improvements in grain protein levels at Gunnedah, Tummaville and Biniguy, all nitrogen treatments resulted in a net loss.
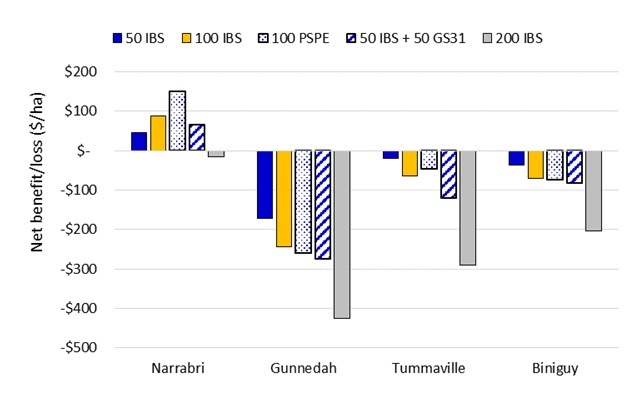
Figure 7. Effect of N rate (kg N/ha), application method and timing on net benefit from urea alone in 2014
Assumptions: urea at $1.30/kg N ($600/t), spreading cost of $25/ha/application, grain prices delivered Moree 29/10/14 APH1 $293/t, APH2 $288/t, H2 $277/t, APW/ASW/GP $267/t
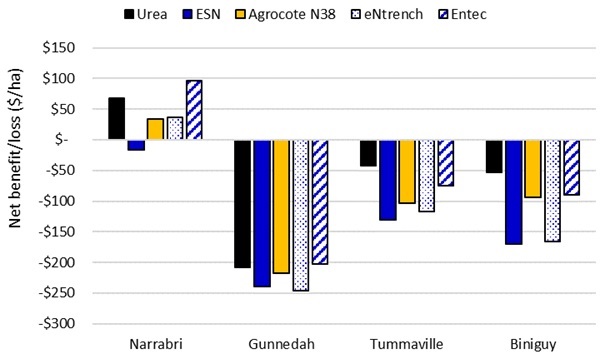
Assumptions: urea at $1.30/kg N ($600/t), spreading cost of $25/ha/application, grain prices delivered Moree 29/10/14 APH1 $293/t, APH2 $288/t, H2 $277/t, APW/ASW/GP $267/t. Means presented are from factorial analysis of all five products at both 50 and 100 kg N/ha
Conclusions – Impact and fit of ‘enhanced’ urea products
2014 was not an ideal year to evaluate ‘enhanced’ urea products. Even in situations with untreated protein levels at or below 11%, factors other than nitrogen were generally more important for yield determination. However there were clear and significant nitrogen responses in crop biomass at 3 of the 4 sites and in protein levels at all sites which still allowed sound treatment comparisons:
- Under conditions where useful rain was received within 3 to 24 days after sowing, urea spread immediately post sowing (PSPE) provided at least equivalent benefits to the same quantity incorporated by sowing
- Under conditions where useful rain was received within 3 to 25 days after in-crop spreading at ~GS30, split application of urea with 50% IBS and 50% in-crop provided at least equivalent benefits to 100% IBS
- There was no benefit from the nitrification inhibitor products at any site compared to urea alone. Benefit from these products is most likely to occur under wetter conditions resulting in denitrification or leaching losses
- There was no benefit from the polymer coated products at any site compared to urea alone. However ESN in particular did appear to provide a significant canopy management benefit indicating reduced/slower N availability. However there was also a clear trend to lower grain protein from ESN treatments. Soil sampling may help to determine whether the ESN availability was delayed ‘too long’
- In terms of crop growth and grain protein, the rate of nitrogen applied was the most critical factor
2. Late foliar application of nitrogen for grain protein – are lower/ multiple rates the answer?
NGA conducted a total of 11 trials during 2012 and 2013 to evaluate the impact from late nitrogen application on protein levels in wheat. Nitrogen solutions were applied at a rate of 40 kg N/ha in an attempt to ensure that protein differences could be reliably measured. Despite the high rate, leaf scorch or tipping was generally minor.
Although significant increases in grain protein were generated, there was no net benefit at any site. The project activity in 2014 was designed to examine whether a lower rate of N, or multiple low rates of N, may provide improved efficiency of uptake and deliver economic benefits.
The products used in 2014 were Ranger – a 24% N aqueous urea solution - and an experimental urea formulation with added macro and micronutrients. Both products were evaluated at the equivalent rate of nitrogen.
Four trials were established in 2014. Two trials were conducted in commercial crops with the other trials conducted at the Tummaville site, adjacent to the ‘enhanced’ urea trial, in a ‘planted small plot’ design. One of the Tummaville trials was on the site’s exitsting low N background, the second was on a high N background where 107 kg N/ha was applied prior to planting. EGA Gregory was evaluated in all trials. Plot sizes varied from 2-4m width x 8-12m length, all with 4 replicates.
Three foliar application timings were evaluated with single application treatments of 20 or 40 kg N/ha at all timings. Timing 1 was planned for awn peep to early head emergence (GS49-GS55), timing 2 for early flowering (GS61) and timing 3 was planned for ~ 10 days after timing 2. It was hoped that these timings would generate a timing response curve.
In addition, two multiple application treatments were evaluated. Applications of 20 kg N/ha at both timings 1 & 2 or applications of 13.3 kg N/ha at timings 1, 2 & 3. Both multiple application treatments applied a total of 40 kg N/ha. Table 3 shows the timings and growth stages in each trial.
Table 3. Late N application timings and growth stages
|
Application timing |
1 |
2 |
3 |
|
Yallaroi (RN1421) |
30/8/14 (GS51) |
11/9/14 (GS65) |
22/9/14 (GS71) |
|
Mullaley (AM1418) |
14/9/14 (GS49) |
24/9/14 (GS61-65) |
4/10/14 (GS65-71) |
|
Tummaville High N (LB1413) |
21/10/14 (GS49) |
30/10/14 (GS61) |
5/11/14 (GS71) |
|
Tummaville Low N (LB1416) |
21/10/14 (GS49) |
29/10/14 (GS61) |
5/11/14 (GS71) |
Untreated grain yields and protein contents were: Yallaroi 3.5t/ha and 11.2%, Mullaley 5.9t/ha and 9.2%, Tummaville High N 2.0t/ha and 15.2%, Tummaville Low N 2.0t/ha and 10.8%.
Results
Yield and protein
Late application of nitrogen did not significantly impact on yield in any trial – as expected. At Yallaroi, and at both Tummaville sites, there was no significant difference in grain protein level between any treatment and the untreated grain.
However, at the high yielding and low protein site, at Mullaley there were significant increases in protein from all treatments except Ranger at 20 kg N/ha applied at GS49. Figure 9 shows the results from the factorial analysis of product x rate x application timing. Figure 10 shows the performance of the multiple application treatments compared to the equivalent total nitrogen rate applied at the individual application timings.
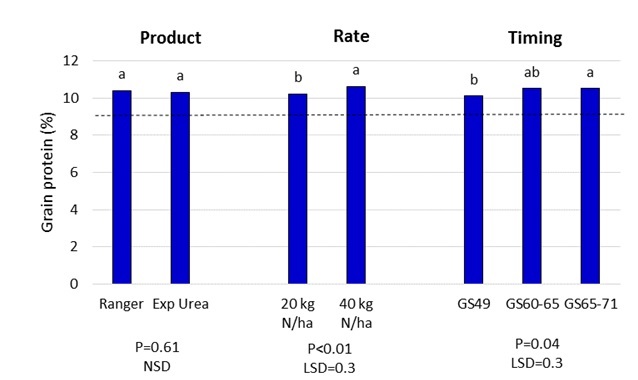
Figure 9. Effect of late nitrogen application product, rate and timing on grain protein level, Mullaley 2014
Treatments that share the same letter within each group are not significantly different at P=0.05. NSD = No significant difference. The broken line indicates the protein level achieved in the untreated grain (9.2%)
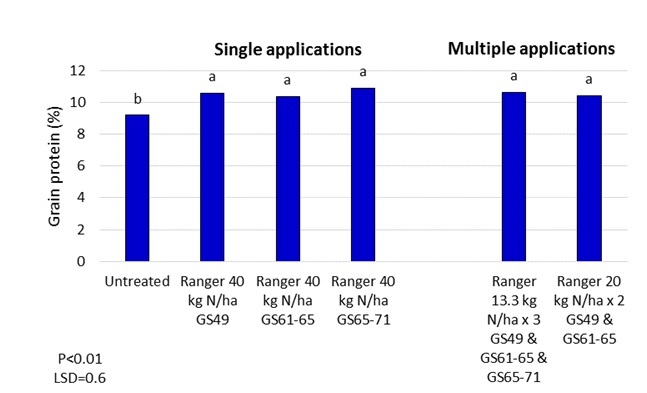
Figure 10. Effect of multiple late nitrogen application on grain protein level, Mullaley 2014
Treatments that share the same letter are not significantly different at P=0.05.
- There was no significant difference between the two urea formulations with both increasing mean grain protein by 1.1 to 1.2% compared to the untreated
- The 40 kg N/ha rate significantly increased grain protein compared to the 20 kg N/ha
- The largest increases in grain protein were achieved from nitrogen application during flowering
- There was no significant difference in grain protein level from multiple applications of low nitrogen rates compared to the equivalent nitrogen rate applied in a single application
- The largest protein increases compared to the untreated (+1.7 to 1.8%) were achieved from a single 40 kg N/ha application of either urea formulation at GS65-71
Key points:
Large responses in protein level were achieved in this trial with the main factors being product rate and application timing. There was no protein benefit from multiple low rate application of nitrogen compared to a single application of the equivalent rate at this location.
Screenings and test weight
There was no significant difference in screenings or test weight between any treatment and the untreated. Screenings were below 2% at Yallaroi and Mullaley but between 6-10% at Tummaville.
Grain N recovery
The Mullaley trial had the highest levels of grain N recovery of all 15 late N application trials conducted during 2012 to 2014. The mean level of recovery was ~50% with an individual treatment range from 26-98%. Factorial analysis did not show any significant difference in total grain N recovery between product, rates or timings. The highest mean recovery (64%) was achieved using the 20 kg N/ha rates compared to 38% when 40 kg N/ha was applied.
Economics
Despite the significant increases in protein, only 6 of the 14 treatments increased the receival grade from ASW to APW. In 2014 there was no price difference between these grades. Economic analysis was based on a grain price of $267/t, Ranger at $1.8/kg N and application cost of $8/ha/application.
Four treatments provided a net benefit compared to the untreated ranging from $9-33/ha. These were the 20 kg N/ha rates of either urea formulation at GS61-65, the 20 kg N/ha rate of Ranger at GS65-71 and the multiple applications of 13.3 kg N/ha.
Conclusions – Late foliar application of nitrogen
NGA have conducted a series of 15 trials over the last three seasons on the varieties EGA Gregory and Suntop. Although none of these seasons were ideal for late foliar nitrogen application, there are some consistent conclusions from this work:
- Significant increases in protein can be gained from late foliar application of nitrogen
- The level of protein increase in these trials has only delivered economic benefit at one site and for four out of fourteen treatments at that site
- Timing differences have not been consistent but generally supported application between late head emergence and early milk stages for maximising protein
- In the 2014 trials, multiple low rate application did not appear to improve the response compared to the same rate applied in one application
- Single applications of low rates (20 kg N/ha) trended to improved efficiency of grain N recovery and economic benefits compared to single applications of 40 kg N/ha
- Largest protein responses have been obtained in four trials conducted in high yielding crops (>4.5t/ha) with low untreated grain protein levels (9-11%). At these sites protein levels increased by ~1-1.5%.
- Economic benefits will only be delivered when grain N recovery rates are high, untreated protein levels are close to a receival grade threshold and the premium between receival grades is at least $20/t
- Application of the additional nitrogen earlier in-crop (IBS or GS30) has appeared a more economic option by improving both protein and yield
The conclusions from the 2014 GRDC Update Paper ‘The effectiveness of nitrogen application for protein’ are still very appropriate “These results suggest that trying to increase wheat protein with late foliar nitrogen application is unlikely to be a very effective management tool in areas where spring rainfall is highly erratic. Unless nitrogen in grain recovery levels can be increased dramatically, grain price differentials of ~$20-40/t are probably necessary before even considering this type of approach. Supply of nitrogen requirements either prior to or at planting, or as a top up during early crop growth stages would appear a much more reliable and effective strategy. Economic benefits from nitrogen application targeting yield potential are likely to be far easier to achieve than when targeting protein increases”.
Acknowledgements
The research undertaken as part of this project is made possible by the significant contributions of growers through both trial cooperation and the support of the GRDC, the author would like to thank them for their continued support.
NGA would particularly like to acknowledge the assistance from Ken Frater, Lee Maxwell, Scott Ferguson and Michael Ledingham for 2014 trial activity together with Kalyx staff and the DAFF field evaluation team for trial planting, maintenance and harvest. In addition we would like to thank for Landmark, Impact Fertilisers, Dow AgroSciences, Incitec Pivot, Yara and Pacific Seeds for product supply and technical support.
Contact details
Richard Daniel
Northern Grower Alliance
Ph: 07 4639 5344
Email: richard.daniel@nga.org.au
GRDC Project Code: NGA00003,
Was this page helpful?
YOUR FEEDBACK