Timing of nitrogen for canola in lower rainfall areas in WA
Author: Mark Seymour, Sally Sprigg, Bob French, Raj Malik, Jackie Bucat and Martin Harries, Department of Agriculture and Food Western Australia | Date: 25 Feb 2015
Key messages
In 2013 applying nitrogen either at seeding, 4, 8 or 12 weeks after sowing provided similar responses to nitrogen.
In low rainfall areas, as nitrogen supply increases the oil% of canola often decreases at a faster rate than grain yield increases.
In the majority of instances RR canola produced higher grain yields, oil and gross margins.
Aims
To investigate the nitrogen rate and time of application response of canola in lower rainfall parts of WA.
Method
We conducted 9 nitrogen experiments in lower rainfall areas in 2013 and 8 in 2014 which compared elite hybrid and open pollinated (OP) cultivars of triazine tolerant (TT) and RoundupReady (RR) herbicide technologies (Table 2). Due to time constraints, in this document we will report on the 2013 trials and include 2014 information in the presentation. Nitrogen treatments in 2013 included 5 rates of nitrogen – 0, 25, 50, 75 and 100 kg N/ha applied as per schedule in Table 1. Gross margins were calculated taking into account grain and seed prices and herbicide costs for RR and TT varieties, oil bonuses, nitrogen fertiliser and application costs, and all other associated input costs.
Table 1: Nitrogen treatments in canola trials in 2013
| Total N applied (kg/ha) | Timing of N application(s) (Weeks after seeding) | Treatment name |
|---|---|---|
| 0 | 0 | 0N |
| 25 | 0 | 25N |
| 25 | 4 | 0N 25N |
| 25 | 8 | 0N 0N 25N |
| 25 | 12 | 0N 0N 0N 25N |
| 50 | 0 | 50N |
| 50 | 4 | 0N 50N |
| 50 | 8 | 0N 0N 50N |
| 50 | 12 | 0N 0N 0N 50N |
| 50 | 0 + 4 | 25N 25N |
| 50 | 0 + 8 | 25N 0N 25N |
| 50 | 0 + 12 | 25N 0N 0N 25N |
| 75 | 0 + 4 + 8 | 0N 50N 25N |
| 100 | 0 + 4 + 8 | 25N 50N 25N |
Results
Grain yield of canola with no applied nitrogen ranged from 0.7 to 1.7 t/ha in 2013 (mean of both varieties, Table 2). Canola yield and oil% responded to applied nitrogen at all 9 sites (Table 3). A typical response is shown in Figure 1, where oil% decreased and grain yield increased at Salmon Gums with applied nitrogen. At Salmon Gums oil reduced quicker than grain yield increased, resulting in a flat financial response at rates of applied nitrogen above 40 kg/ha. Similar responses at other sites resulted in four out of 9 sites showing no financial gain in applying nitrogen (Table 3).
Time of application of 25 or 50 kg/ha of nitrogen had no effect on grain yield in 8 out of 9 trials. Similarly oil was not affected by time of application of 25 kg N/ha in 8 out of 9 trials, whilst timing of 50 kg N/ha had a significant effect on oil at the three driest sites – Merredin, Miling North and Salmon Gums. At these sites applications near flowering at 12 weeks after sowing (WAS) reduced oil in the seed by 0.6 to 1%, with split applications (25 at seeding and 25 at 12WAS) having less effect than a single application of 50 kg N/ha near flowering. Despite the reductions in oil with delayed nitrogen application at a few sites, there was little overall effect on timing of nitrogen on gross margins, with timing of nitrogen having no significant effect in 17 out of 18 instances.
In the majority of instances RR out yielded TT canola and produced higher oil %, resulting in higher gross margins for RR in 4 out of 9 trials. However, at Salmon Gums and Merredin TT canola produced similar yields to RR and therefore higher gross margins due to lower seed costs.
Table 2. Site details, grain yield with no applied nitrogen, 90% of maximum grain yield and nitrogen applied to achieve 90% maximum yield for canola nitrogen experiments in 2013
| Location | April to October rainfall (mm) | Organic carbon (%) in top 10cm at sowing | Nitrogen (kg N/ha) in top 30cm at sowing* | Navail.# (kg N/ha) | Previous crops(2012/ 2011/ 2010) | OP TT and RR hybrid varieties | Grain yield (t/ha) with no applied nitrogen | 90% of max GY (t/ha) | N at 90% of max GY (kg N/ha) |
|---|---|---|---|---|---|---|---|---|---|
| Cunderdin | 243 | 0.86 | 36 | 42 | barley/ wheat/ pasture | ATR Stingray and Hyola 404RR | 0.7 | 0.9 | 107 |
| Eradu | 280 | 0.86 | 80 | 66 | wheat/ wheat/ lupin | ATR Stingray and Hyola 404RR | 1.1 | 1.5 | 76 |
| Holt Rock | 282 | 1.42 | 132 | 71 | barley/ barley/ wheat | CB Telfer and Hyola 404RR | 1.7 | 2 | 52 |
| Katanning | 356 | 2.91 | 86 | 139 | oats/ lupin/ hay | ATR Stingray and Hyola 404RR | 1.5 | 1.8 | 60 |
| Merredin | 204 | 0.55 | 92 | 60 | fallow | CB Telfer and Hyola 404RR | 0.8 | 1 | 61 |
| Miling North | 223 | 0.47 | 49 | 74 | wheat/ wheat/ lupin | CB Telfer and Hyola 404RR | 0.9 | 1.1 | 36 |
| Salmon Gums | 217 | 0.8 | 31 | 39 | wheat/ barley/ canola | CB Telfer and Hyola 404RR | 0.9 | 1.2 | 57 |
| Wittenoom Hills | 305 | 1.8 | 41 | 104 | barley/ wheat/ field pea | ATR Stingray and Hyola 404RR | 1 | 1.5 | 86 |
| Wongan Hills | 227 | 1.01 | 150 | 63 | wheat/ pasture/ pasture | ATR Stingray and Hyola 404RR | 1.48 | 1.53 | 23 |
* CSBP soil tests.
# Estimated using DAFWA’s Select your nitrogen (SYN) excel tool
Table 3. Results of ANOVA for the traits grain yield (GY), oil in seed (%) and gross margin ($/ha, GM) from 2013 nitrogen trials
| Treatments | N applied (kg/ha) | Cunderdin | Eradu | Holt Rock | Katanning | Merredin | Miling North | Salmon Gums | Wittenoom Hills | Wongan Hills | # of sites with a significant response |
|---|---|---|---|---|---|---|---|---|---|---|---|
| Grain yield | - | - | - | - | - | - | - | - | - | - | - |
| N | 0 to 100 | *** | *** | ** | *** | *** | *** | *** | *** | *** | 9 out of 9 |
| Timing |
25 | ns | ns | ns | ns | * | ns | ns | ns | ns | 1 out of 9 |
| 50 | ns | ns | * | ns | ns | ns | ns | ns | ns | 1 out of 9 | |
| Timing.Variety |
25 | ns | ns | ns | ns | ns | ns | ns | ns | ns | 0 out of 9 |
| 50 | ns | ns | * | ns | ns | ns | ns | ns | ns | 1 out of 9 | |
| Variety | 0 to 100 | * | ** | ns | * | ns | * | ns | ns | * | 5 out of 9 |
| N.Variety | 0 to 100 | ns | ns | ns | ns | ns | ns | ** | ns | ns | 1 out of 9 |
| Oil in seed (%) | - | - | - | - | - | - | - | - | - | - | - |
| N | 0 to 100 | *** | ** | *** | *** | *** | *** | *** | *** | *** | 9 out of 9 |
| Timing |
25 | ns | ns | ns | ns | * | ns | ns | ns | ns | 1 out of 9 |
| 50 | ns | ns | ns | ns | ** | *** | * | ns | * | 4 out of 9 | |
| Timing.Variety |
25 | ns | ns | ns | ns | ns | * | ns | ns | ns | 1 out of 9 |
| 50 | ns | ns | ns | ns | ** | ns | ns | ns | ns | 1 out of 9 | |
| Variety | 0 to 100 | *** | *** | ns | ns | * | * | ns | ** | ** | 6 out of 9 |
| N.Variety | 0 to 100 | ns | ns | ns | ns | * | ns | ns | ns | ns | 1 out of 9 |
| Gross margin ($/ha) | - | - | - | - | - | - | - | - | - | - | - |
| N | 0 to 100 | ns | *** | ns | *** | ns | ns | *** | *** | *** | 5 out of 9 |
| Timing |
25 | ns | ns | ns | ns | * | ns | ns | ns | ns | 1 out of 9 |
| 50 | ns | ns | ns | ns | ns | ns | ns | ns | ns | 0 out of 9 | |
| Timing.Variety |
25 | ns | ns | ns | ns | ns | ns | ns | ns | ns | 0 out of 9 |
| 50 | ns | ns | ns | ns | ns | ns | ns | ns | ns | 0 out of 9 | |
| Variety | 0 to 100 | * | * | ns | ns | ** | * | * | ns | ns | 5 out of 9 |
| N.Variety | 0 to 100 | ns | ns | ns | ns | ns | ns | * | ns | ns | 1 out of 9 |
P <0.001 ***, <0.01 **, <0.05 *, ns = not significant
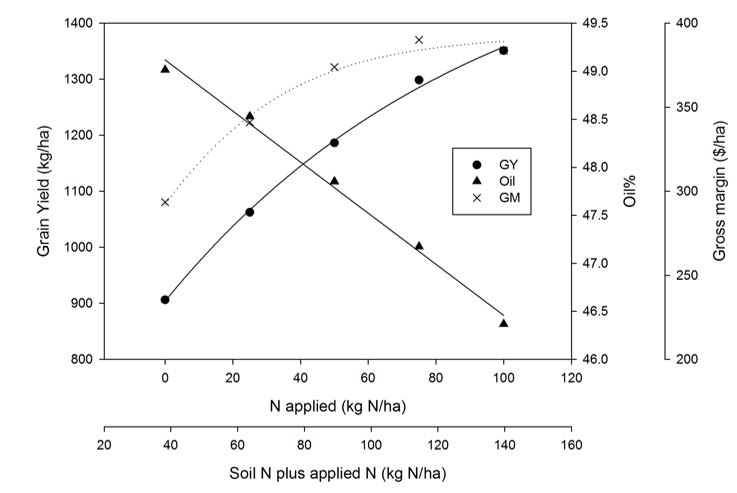
Figure 1: Response of canola grain yield (kg/ha), seed oil (%) and gross margin ($/ha) to increasing nitrogen at Salmon Gums in 2013
Conclusion
In the majority of experiments conducted in 2013, the timing of nitrogen application had no significant effect on grain yield, oil or gross margins. In a few instances applying nitrogen near flowering (12WAS) reduced the oil in canola. However the reductions were often not large enough to reduce gross margins.
Currently it is not common for farmers to apply nitrogen much later than 8 weeks after sowing. This work suggests that in seasons similar to 2013, where we had a long soft spring over much of the grain growing areas, farmers can delay their nitrogen decisions until early flowering (12 weeks). Thus farmers can play the season for a few more weeks or ‘catch-up’ if they missed their regular fertiliser time.
Acknowledgments
Pam Burgess, Joanne Walker, Stephanie Boyce, Laurie Maiolo, Andy Sutherland and Allen Randell provided technical support for this series of experiments. DAFWA RSU’s at Esperance, Geraldton, Wongan Hills, Merredin, Northam and Katanning managed the trials. Thanks are given to grower groups and individual farmers who hosted some of the trials.
GRDC Project Code: DAW00227,
Was this page helpful?
YOUR FEEDBACK