Where has all the phosphorous gone? Long term effects of alternative phosphorus sources on soil fertility.
Author: Bill Bowden, WMG, Craig Scanlan, DAFWA, Northam. | Date: 24 Feb 2015
Key messages
There are alternative sources of phosphorus (P) to overcome falling world P supplies and to address the leaching of P on poor sandy soils. This trial allows us to re-evaluate the role of a sparingly soluble source of P (C500) in providing maintenance dressings on old land.
Watch this space for insights on the improvement of soil fertility on the west Midlands sands and the use of strip testing to diagnose soil fertility and sub-soil constraint problems.
Aims
To characterise the residual value of different P sources and changes in soil fertility (SOC, CEC, pH, nutrient supply, non-wetting, compaction) after 30 plus years, using soil measurements and bioassay cropping.
Background/introduction
Current concerns with the limited supply of world A grade phosphate rock (PR) which is used for the manufacture of water soluble P fertilisers, has brought into focus the use of previously non-economic, high grade but lower manufacturing quality rock phosphate. Such deposits include the silica rich "Duchess" deposits in the Georgina basin in Queensland, as well as deposits at Mount Weld and some of the residual B and C grade ores at Christmas Island and Mount Weld which are iron and aluminium rich.
We are revisiting a long term trial at Badgingarra to gain insight into long term (~ 30 years) residual value of P from sources of differing water- and citrate P solubility. This trial was established in 1980 on new land on a grey sandy soil at Badgingarra (80Ba6 – Bolland et al 1987, AJEA 27, 647-56) and was part of a series which investigated alternative P sources in the ‘70s and ‘’80s as readily available supplies of A grade P rock (hydroxyapatite) from Australia (Narau and Christmas Islands) were running out. The field trial was conducted for 7 years from 1980 with a sown sequence of sweet lupin, sub-clover, serradella, sweet lupin, then volunteer pasture for 2 years and finally in 1986, wheat, oats and barley were sown across the plots.. We don't have precise records of land use since that time, though it is clear that the volunteer blue lupins has been growing without other treatments being applied for at least 10 years.
This trial compared the growth response and residual value of P from three sources; single superphosphate (super), C grade ore from Christmas island (C-ore) and C-ore heated to 500◦C (C-500). C-ore is a high P content (11%) material (crandallite-millesite) which is aluminium and iron rich. It is completely insoluble under non-acid conditions. When calcined (C500 - heated to 500 C), it contains 13.5% P of which 50% is citrate soluble and is more plant available. C-ore and C-500 were tested against super (9.6% P) with about 80% water soluble P which leaches on poorly buffered sands. The C-ore and C-500 could have similar chemistry to that of the end products of the reaction of soluble P with iron and/or aluminium rich soils. Insights about the long term availability of P in such sources give insights on the residual value of P from historic applications of super P on sesquioxide (iron and aluminium rich) soils such as occur in much of the light land of WA. Very high rates of the three P sources were applied to allow for measurement effects into long term and also to depth on this very coarse, P leaching sandy site.
With long term regenerating blue lupins on the high available P treatments, this trial will allow us to investigate soil fertility changes such as soil pH profiles, cation exchange capacity (CEC), soil organic carbon levels (OC%) and nutrient availability. There is also an opportunity to look at the comparative effects on problems being addressed by current projects such as soil non-wetting and subsoil compaction. The site will also be used to demonstrate the value of using nutrient and ripping strips to directly diagnose on farm constraints within paddocks.
Method
History of the site
Briefly, the original trial consisted of 13 treatments. These were nil and 4 levels of P applied as super, C-ore and C-500. There were three replicates (nine for the nil) and the plots were 60 metres long and 2.1 metres wide on 3 metre centres.
The P was top-dressed immediately prior to seeding and the high rates of P (involving multiple runs with a drill with possible sub-soil compaction) allowed for the long term run down in availability of P. In the initial years, the trial had sweet lupins (L angustifolius – cv Illyarrie) in 1980 and 1983, sown sub-clover pasture (Seaton Park) in 1981, Pitman Serradella in 1982, volunteer pasture (subclover, serradella, capeweed, erodium and rye grass) in 1984 and 1985. Prior to seeding in 1986, 4 rates of P were applied to the 1980 nil plots and adjacent, previously un-fertilised land resulting in 3 replicates of 17 main treatments (nil and 4 rates of P from 4 "sources" super 1980 (s80) and 1986 (s86), C-ore and C-500. Jacup wheat, Mortlock oats and Forrest barley were sown across the P rate treatment plots and basal dressings of potash, sulphur and nitrogen were also applied.
Since 1986, nothing has been done to the site except for occasional grazing by sheep and kangaroos. However, blue lupins (L cosentini) have been introduced to the site at some unknown time. In 2013, Bill Bowden noticed that old plots were showing marked treatment effects (Fig 1.). Closer inspection showed that some treatments stood out as heavy stands of blue lupins (estimated at 5-7 t/ha biomass when in full pod) while the low performing plots had about 1 t/ha of volunteer grasses (rye grass, silver grass, soft brome and rip-gut brome) and herbs (sparse serradella, erodium and capeweed).
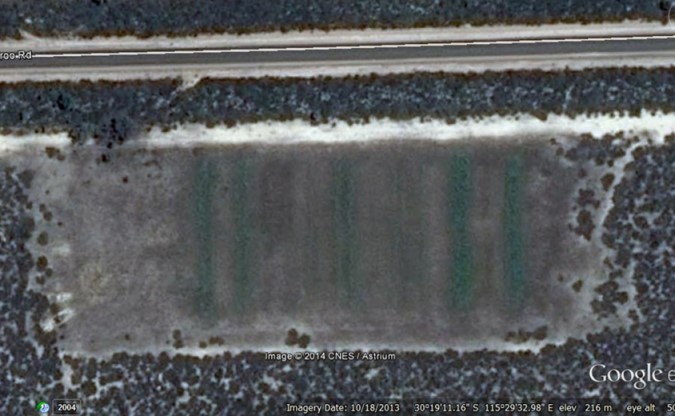
Figure 1. October 2013, Google satellite image of the trial site
Current intentions
The plots were relocated and 0-10 cm soil samples were taken from selected treatments in the spring of 2014. Biomass ratings were taken and attempts will be made to recall and analyse historical satellite imagery of the site. Google earth has images back to 2004. Profile soil samples will be taken in the autumn or winter of 2015 so that P balances can be calculated. Samples will also be analysed for various soil fertility factors and compared with previous published analyses. We also have access to soil samples taken in the 1980s and currently in DAFWA’s soil bank. These were used for non-wetting measurements and can be used for further chemical analyses.
In 2015 the site will be bio-assayed using a wheat crop sown across the original plots. Cross strips of adequate N and P fertilisers as well as a deep cultivation strip will be used to test for responses to the removal of nutritional and subsoil constraints.
Results
The plots were rated for lupin biomass levels in October 2014. Assuming a maximum biomass of 6 t/ha, the results for selected treatments are shown in Table 1.
Surface soil samples (0-10 cm) were taken from selected plots and analysed for various fertility factors (table 1.)
Table 1. Mean results of 0-10cm soil analyses and biomass ratings of selected treatments from 80Ba6 in 2014.
| P applied (kgP/ha) |
P fertiliser (source) |
Mineral N (mg N/kg) |
Colwell P (mg P/Kg) |
Colwell K (mg K/Kg) |
Organic Carbon (%) |
Total N (%) |
CEC (meq/100g) |
pH Level (CaCI2) |
total P (mg P/kg) |
Lupin rating (t/ha) |
Non wetting (wdpt min) |
|---|---|---|---|---|---|---|---|---|---|---|---|
| 0 | virgin '80 | - | 2 | - | 0.03 | 0.02 | 1.3 | 5 | 27 | - | 0 |
| 0 | nil | 2.3 | 3.3 | 32 | 0.83 | 0.07 | 2.25 | 5.3 | 73 | 0.1 | 1 |
| 237 | c500 | 2.3 | 4.3 | 39.7 | 0.98 | 0.09 | 2.62 | 5.3 | 94 | 2.5 | 75 |
| 396 | c500 | 3.3 | 6.3 | 37.3 | 1 | 0.08 | 2.53 | 5.3 | 130 | 3.8 | 94 |
| 792 | c500 | 5 | 14.7 | 35.3 | 1.19 | 0.09 | 2.7 | 5.5 | 235 | 5.4 | 161 |
| 1188 | c500 | 4.5 | 20 | 39 | 0.93 | 0.09 | 2.42 | 5.5 | 318 | 5.9 | 127 |
| 693 | core | 2.7 | 4.3 | 39.3 | 1.01 | 0.08 | 2.68 | 5.4 | 285 | 0.6 | 22 |
| 1386 | core | 2.7 | 6 | 41.7 | 1.04 | 0.08 | 2.97 | 5.6 | 489 | 1.8 | 43 |
| 210 | super '80 | 2.7 | 4 | 41.3 | 1.08 | 0.08 | 2.36 | 5.4 | 84 | 2.6 | 45 |
| 420 | super '80 | 4.3 | 5 | 43.7 | 1.17 | 0.09 | 2.74 | 5.3 | 66 | 3.8 | 66 |
| 130 | super '86 | 2 | 4.7 | 41 | 0.96 | 0.08 | 2.69 | 5.4 | 74 | 1.1 | 27 |
| - | mean SE | 0.8 | 1.9 | 4.6 | 0.11 | 0.01 | 0.31 | 0.1 | 54 | 0.7 | 36 |
In the absence of an ANOVA, twice the mean SE serves as an approximate LSD (P=5%) to discriminate means of parameters between treatments.
Apart from the obvious relationship between applied P and soil P measures (see below) the better (historical?) lupin growth on some treatments is not reflected in pH, total N%, OC% or CEC.
The soil on all treatments is extremely non-wetting to the level of being expressed in minutes in Table 1. Wettable soil has a water drop penetration time (wdpt) of less than 10 seconds. Measurements of wdpt on 1980, 1981 and 1986 surface soil samples from the DAFWA soil bank, were less than 10 seconds for all treatments and the virgin bush soils. Blue lupins are known agents of soil non wetting but even where they did not grow on the nil and low 2014 blue lupin plots, there were severe non wetting problems.
Discussion
At this site there has been an increase in soil organic matter on the nil P plots, from the initial 0.3% to about 1% OC. At the same time, the total P concentration in the top soil has increased from 30 to 70mg P/kg, which indicates that there has been transport of P across the plots equivalent to about 60 kg P/ha.
Assuming a surface bulk density of 1.5 g/ml, we currently have the data to estimate the recovery total P in the surface soil (Table 2).
Table 2. The percentage of 1980 applied P in the top 10 cm of soil
| Source | kg P/ha | 1982 | 1986 | 2014 |
|---|---|---|---|---|
| C500 | 1188 | 49 | 29 | 31 |
| Core | 1386 | 59 | 40 | 45 |
| Super | 420 | 12 | 0 | 0 |
The least soluble source – Core – still has over 40% of the original applied P retained in the surface. The citrate soluble source – C500 – retains about 30% of the applied P. Unsurprisingly, most of the P in the water soluble source – superphosphate -- was lost from the top 10 cm of soil after 2 years. Profile sampling in the autumn of 2015 will allow us to see how far that P has moved down the profile.
The residual value of any nutrient input depends on reductions (and accretions) in availability via organic and inorganic fixation into unavailable forms and/or absolute losses from the budgeted system.
Organic losses come in the form of export of products, transport off the site or to camps, fixation into soil organic matter and/or erosion of that organic matter. In this case, export after the first 6 years would be minimal except in the very occasional (if any) grazing the site received over the years. Erosional losses would have been minimal because the site was kept as a pasture ley with minimal grazing in the summer. Fixation into soil organic matter would have reduced P availability but differences in OC% between the treatments are minimal.
Inorganic losses of P availability come from erosion (minimal), animal cycling (minimal), and fixation by the soil (minimal because of very low colloid levels in the soil). Leaching on this particularly low P adsorbing site is highly likely for water soluble P such as that supplied in superphosphate.. Losses from the top 10 cm of soil would be highly likely. In Table 3 of Bolland et al 1987, the recovery of total P in the top 50 cm of soil from super is much less than from the other 2 sources.
When bicarbonate extractable P (mg/kg) is expressed as a fraction of the P applied in kgP/ha (“extractability” in Bolland et al 1987, Fig. 6.) the values fall markedly through time for super but, although much lower in value, initially rise and then fall through time for the less soluble sources. This study adds the 30 plus year data points (Fig 2.)
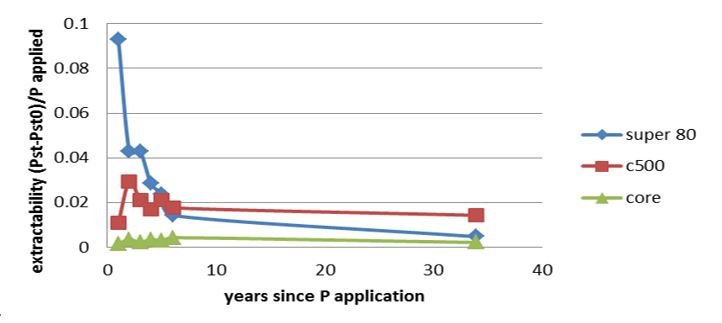
Figure 2. Changes in the availability of P from the 3 P sources through time
An extractability of less than 0.1 for superphosphate is found only on these P leaching soils (on most soils it sits between 0.2 and 0.3). Although the soil test P changes following P application is low for these soils, the critical soil test is also low because the crops and pastures y have access to more available P below the sampling depth.
The residual effect on lupin biomass of 34 year old P applications is plotted in Fig. 3. Responses to current dressings of superphosphate would be 90% at 10-20 kg P/ha. Here the 34 year old super and C500 dressings need about 700 kg P/ha to give 90% of maximum yield – a factor of about 50 difference in unit availability. The Core is still very unavailable.
When plotted out vs soil test P, the blue lupin biomass responses of all sources fall roughly on the one curve. This contrasts with the observed results for other species in 1983 and 1986 (Bolland et al 1987). If the economics were right, C500 could be used as a long term maintenance fertiliser on leaching soils with a high P history.
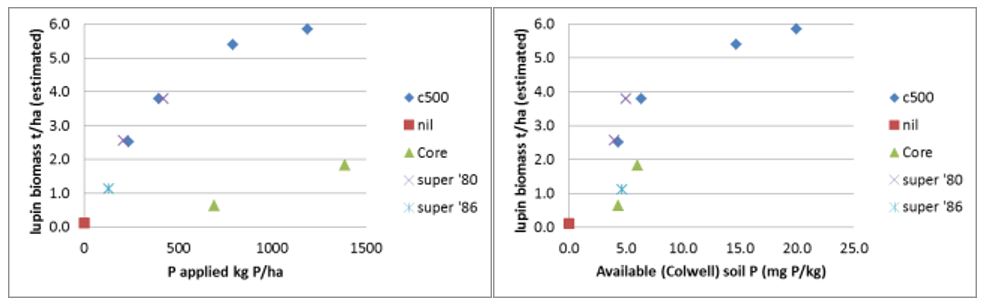
Figure 3. Effect of 1980 P level (left) and soil test P (right) for 3 P sources, on lupin biomass (t/ha estimated) in 2014
Conclusion
30 years after application, water soluble P leaches to depth on grey sands but is still effective for the growth of deep rooted blue lupins. On the one-hand, the citrate-soluble P in C-500 releases more slowly through time and so has a longer term residual effect than water soluble P. On the other hand, higher rates of C-500 are required than superphosphate to reach maximum yield when soil P levels are low. It is less likely to leach and so pollute ground waters. If cheap enough, C-500 could be used as a maintenance P fertiliser. Much work is still to be done on this trial site.
Was this page helpful?
YOUR FEEDBACK