Cost of production - implications for profitability
Author: Phil O'Callaghan (ORM Pty Ltd) | Date: 13 Mar 2015
Take home messages
- Leading farmers have increased production efficiency to around 80% of APSIM modelled potential. They have responded to the need for increased productivity by pioneering and adapting new technologies.
- Since the mid 1990’s farm scale has increased by 57% mainly through land acquisition and has targeted increased efficiency in machinery, labour and overheads.
- Since the mid 1990’s farming systems have intensified, and when combined with increased scale cropped area has increased up to 78%.
- Total farm income, over the last 20 years, has increased up to 3 fold. Total farm costs have increased by a similar amount so that farm profit has not increased.
- A better understanding of the cost of production and financial risk management is essential for farming businesses to prosper into the future. Farmers and their advisers need to understand the drivers of profitability in the business, and how the business compares with others in the industry. An important criterion of risk is the relationship between losses in poor years versus profits in good years.
- Crop planning budgets should be developed on actual yield (last 5 years) rather than possible or modeled yields.
- Understanding climate risk and how to manage the vagaries of the weather with rotation/crop choice, sowing opportunities (frost and heat shock), and inputs (in particular N) need to be better managed by using tools such as Yield Prophet®.
- Managing risk through cost control has become the key to sustainable profits and equity growth.
Introduction
Many farmers and agronomists had hoped that production gains were increasing faster than the rising costs of production, but the new management practices have come at a high price. It appears that we are now entering a phase of diminishing returns where increased inputs do not necessarily lead to more profit. Leading farmers in south eastern Australia are concerned that their crop yields have reached a plateau and are asking the question ‘Where are the next production and profitability gains coming from?’ (van Rees et al. 2014).
Income and cost trends
Wimmera income and costs have increased considerably over the last 18 years as shown in Figure 1 and Table 1.
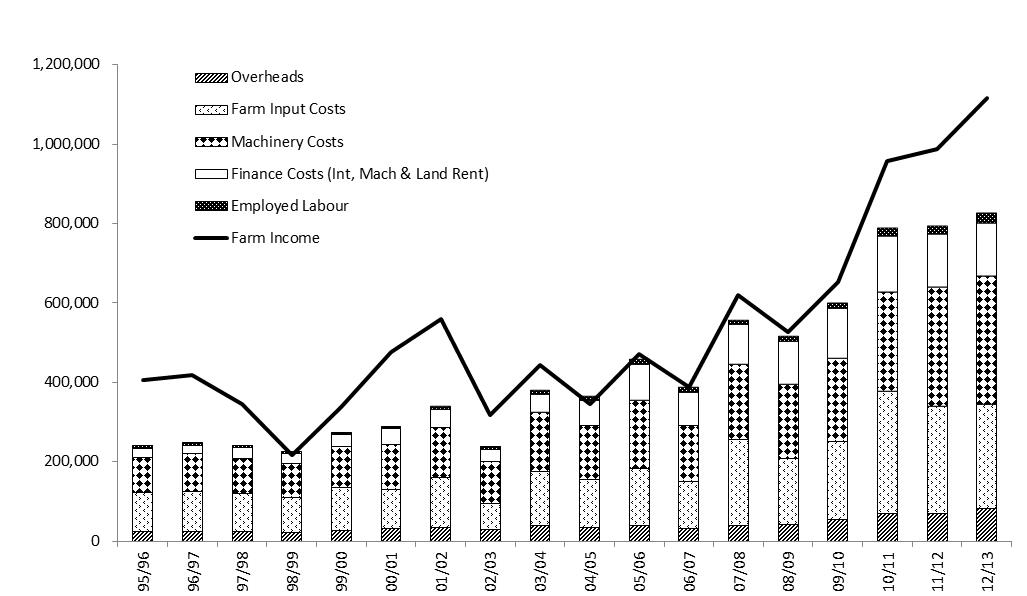
Figure 1. Wimmera farm income and costs from 1995/96 to 2012/13. Source; ORM data.
Table 1. Wimmera farm income and costs from 1995/96 to 2012/13. Source; ORM data.
| Farm Income | First 5 Yr Av $ |
Long-term Average $ |
Last 5 Yr Av $ |
% Change from First 5 Yr Av to Last 5 Yr Av |
|---|---|---|---|---|
| 344,812 | 529,823 | 843,117 | 145% | |
| less Costs | ||||
| Overheads | 25,011 | 40,818 | 64,102 | 156% |
| Farm Inputs | 98,311 | 150,265 | 240,393 | 145% |
| Machinery Operating | 57,744 | 97,076 | 159,404 | 176% |
| Depreciation | 34,054 | 60,812 | 92,189 | 171% |
| Employed Labour | 5,481 | 10,994 | 17,965 | 228% |
| Financial Costs | 26,281 | 70,327 | 128,252 | 388% |
| Farm Costs | 246,883 | 430,293 | 702,305 | 184% |
| Farm Profit | 97,929 | 99,530 | 140,812 | 44% |
| Farm Area (ha) | 1,231 | 1,575 | 1,937 |
|---|---|---|---|
| Crop Intensity | 71% | 74% | 80% |
Increased farm income achieved by:
- Farm Scale has increased by 57%.
- Crop area has increased by 78%.
Costs:
- Overheads have increased by 156%
- Inputs including fertilizer and chemicals has increased 145%
- Machinery including ownership and operating has increased by 175%
- Labour cost (not including family) remains small in dollar terms
- Finance including bank and the interest component of machinery finance has increased the most at 338%
Rainfall and profit
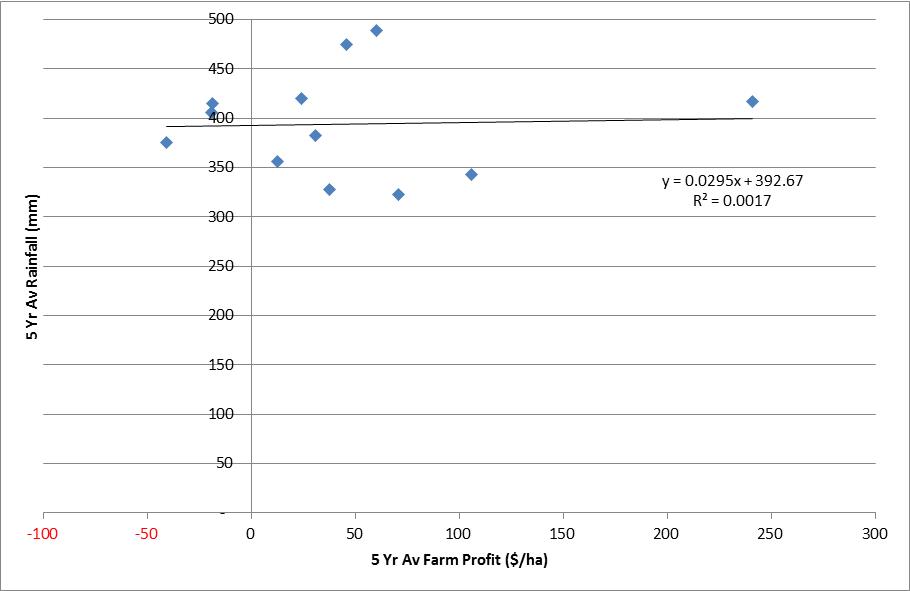
Figure 2. The five year farm profit versus rainfall for a group of Wimmera farms.
Rainfall is the main driver of yield however rainfall does not have the same correlation to profit. Profit introduces costs and includes input costs directly related to production but also other costs such as machinery, labour and debt servicing.
Gross Margin analysis leads to whole farm business performance
Cost structures vary between businesses therefore the breakeven income target and the risk profile is different for each business. The gross margin analysis per enterprise provides a start to measuring the best crop rotation however whole farm business analysis in necessary to determine the most appropriate farming system for each business.
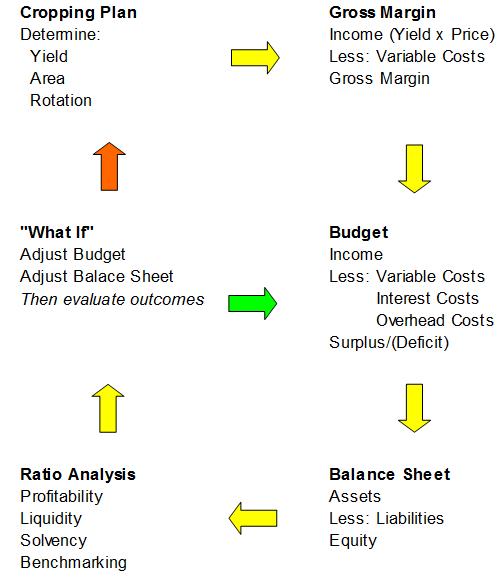
Figure 3. Farm business management process.
Discussion
Leading farmers in the region are questioning whether there are still agronomic options available to increase yield. Current agronomic management systems are very efficient, however debt and the cost of production have increased while margins have not changed and remain highly variable.
Farmers have four options for increasing margins:
- Increasing production efficiency;
- Value adding;
- Decreasing costs; and
- Improving economy of scale and timeliness of operation.
1. Increasing production efficiency
While it is clear that on a regional scale many farmers can still make production gains through improved management to close the yield gap, for leading farmers this is becoming more difficult (Vanrees, 2015).
Most of the improvements in increasing yield have been made. Genetic gain will continue to contribute towards a slow increase in yield, but at 0.5 per cent per annum (Fischer, 2009) it will not be sufficient to increase yield above the rising cost of production.
It appears there are some options to increase production efficiency. However, as a general rule, the options appear limited for leading farmers already producing high yielding crops that are taking full opportunity of available water and nitrogen.
2. Value adding
Storing on farm and delivering direct to markets or port is a form of value adding. This shifts costs from external to within the business so the profit margin on freight and handling is retained within the business.
Increasing the value, or price per tonne of product, is difficult for a bulk commodity. Growing high protein wheat is another option but in a highly variable climate it is difficult, and the benefits of applying additional N fertiliser late in the season is rarely realised.
3. Decreasing costs
The current strategy of maximising profits in good years has resulted in a high input system which has the potential for making substantial losses in dry years, or years with severe frost or heat shock damage. This strategy should be reviewed and the potential and actual impact of losses versus profits has to be clearly defined. Sustainable profitability must be based on profit, not gross production.
Increasing scale has the effect of diluting fixed costs, such as machinery, however this presupposes there is surplus capacity. The opportunity to use contract services could be investigated.
Farmers and their production and financial advisers should track costs, variable and fixed, and develop strategies which reduce cost exposure and risk. This is not an easy task but it is clear that for leading farmers the yield gap has closed and managing the cost of production and risk is the key to long term profitability. Agronomic advisers need to understand the position of the business they are advising and tailor advice accordingly. Training agronomic advisers in farm financial management and risk assessment is required.
4. Improving economy of scale and timeliness of operation
Improved utilization of machinery, new technology and labour efficiency each provide benefits to overall profitability. ‘Scalable units’ can be determined for each resource such as headers, seeders and labour units. The balance between capital cost for scale and timeliness operation can be measured with guidelines such as:
- Harvest completed in 21 working days
- Seeding can be done in 21 working days
- Labour units generate average gross income of $500,000 (cropping).
Challenges and opportunities
- New farming practice/genetics to help yield and price (income).
- Match costs of production to risk profile for each business and climate.
- Utilize new management principals to improve resource efficiency and timeliness.
- Insure adequate financial buffers to cover uncertainties such as rising interest rates and low income years.
Contact details
Phil O’Callaghan
ORM Pty Ltd
46 Edward St, Bendigo VIC 3550
03 5441 6176
phil@orm.com.au
Was this page helpful?
YOUR FEEDBACK